<?xml version="1.0" encoding="utf-8"?><feed xmlns="http://www.w3.org/2005/Atom" ><generator uri="https://jekyllrb.com/" version="3.9.5">Jekyll</generator><link href="https://semasuka.github.io/blog/blog/feed.xml" rel="self" type="application/atom+xml" /><link href="https://semasuka.github.io/blog/blog/" rel="alternate" type="text/html" /><updated>2024-05-26T05:58:41+00:00</updated><id>https://semasuka.github.io/blog/blog/feed.xml</id><title type="html">MIB</title><subtitle>Learn Machine Learning with projects</subtitle><author><name>Stern Semasuka</name></author><entry><title type="html">Linear Regression, the essential theory</title><link href="https://semasuka.github.io/blog/blog/2023/03/04/linear-regression-the-essential-theory.html" rel="alternate" type="text/html" title="Linear Regression, the essential theory" /><published>2023-03-04T00:00:00+00:00</published><updated>2023-03-04T00:00:00+00:00</updated><id>https://semasuka.github.io/blog/blog/2023/03/04/linear-regression-the-essential-theory</id><content type="html" xml:base="https://semasuka.github.io/blog/blog/2023/03/04/linear-regression-the-essential-theory.html"><![CDATA[<p>Hello Folks! Welcome back. In this post, I will discuss the theory behind linear regression models, one of the wildly used machine learning models to predict continuous variables (fancy terms to say that we are predicting a number, also referred to as numerical target or label). The model is quite simple to understand yet powerful. We use it when model interpretability (when we want to know which dependent variables, aka features, are the most predictive) is required, like in the consumer lending or medical fields where transparency is at its core. In the next post, we will dive deeper into the coding part of a Linear Regression.<!-- more --></p>

<p>This post is the first (certainly not my last) post I have used ChatGPT to help me. ChatGPT did not write this post, of course. I used it in the ideation process, brainstorming, and breaking down some of the topics that I needed help understanding (or thought I understood) to come up with more straightforward explanations that everyone without an extensive academic background could easily understand. ChatGPT is a game changer. Sadly, most people in 2023 have yet to realize that. The world of tomorrow belongs to people who will effectively enhance their abilities and knowledge using AI systems. AI is here to stay; we must embrace innovation because no one can stop it or should.</p>

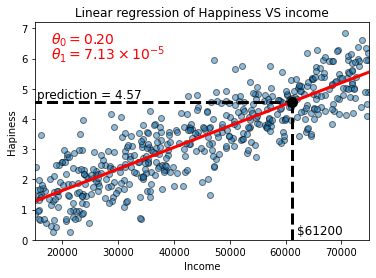
<p>Going back to linear regression, I have briefly discussed linear regression in <a href="https://semasuka.github.io/blog/2021/04/04/demystify-machine-learning.html">this</a> post, where we were debunking the myth “Does money buys happiness?” (spoiler alert! we found out that it does) using a simple linear regression model. In this post, we will dive deeper and discuss the main ideas about linear regression like sum square root (SSR), mean square error (MSE), R-square, and p-value, and finally, touch a little bit on derivate and gradient descent in regards to linear regression (model optimization). We will demonstrate all these with code in Python in the next blog post. This one is just the theoretical part of it. Let’s get started!</p>

<h3>Definition</h3>

<p>Linear regression is part of the linear models family (which assumes a linear relationship between the dependent and independent variables). This family also comprises Logistic Regression (I will have a post on this model very soon), Poisson Regression, Probit Regression, Linear Discriminant Analysis (LDA), and Cox Proportional Hazards Regression. The goal of linear regression is to fit a line (using the best parameter of a straight line, the slope “m”) to the data that minimizes the loss function or cost function (the difference between the predicted output of a machine learning model and the actual output). The loss function helps us measure how well the model performs given a dataset. The lower the loss function is, the better the model performs. The loss or cost function is also called error or residual. For the rest of this post, I will use error to refer to the loss function.</p>

<h3>Illustration</h3>

<p>Let’s use a simple example to illustrate and understand linear regression pragmatically; let’s say you are your country’s president’s economic advisor. Rumors say that the country is on the brink of an imminent recession from what the economists say, and the R word is on everyone’s lips in the media. Surprisingly, the unemployment number looks very low. Now the president asks you: “what is the correlation (mutual relationship) between the unemployment rate and consumer spending rate since we know that consumer spending constitutes 70% of our GDP?”. He remembers correctly from the economic class he took in university that as the employment rate increases, we should also expect consumer spending to increase. As more people are employed and have more money to spend, we should not fear a recession. So he is confused and needs some clarification of what is going on.</p>

<p>As a data nerd, you know that the best way to answer his question is with numbers, and you know what the saying is, right? The numbers don’t lie, so you gather all the unemployment and consumer spending data and start to investigate.</p>

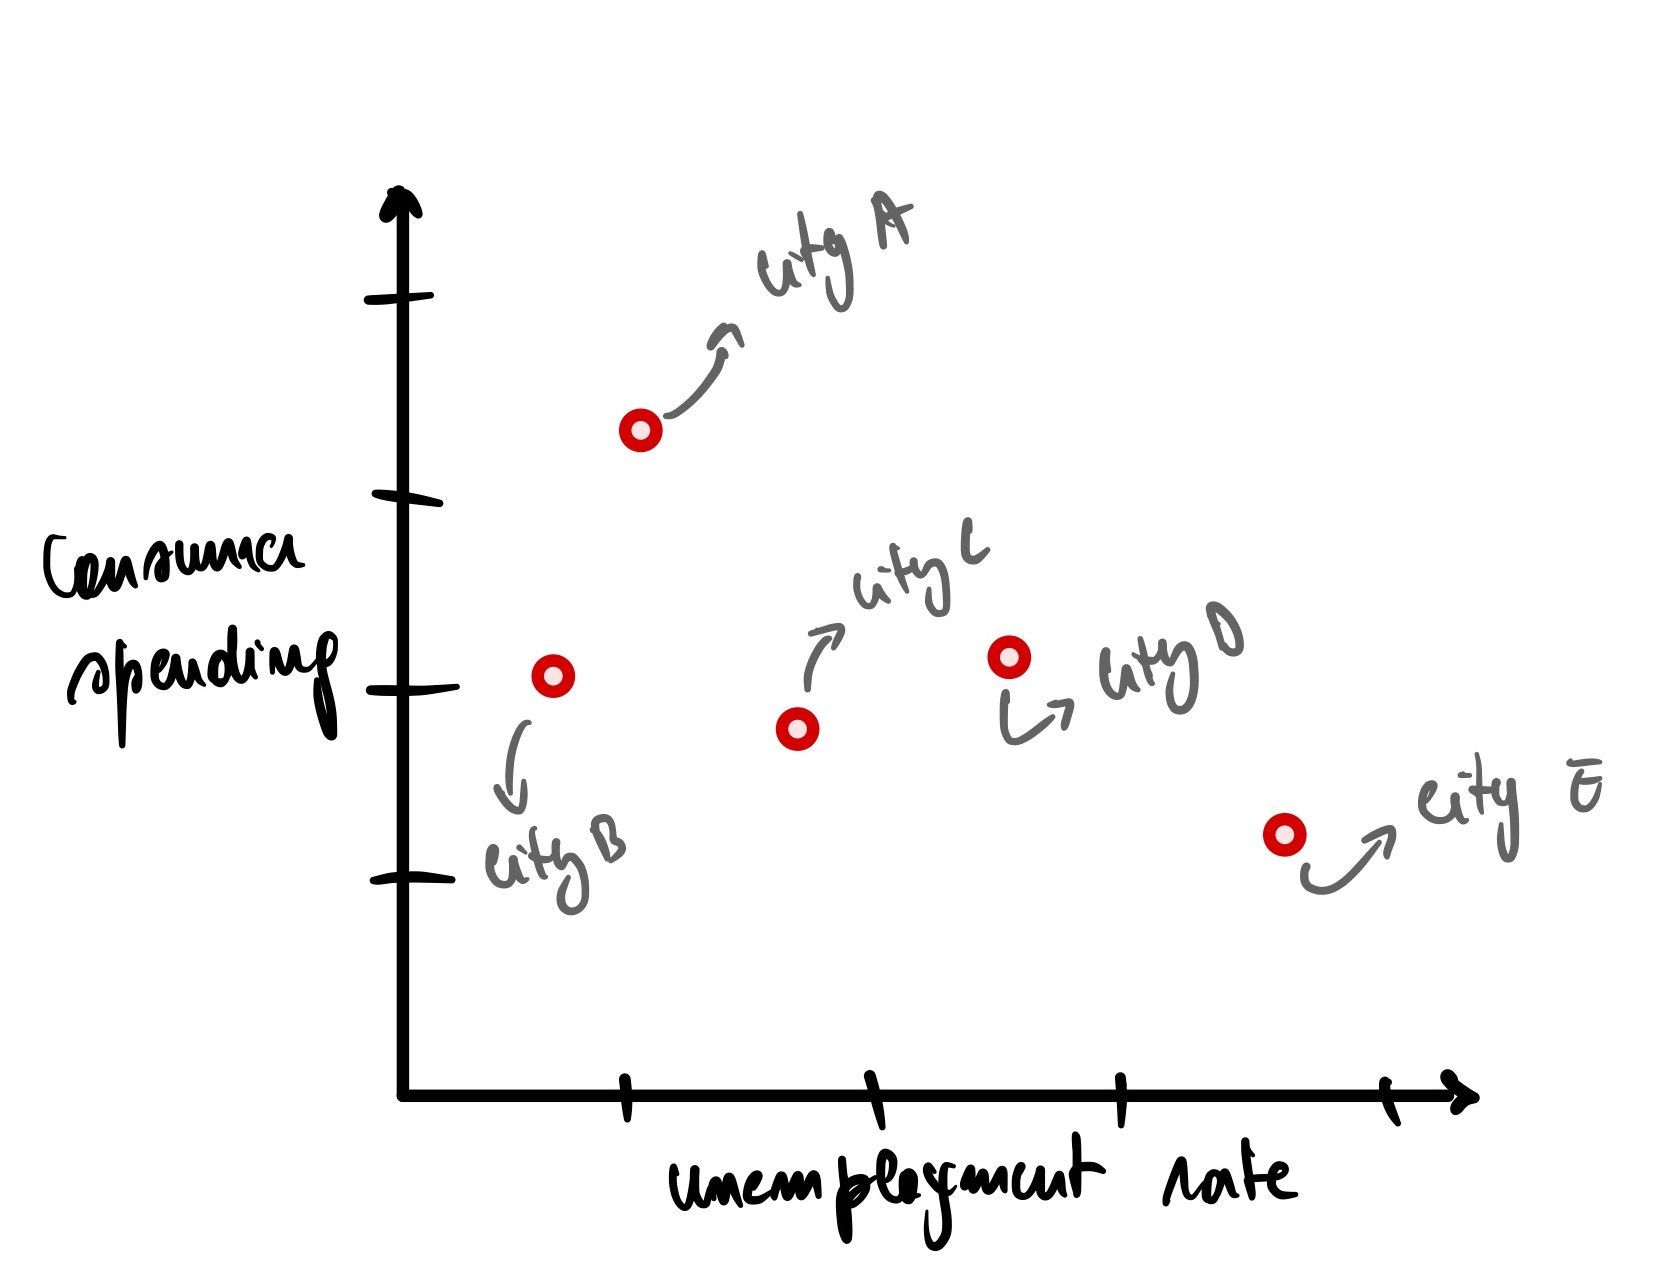
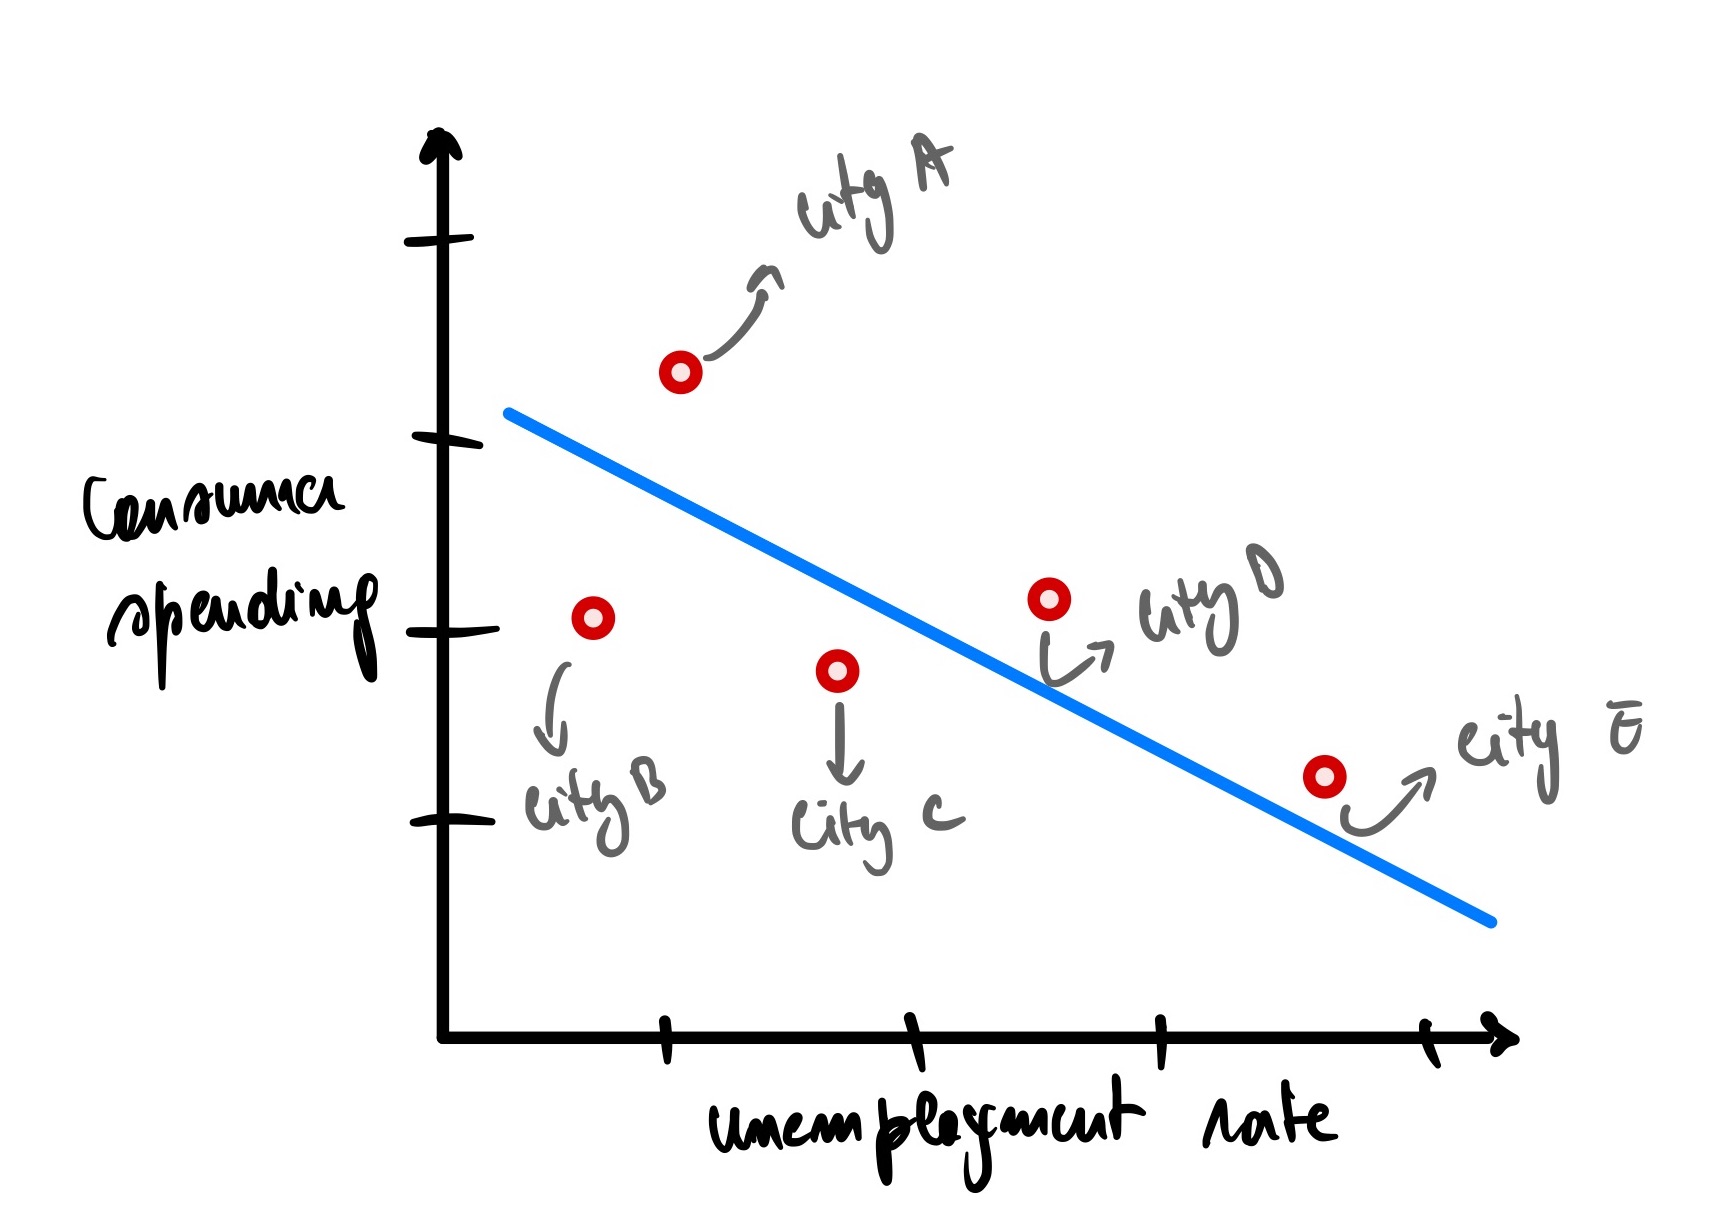
<p>For illustration purposes, you decide to sample the data of 5 random cities in your country.</p>

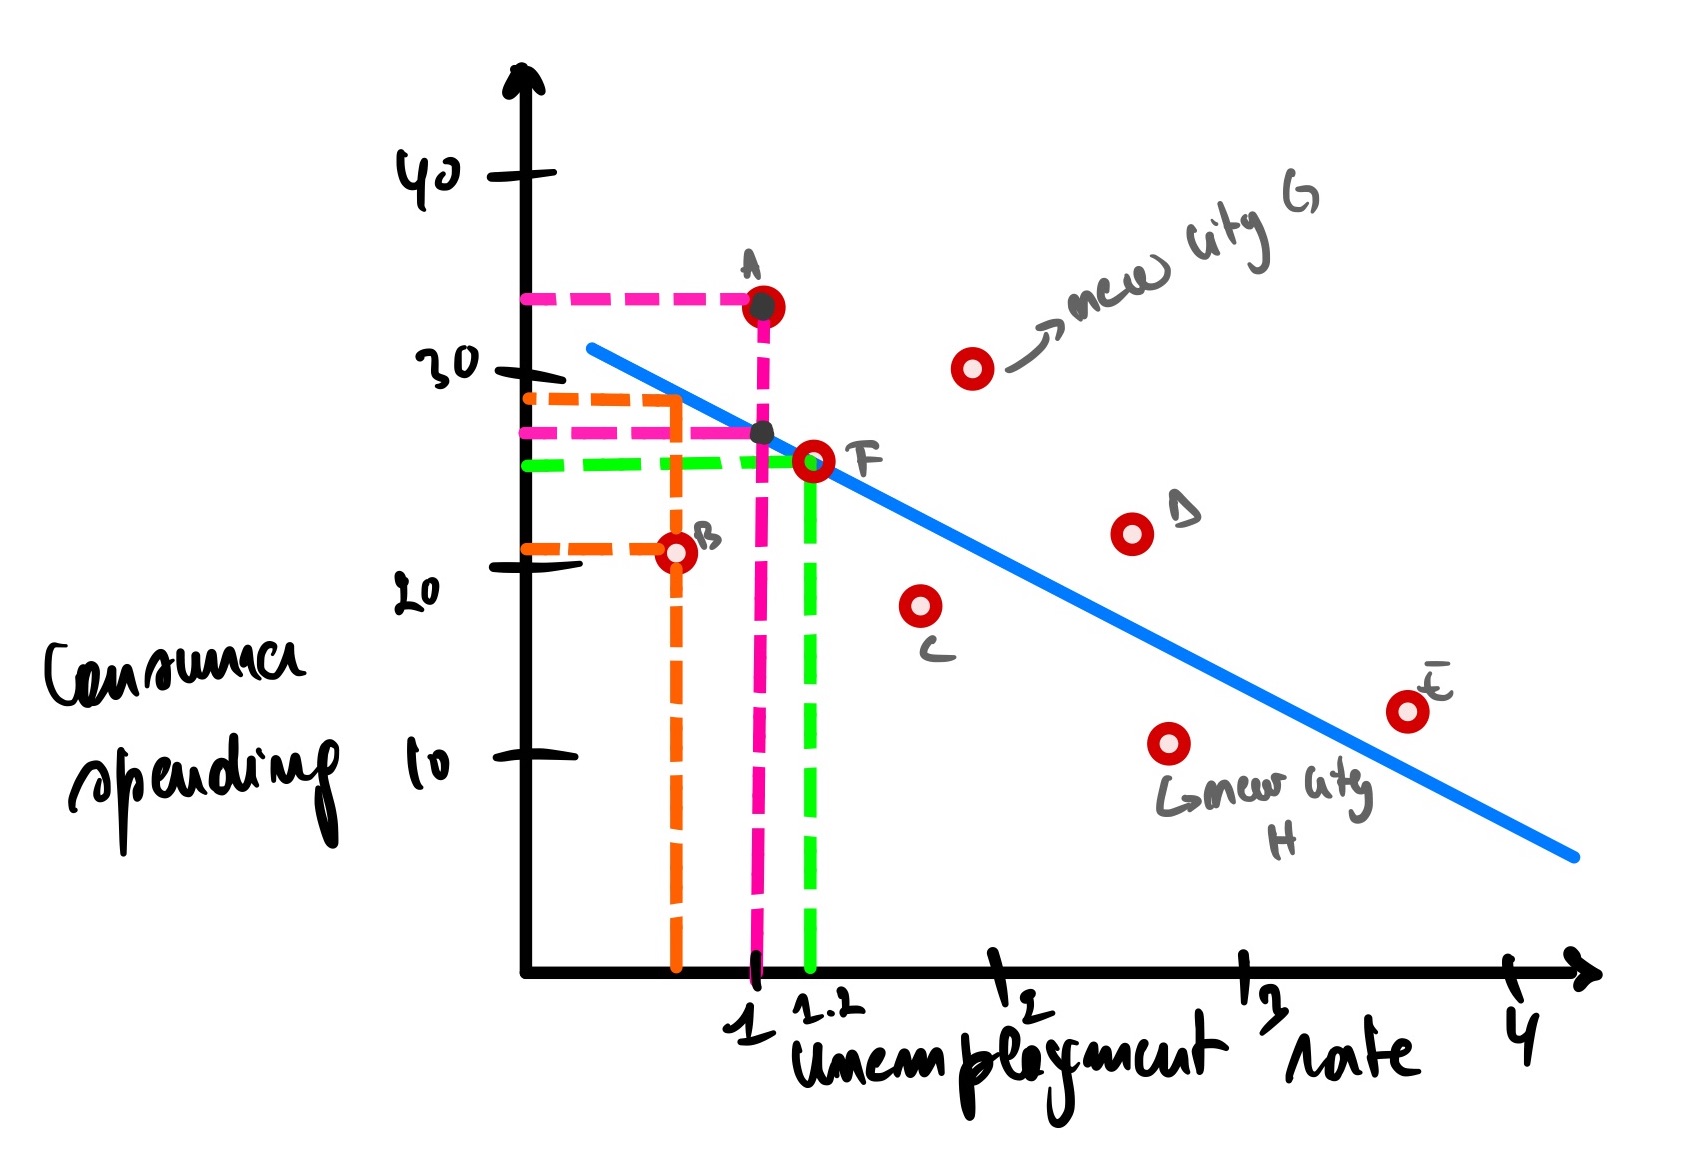
<p><img src="/blog/assets/post_cont_image/unemployment_spending.jpg" alt="unemployment_vs_consumer_spending" /></p>

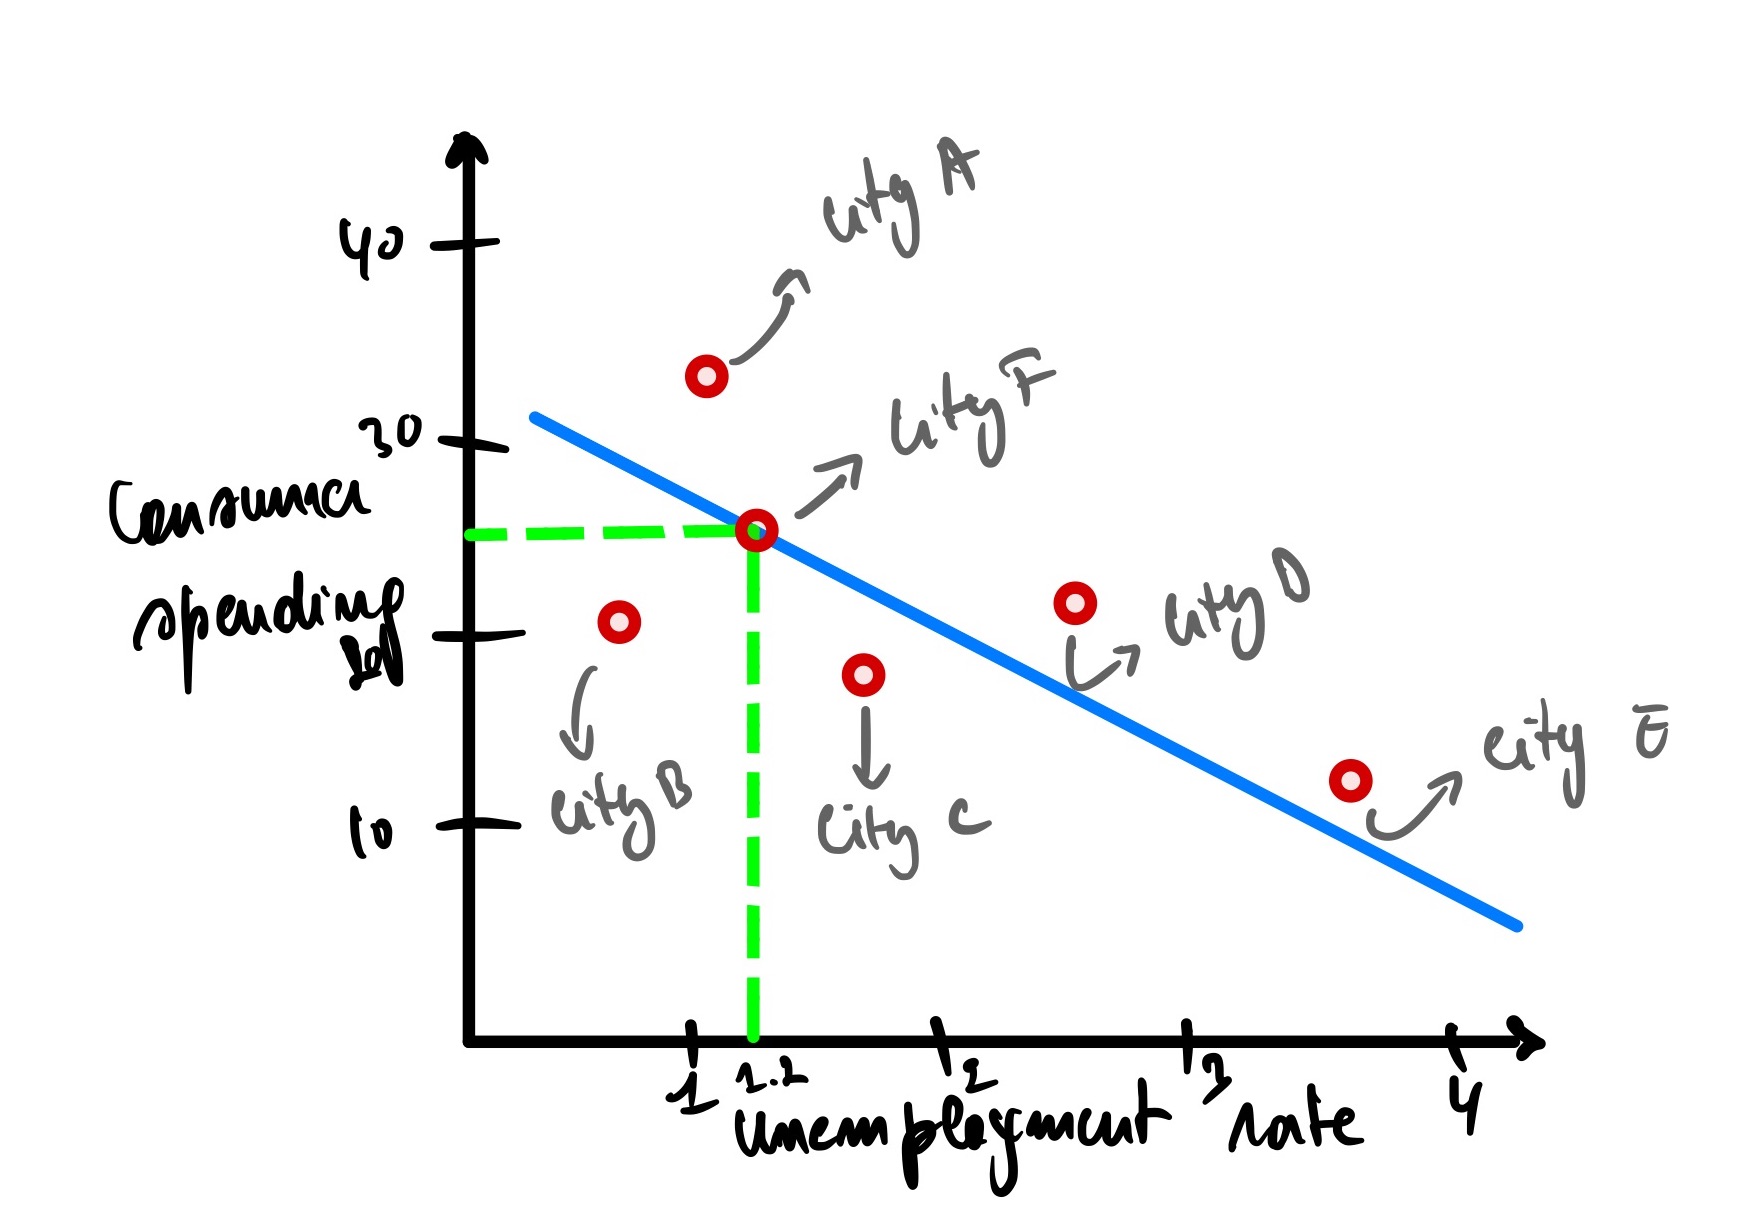
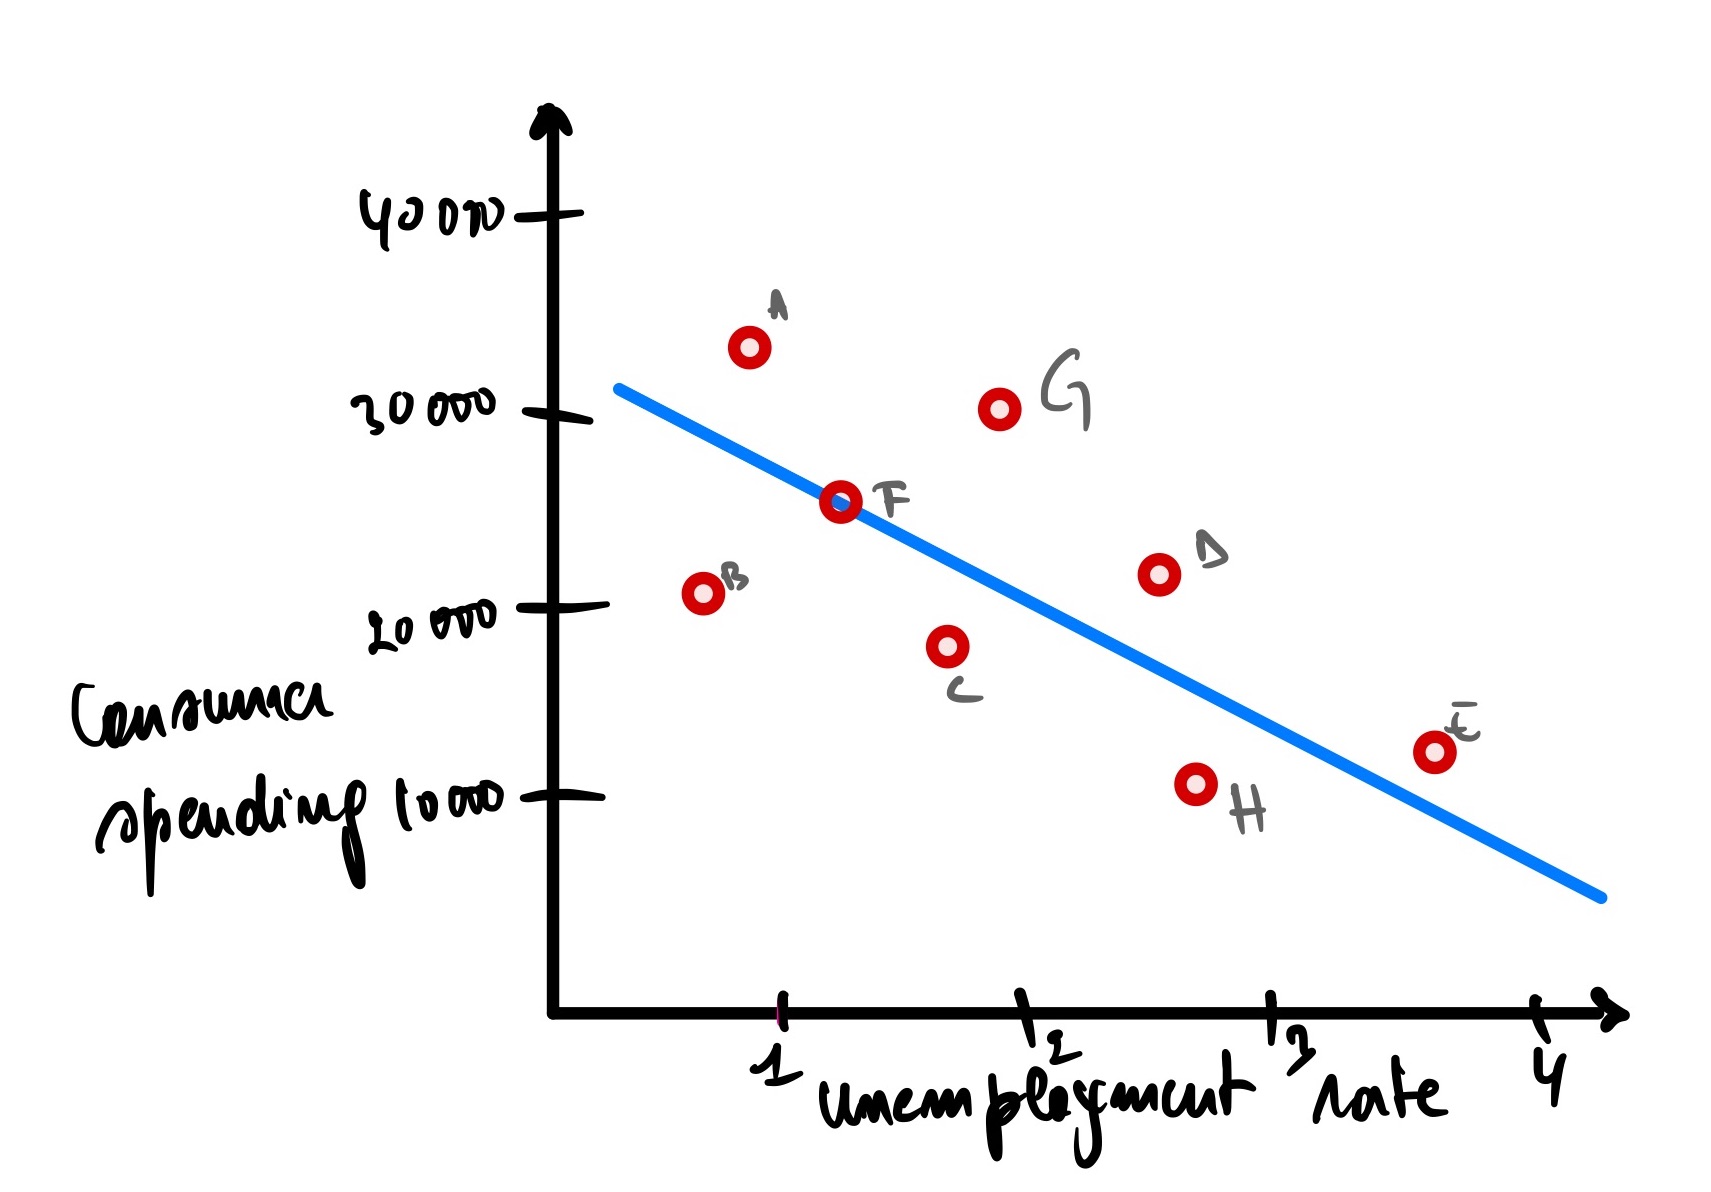
<p>We can see that there is a downward trend here. The more the unemployment rate rises, the less consumer spending in the economy. It makes sense; as people lose their job, they tend to tighten their belts (financially speaking). We can draw a blue line of best fit to visualize this.</p>

<p><img src="/blog/assets/post_cont_image/line_of_best_fit_es.jpg" alt="line_of_best_fit_unemployment_vs_cs" /></p>

<p>We can use this line to predict the consumer spending of city F given its unemployment rate of 1.2</p>

<p><img src="/blog/assets/post_cont_image/pred_unemployment_vs_cs.jpg" alt="predict_city_f" /></p>

<p>Using the graph, given an unemployment rate of city F = 1.2, the predicted consumer spending is 25.</p>

<h3>Sum Squared Error (SSE)</h3>

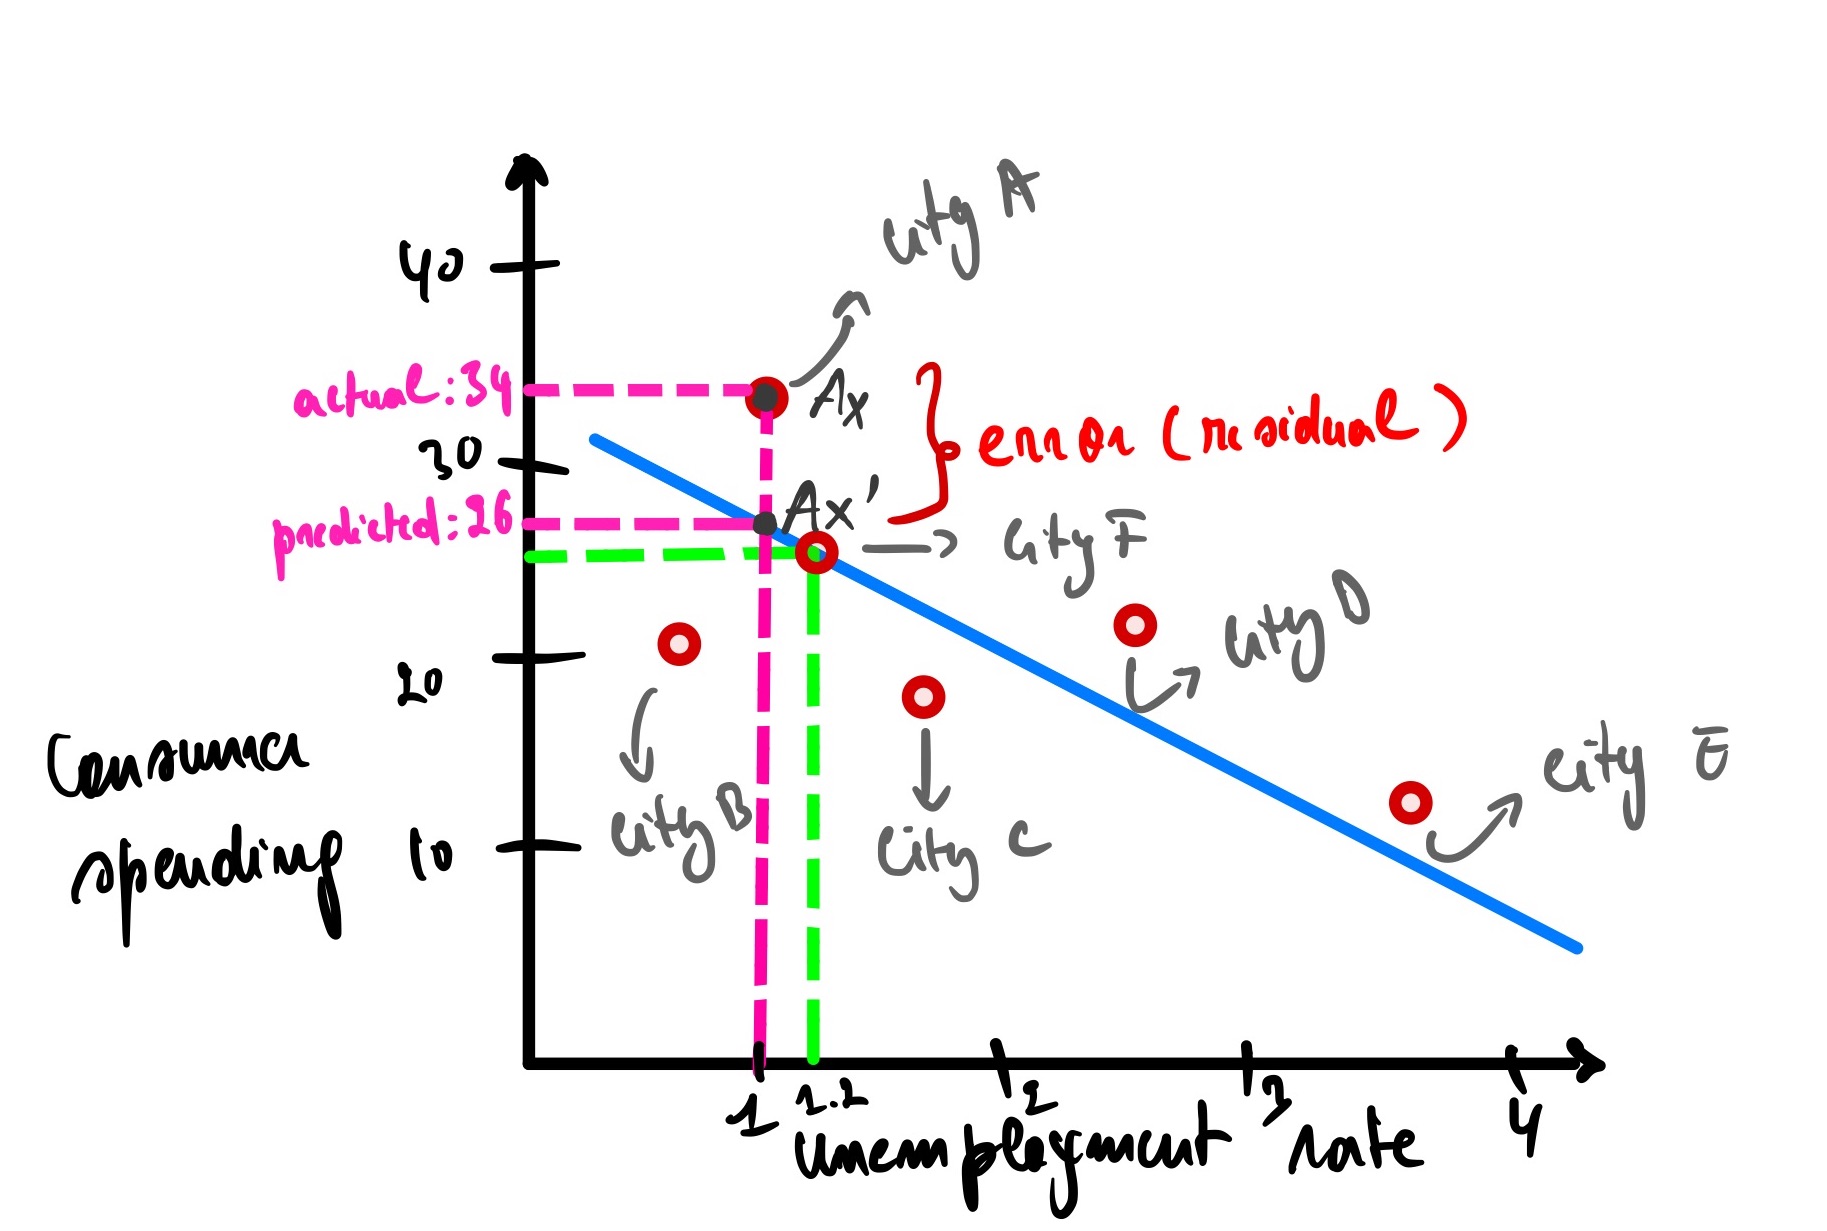
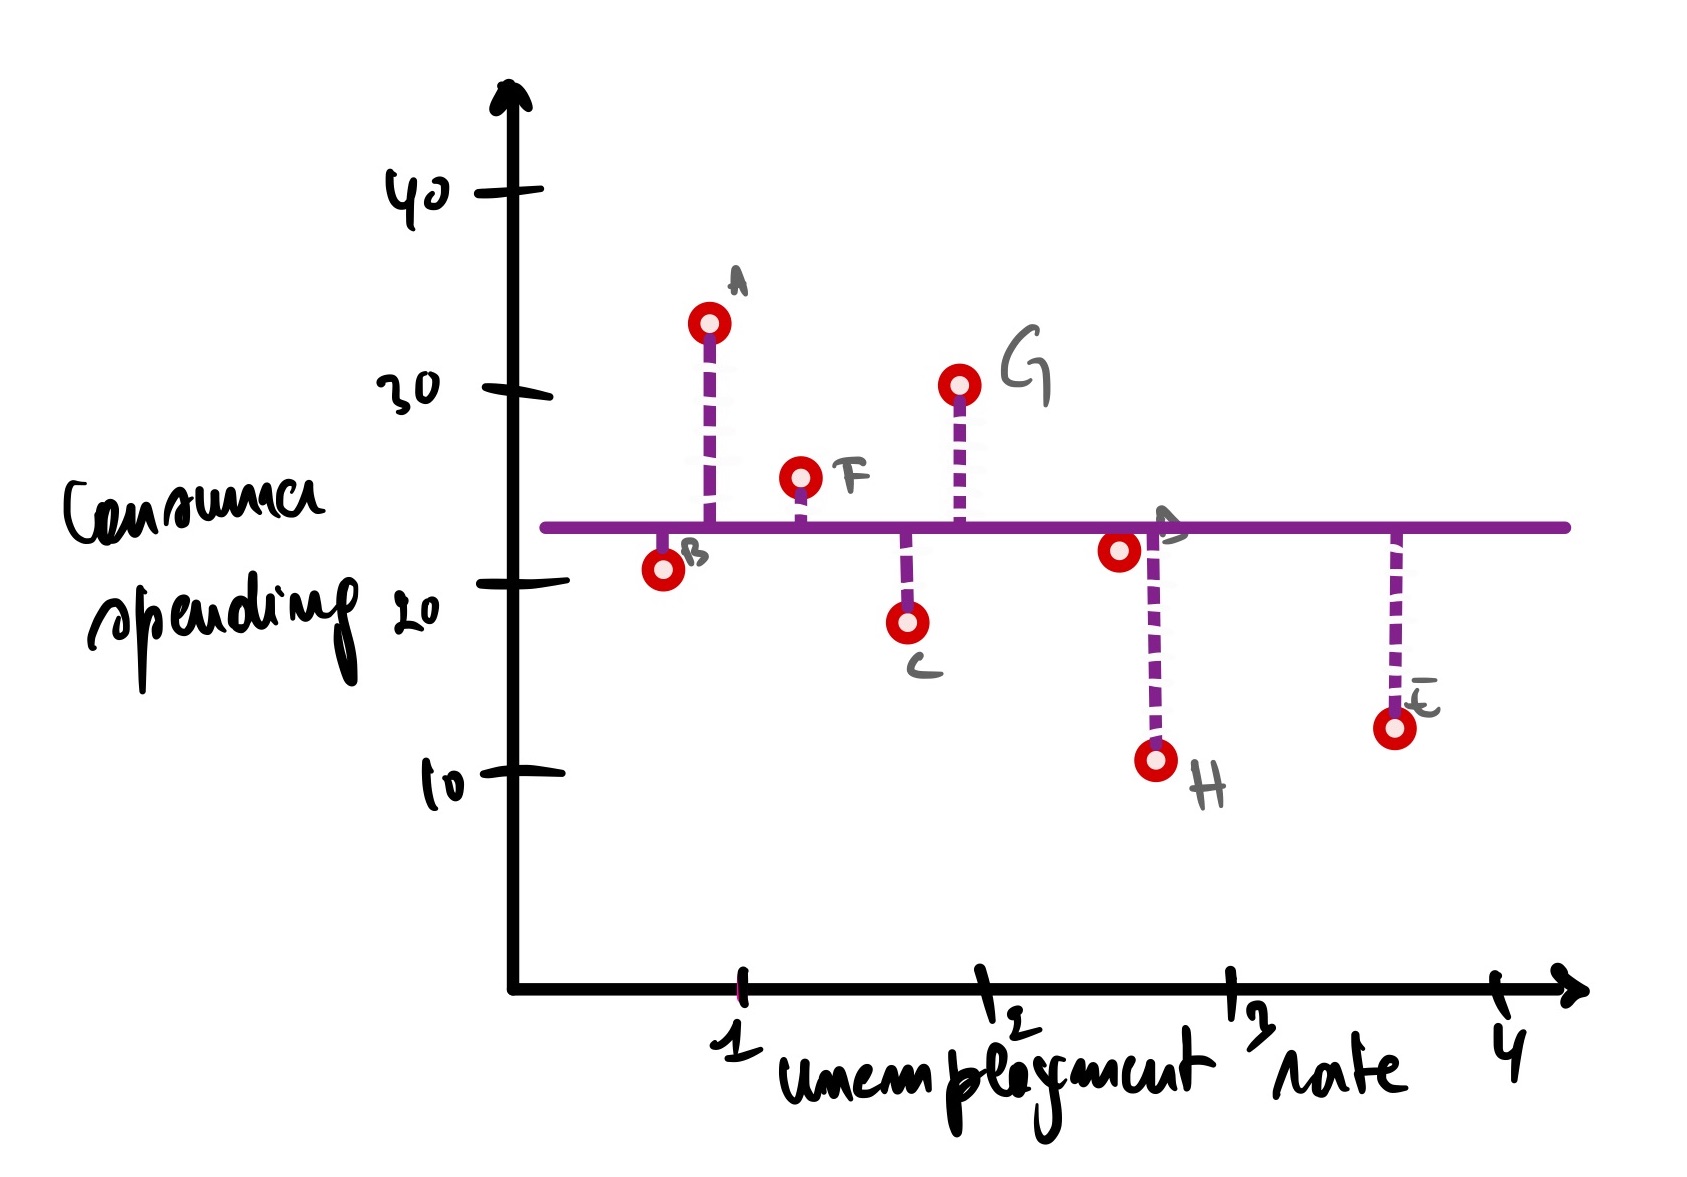
<p>However, our model is not perfect (and it should not be because otherwise, it might be overfitting the data, meaning we won’t be able to predict untrained data). It has errors (also called residual, as discussed earlier), meaning it has actual and predicted data.</p>

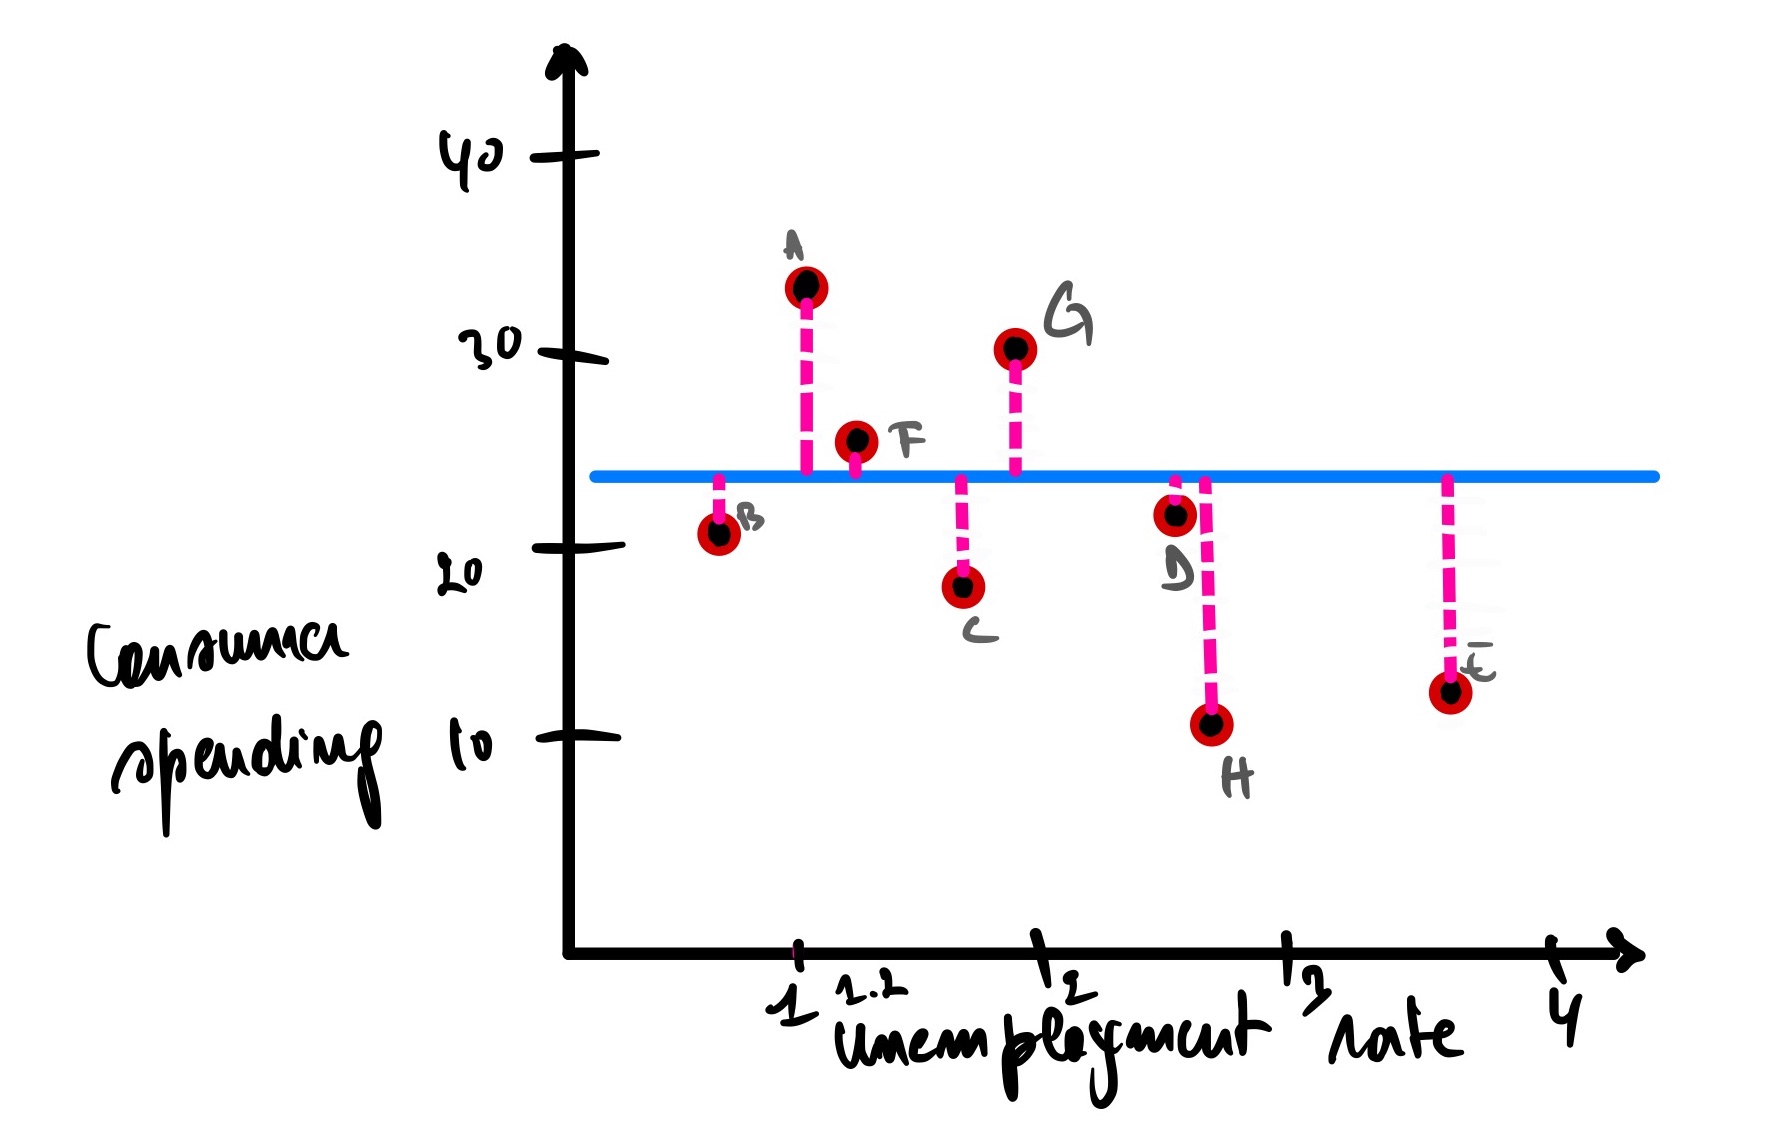
<p><img src="/blog/assets/post_cont_image/error_us_vs_cs.jpg" alt="error_us_vs_cs" /></p>

<p>Analyzing the graph above, city A has an unemployment rate of 1, and the actual consumer spending for this city is 34 (let’s call it Ax), but our model predicts that the consumer spending is 26 (Ax’). There is an error of Ax(actual consumer spending) - Ax’(predicted consumer spending) = 34 - 26 = 8.</p>

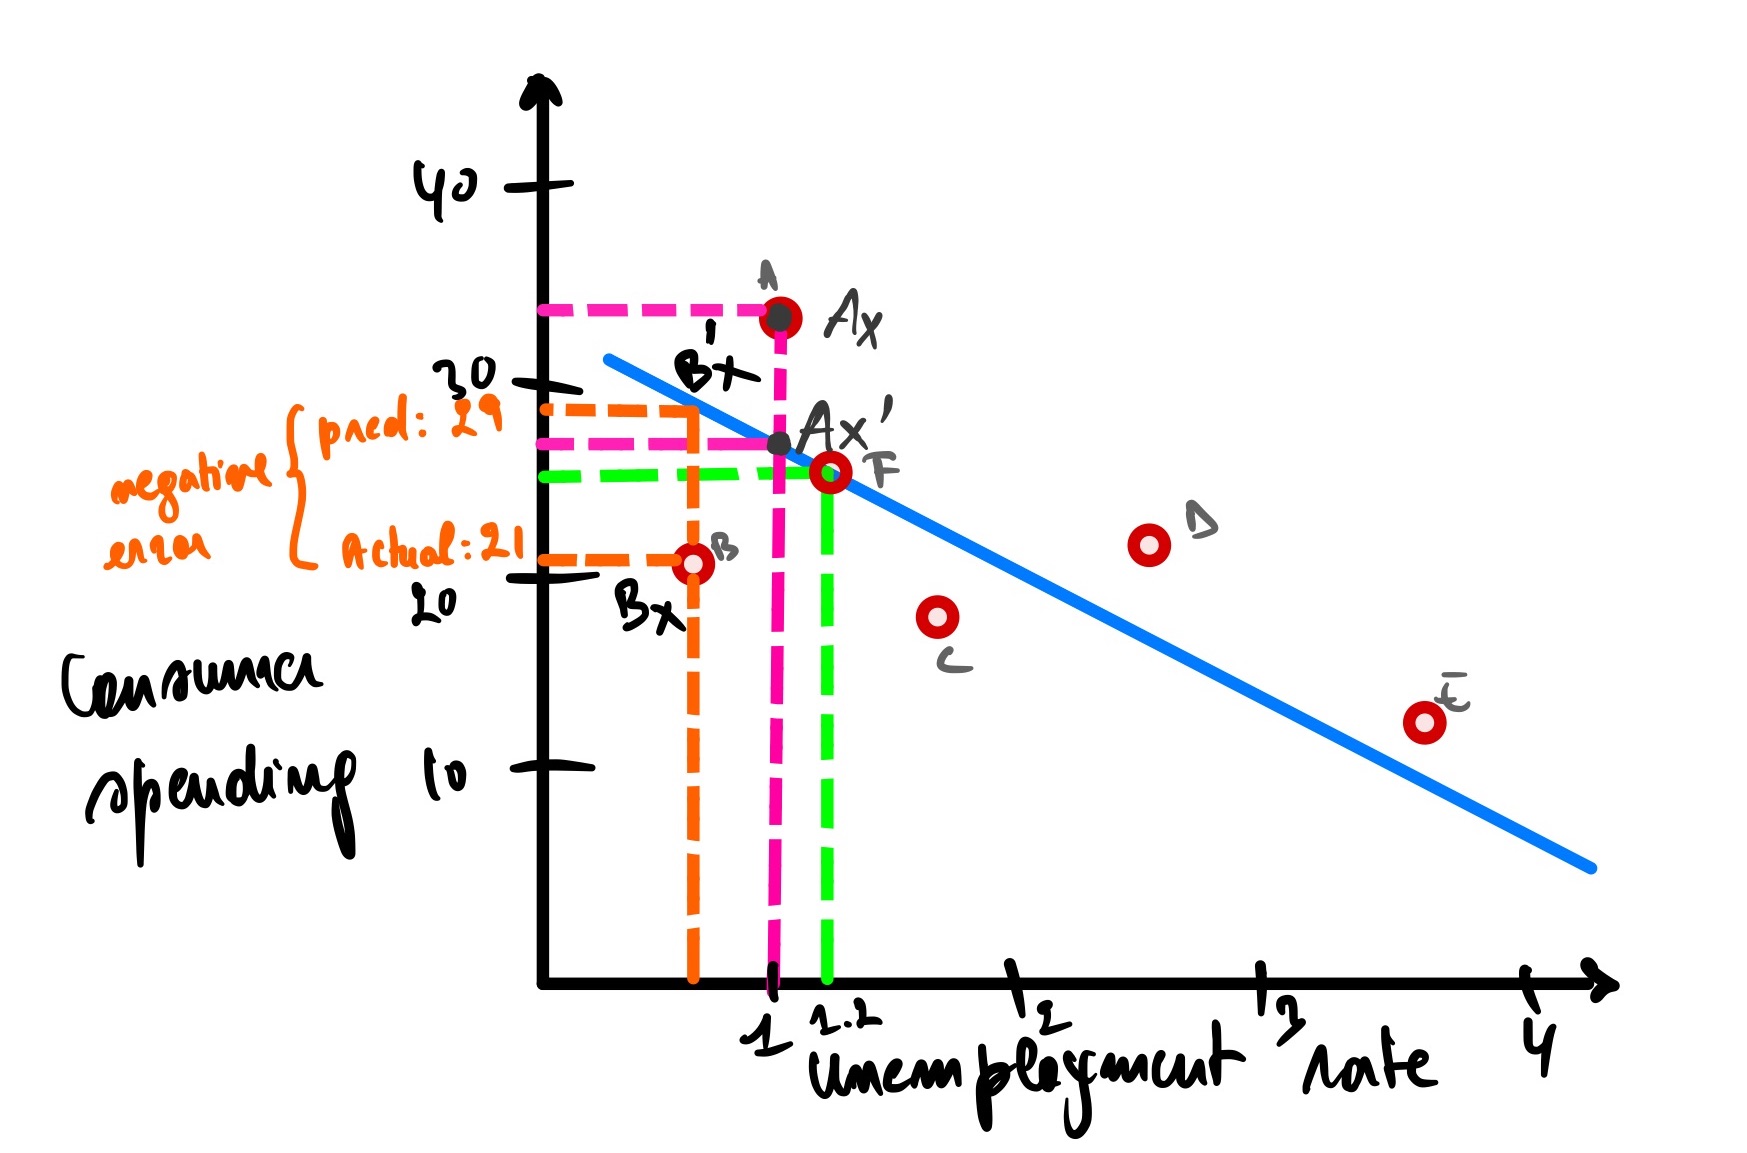
<p>Same as city B, but this time the error is a negative because it is under the blue line.</p>

<p><img src="/blog/assets/post_cont_image/error_b.jpg" alt="error_city_b" /></p>

<p>The error for city B is equal to Bx - Bx’ = 21 - 29 = -8</p>

<p>So now, to get the total error of all the cities, we summate all errors for each city.</p>

<p>(Ax - Ax’) + (Bx - Bx’) + (Cx - Cx’) + (Dx - Dx’) + (Ex - Ex’) + (Fx - Fx’)</p>

<p>The problem with this expression is that some errors are negative values, which will cancel out the positive ones. One way to overcome this is to use the absolute value, but a better way is to square the difference between the actual and predicted values since we will be using square root functions.</p>

<p>(Ax - Ax’)² + (Bx - Bx’)² + (Cx - Cx’)² + (Dx - Dx’)² + (Ex - Ex’)² + (Fx - Fx’)²</p>

<p>We can abbreviate it like this</p>

<p>∑(yᵢ - ȳ)²</p>

<p>Where:</p>
<ul>
  <li>yᵢ represents the actual consumer spending of the i-th city</li>
  <li>ȳ represents the predicted consumer spending of the i-th city</li>
  <li>∑ represents the summation</li>
</ul>

<p>The smaller the result, the smaller the error the linear regression makes, and the better our linear regression fits our data. Our objective is to minimize it as much as we can.</p>

<p>The result is called Sum Squared Error (SSE), also called Sum Squared Residual (SSR).</p>

<p>SSE = SSR = ∑(yᵢ - ȳ)²</p>

<p>So the SSE in this case, is equal to</p>

<p>(Ax - Ax’)² + (Bx - Bx’)² + (Cx - Cx’)² + (Dx - Dx’)² + (Ex - Ex’)² + (Fx - Fx’)² =</p>

<p>(34 - 26)² + (21 - 29)² + (18 - 24)² + (23 - 17)² + (13 - 10)² + (26 - 26)² =</p>

<p>16 + 16 + 36 + 36 + 9 + 0 = 153</p>

<p>With the SSE of this linear regression = 153, finding another linear regression with an SSE &lt; 153 means that this linear regression is worse than the first one. Another linear regression &gt; 153 indicates that this last one is better than the first one.</p>

<p>SSE is one of the metrics used to assess a linear regression, but it has one significant drawback: Adding more data (cities in our case) will keep increasing our SSE. Let’s say; for example, we are adding cities G and H</p>

<p><img src="/blog/assets/post_cont_image/new_city_H_G.jpg" alt="new_city_H_G" /></p>

<p>Now to calculate the new SSE with the new cities included = 153 + (Gx - Gx’)² + (Hx - Hx’)² = 153 + (31 - 23)² + (10 - 15)² = 153 + 64 + 25 = 242</p>

<p>Now we have a new SSE of 242. Would you conclude that this new linear regression with 7 cities is worse than that with 5? Of course not, so having a higher SSE does not always implies the worst model.</p>

<p><strong><em>This is the main disadvantage of using SSE.</em></strong></p>

<p>So how do we overcome this issue? Enter Mean Square Error(MSE)</p>

<h3>Mean Squared Error (MSE)</h3>

<p>The mean squared error is very similar to the sum square error; the only difference is that it is insensible to the number of data we have. If we add more cities, it would not drastically change the MSE.</p>

<p>How is the MSE different from the SSE? We divide the SSE with the number of data (n), and that’s it!</p>

<p>The formula of MSE is ∑(yᵢ - ȳ)²/n</p>

<p>Let’s see this in practice.</p>

<p>So to find the MSE of the six cities(A, B, C, D, E, F), we take the SSE of 153 and then divide it by 6 = 25.5</p>

<p>So now let’s find the MSE of the 8 cites(A, B,C, D,E, F,G, H); we take the SSE of 242 then divide it by 8 = 30.25 which is not far off to 25.5</p>

<p>MSE is a better metric to use than SSE, but this metric could also be better; let’s see this in an example.</p>

<p>Let’s change the scale of how we are expressing the dependent variable(consumer spending), so instead of expressing it in units of 10s, let’s define it in units of 10,000s</p>

<p><img src="/blog/assets/post_cont_image/scalled_cs.jpg" alt="scaled_consumer_spending" /></p>

<p>Now let’s calculate the MSE = 242 000/8 = 30250, which is way larger than the 30.25 we had before.</p>

<p><strong><em>This is the main disadvantage of using MSE.</em></strong></p>

<p>So how can we keep almost the same MSE even though the target scale has changed? R-squared (R²) is the answer.</p>

<h3>R-squared</h3>

<p>R-squared overcomes the drawbacks of SSE and MSE, which are the number of data points and the scale of the predicted variable. In other words, R-squared does not depend on the data’s size or scale. R-squared is the preferred metric for linear regression (this is not written in stone, it also depends on the type of problem you are solving), and we can calculate it from either MSE or SSE, whichever is at hand.</p>

<p>Let’s understand how R² works behind the scene.</p>

<p>First, we calculate the data’s SSE (or MSE) around the mean.</p>

<p><img src="/blog/assets/post_cont_image/r2_mean.jpg" alt="r-squared-mean" /></p>

<p>The consumer spending means is 22500, so now the SSE around the mean is equal to</p>

<p>∑(yᵢ - µ)² =</p>

<p>(Ax - µ)² + (Bx - µ’)² + (Cx - µ)² + (Dx - µ)² + (Ex - µ)² + (Fx - µ)² + (Gx - µ)² + (Hx - µ)² =</p>

<p>(34 - 22.5)² + (21 - 22.5)² + (18 - 22.5)² + (23 - 22.5)² + (13 - 22.5)² + (26 - 22.5)² + (31 - 22.5)² + (10 - 22.5)² =</p>

<p>(11.5)² + (-1.5)² + (4.5)² + (0.5)² + (-9.5)² + (3.5)² + (8.5)² + (-12.5)² =</p>

<p>132.25 + 2.25 + 20.25 + 0.25 + 90.25 + 12.25 + 72.25 + 156.25 = 486</p>

<p><img src="/blog/assets/post_cont_image/new_city_H_G.jpg" alt="new_city_H_G" /></p>

<p>Our normal SSE, as previously calculated, is 242</p>

<p>The formula to get R² = SSE(mean) - SSE(line of best fit)/SSE(mean) = (486 - 242)/486 = 244/486 = 0.5</p>

<p>The result is 0.5 (50% reduction in the size) of the errors between the mean and the fitted line. In other words, R² tells us the percentage of errors around the mean shrank when we used the line of best fit. That means the errors have decreased, meaning that the fitted line fits the data better than the mean.</p>

<p>If SSE (mean) = SSE (line of best fit) or if R² = 0, that means that the two models are equally good (or bad), and when SSE (line of best fit) = 1, meaning there has been a 100% improvement of the model. Then the model fits the data perfectly (which is not always a good thing. see overfitting on <a href="https://semasuka.github.io/blog/2021/04/04/demystify-machine-learning.html">this post</a>)</p>

<p><strong><em>Note</em></strong></p>

<ul>
  <li>
    <p>As we mentioned before, R² can be calculated with MSE as well</p>

    <p>R² = [SSE(mean)/n - SSE(line of best fit)/n] / SSE(mean)/n, and by consolidating all the divisions, we have</p>

    <p>R² = [SSE(mean) - SSE(line of best fit)/SSE(mean)] x (n/n) =</p>

    <p>R² = SSE(mean) - SSE(line of best fit)/SSE(mean)</p>
  </li>
  <li>
    <p>Those with a background in statistics might wonder if R² is related to Pearson’s correlation coefficient (r). yes, it is.</p>

    <p>The Pearson correlation coefficient measures the strength and direction of the linear relationship between two variables. It ranges from -1 to 1, where -1 indicates a perfect negative linear relationship, 0 shows no linear association, and 1 indicates a perfect positive linear relationship.</p>

    <p>On the other hand, the R-squared ranges from 0 to 1. R-squared is related to the Pearson correlation coefficient because R-squared is the square of the Pearson correlation coefficient (i.e., R² = r²). Therefore, the Pearson correlation coefficient r can be used to calculate R² and vice versa.</p>
  </li>
</ul>

<p>It is good that we have all these measurements on how the fitted line matches our data and help us make predictions. But how confident are we in these analyses? How do we know that the fitted line’s slope is the best we can get? Well, the P-value is here to help out answer those questions.</p>

<h3>P-value</h3>

<p>So what is a p-value? The simplest definition is the measurement of confidence in the results from a statistical analysis. In other words, it tells us the probability that a particular outcome could have occurred by chance or not</p>

<p>Let’s illustrate this with an example: we have countries A and B. We want to know if the population in country A is taller than in country B. We want to know if there is a significant height difference between the two countries. In other words, if the difference between country A’s and country B’s height is not due to random chance.</p>

<p>So we collect the data on the heights of the people in each country, then we find out that in country A, 67% of people are 160cm+ versus 59% in country B are 160cm+. Well, you might conclude that people in country A are taller; there is no doubt about that. Think again; when we are sampling these people, we are not measuring every individual in the country; we make a “sample inference,” which refers to making conclusions about a population based on information collected from a sample, not every individual. So we might have collected maybe the only tallest people in the country for country A and ignored the rest? We might have also sampled the average height people for country B? who knows? We can’t just deduct any concrete conclusion from it.</p>

<p>Note:
The more data we collect, the better, but this is not always possible as it can be time and cost-consuming. That is why we take a sample that best represents the whole population.</p>

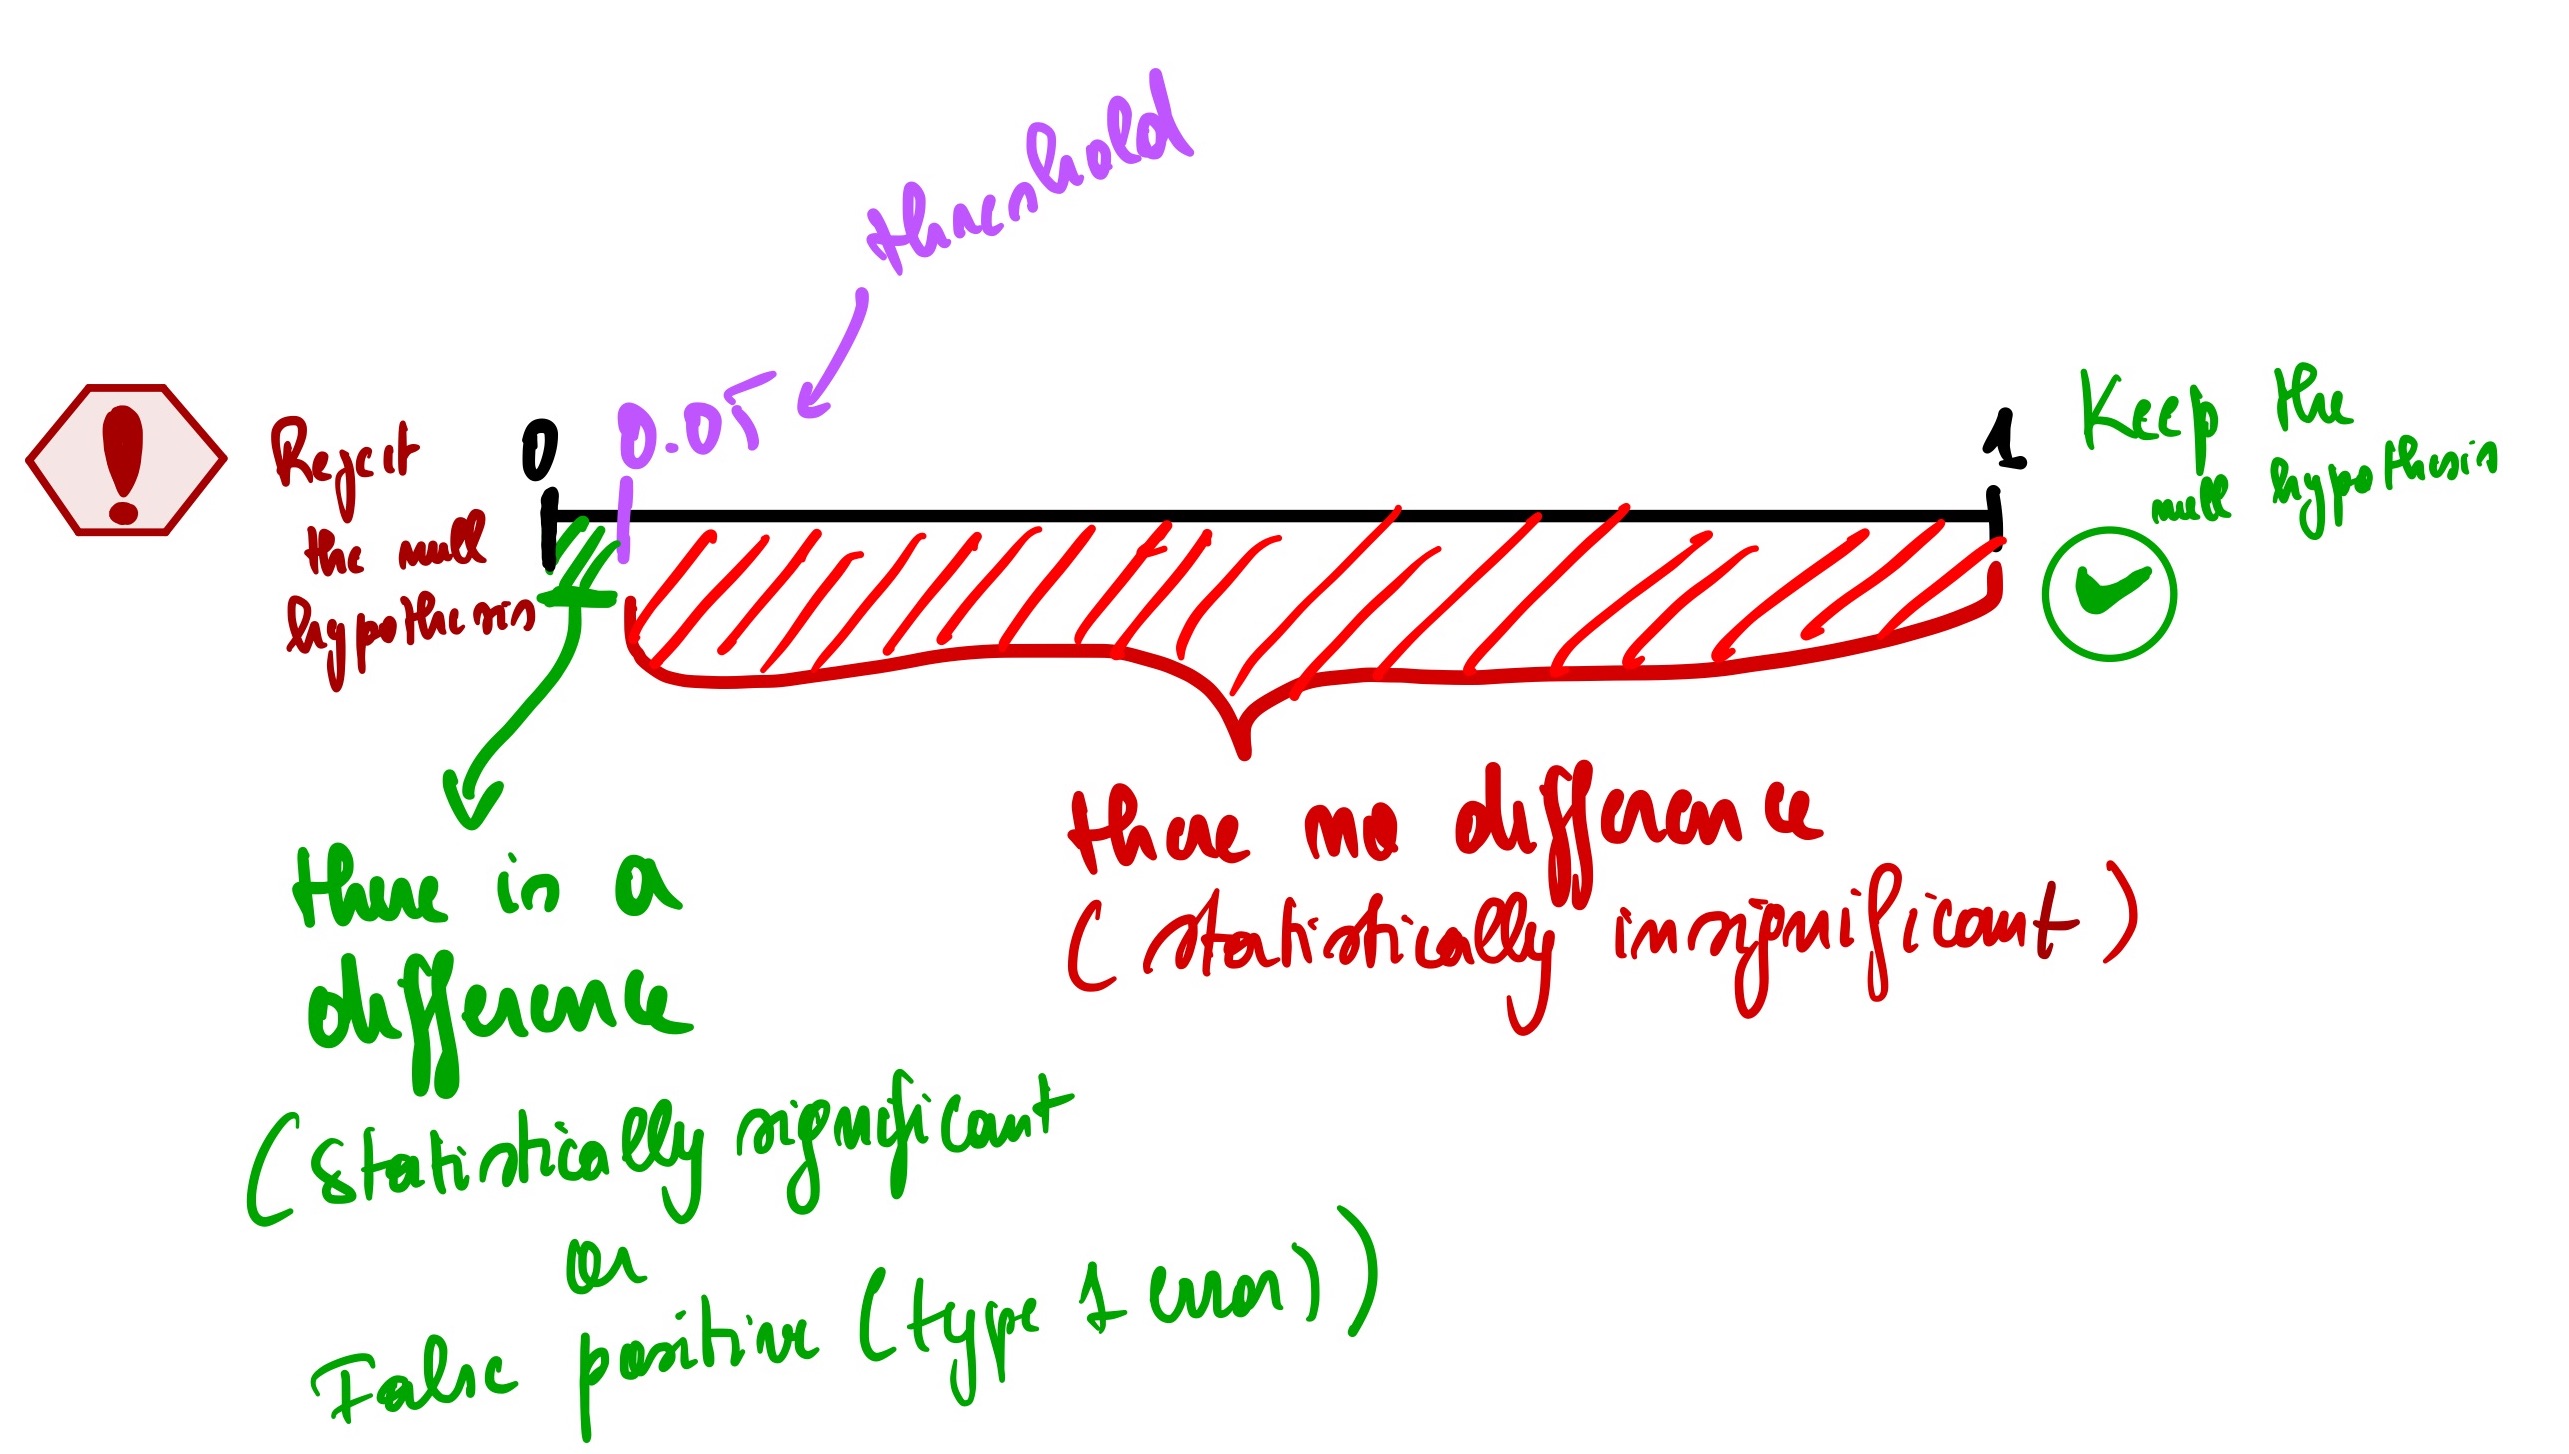
<p>So the p-value helps us to overcome this doubt; p-values range from 0 to 1. The closer the p-value is to 0, the more confident that there is a statistically significant difference between country A and country B population’s heights, meaning the difference is unlikely to be due to chance alone. It is a false positive (Type 1 error).</p>

<p>Now a question arises: how small does this p-value need to be to conclude that there is a statistical difference between country A and country B? in other words, what is the threshold to use? Well, there is a conventional threshold commonly used among statisticians, and it is 0.05. Using our example, if there is no difference between the heights of people in country A vs. B and they had to do the same analysis repeatedly, only 5% of those analyses would result in a bad outcome.</p>

<p>After doing some calculations of the P-value(usually done using a tool like Excel or Python), we found out that the P-value is 0.71, which is greater than 0.05. It means that even though we have a more significant percentage of taller people for country A, it does not necessarily mean that there is a statistically significant difference between people’s height in the two countries.</p>

<p>Note:
The threshold of 0.05 is not an absolute threshold; it can vary depending on how confident we want to be with our analysis. For example, if we conduct a study involving human health in the medical field, it is best to use a 0.01 threshold to ensure that we minimize false positives as much as possible. On the other side of the spectrum, we are analyzing which communities in the city are consuming more chocolate then a threshold of 0.2 can do just fine.</p>

<p>Another thing to remember is that the p-value does not tell us how different they are. It only just tells us if there is a difference or not. For example, a p-value of 0.71 (71%) is not much different than a p-value of 0.23 (23%) percentage-wise. It tells us that those two p-values are statistically insignificant when the threshold is 0.05.</p>

<p>Finally, we can’t discuss the p-value without mentioning the null hypothesis. A null hypothesis is a statement that assumes there is no significant relationship at the beginning of an analysis (it is like a “default” position that you start with), meaning that we start the study with the assumption that the P-value &lt; 0.05. After calculating the P-value, we then keep the null hypothesis (when we find no difference) or reject the null hypothesis (when we discover that there is indeed a difference).</p>

<p>Let’s summarize everything discussed in the p-value with this simple illustration below.</p>

<p><img src="/blog/assets/post_cont_image/pvalue.jpg" alt="p-value" /></p>

<h3>How does gradient descent relates to linear regression?</h3>

<p>Going back to our previous example of the unemployment rate and consumer spending</p>

<p><img src="/blog/assets/post_cont_image/city_unmplym_cons_spend.jpg" alt="city_unmplym_cons_spend" /></p>

<p>Now that we know that R² and P-value mean, we have R² = 0.76 and a P-value = 0.14</p>

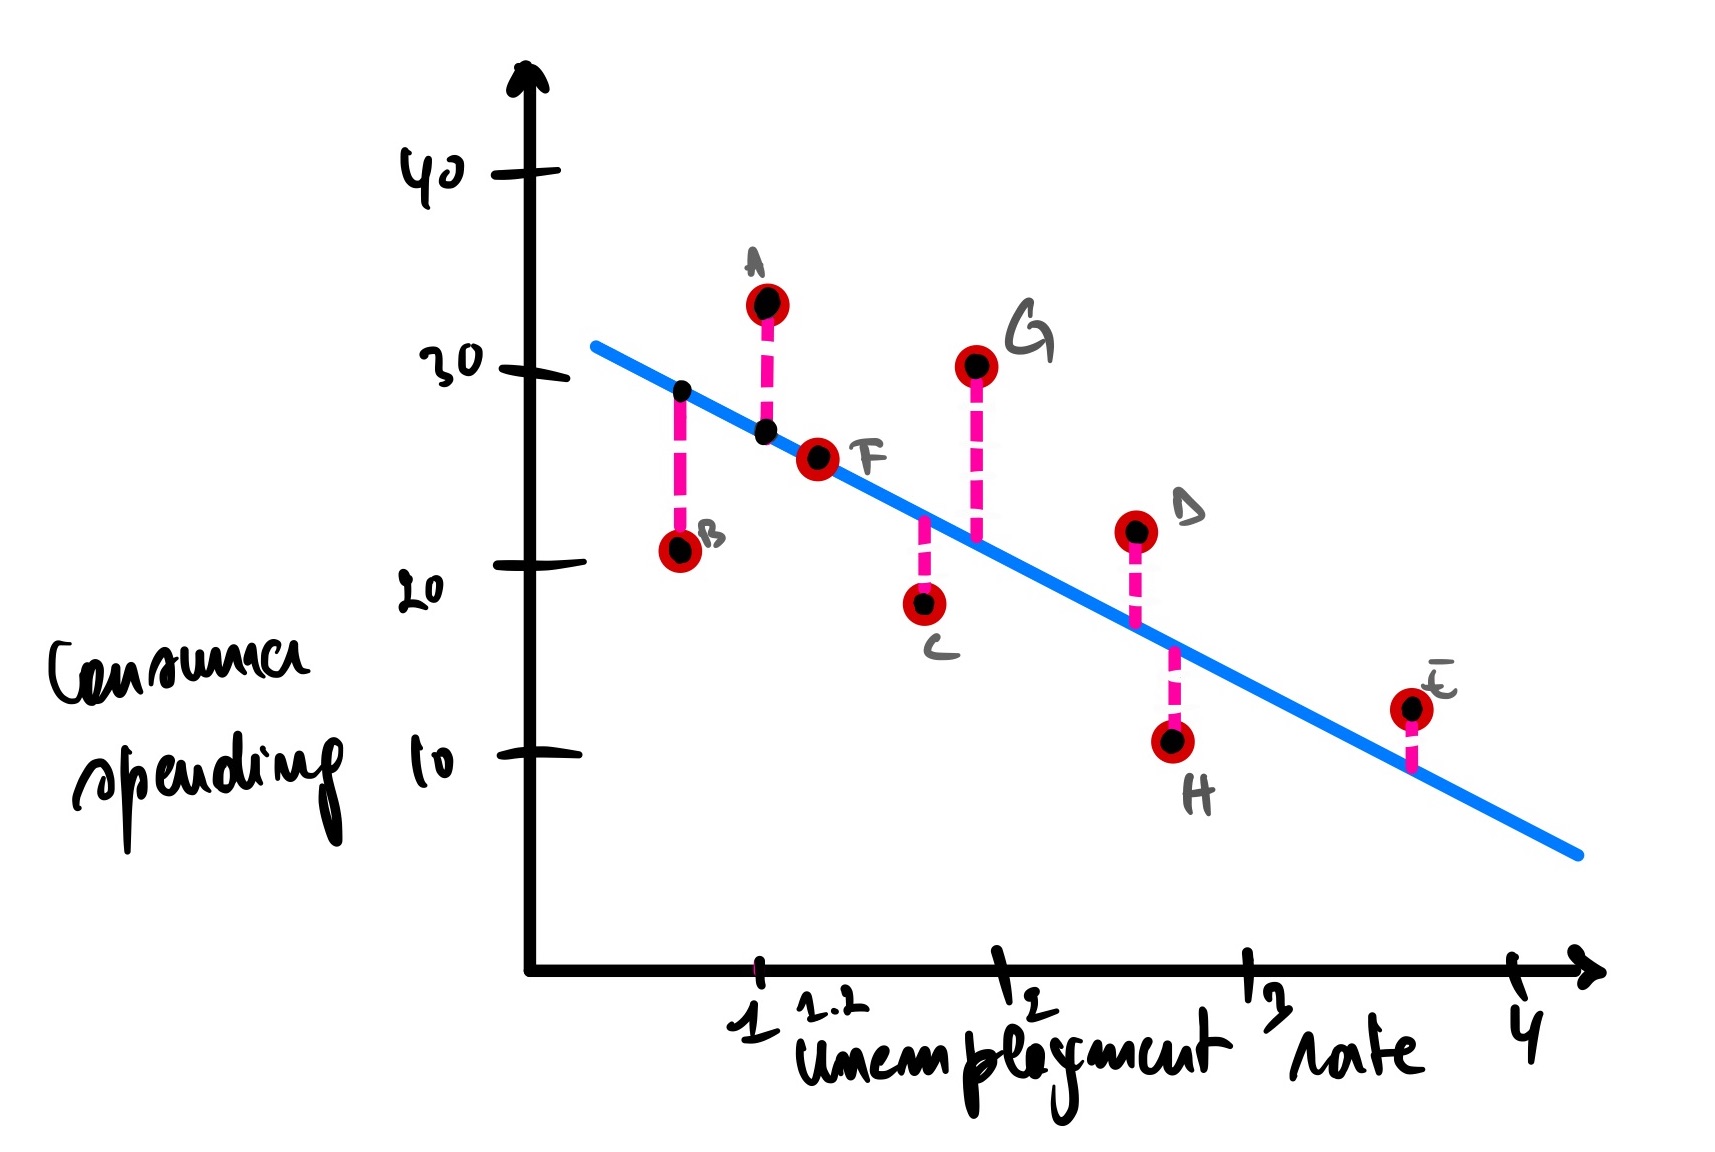
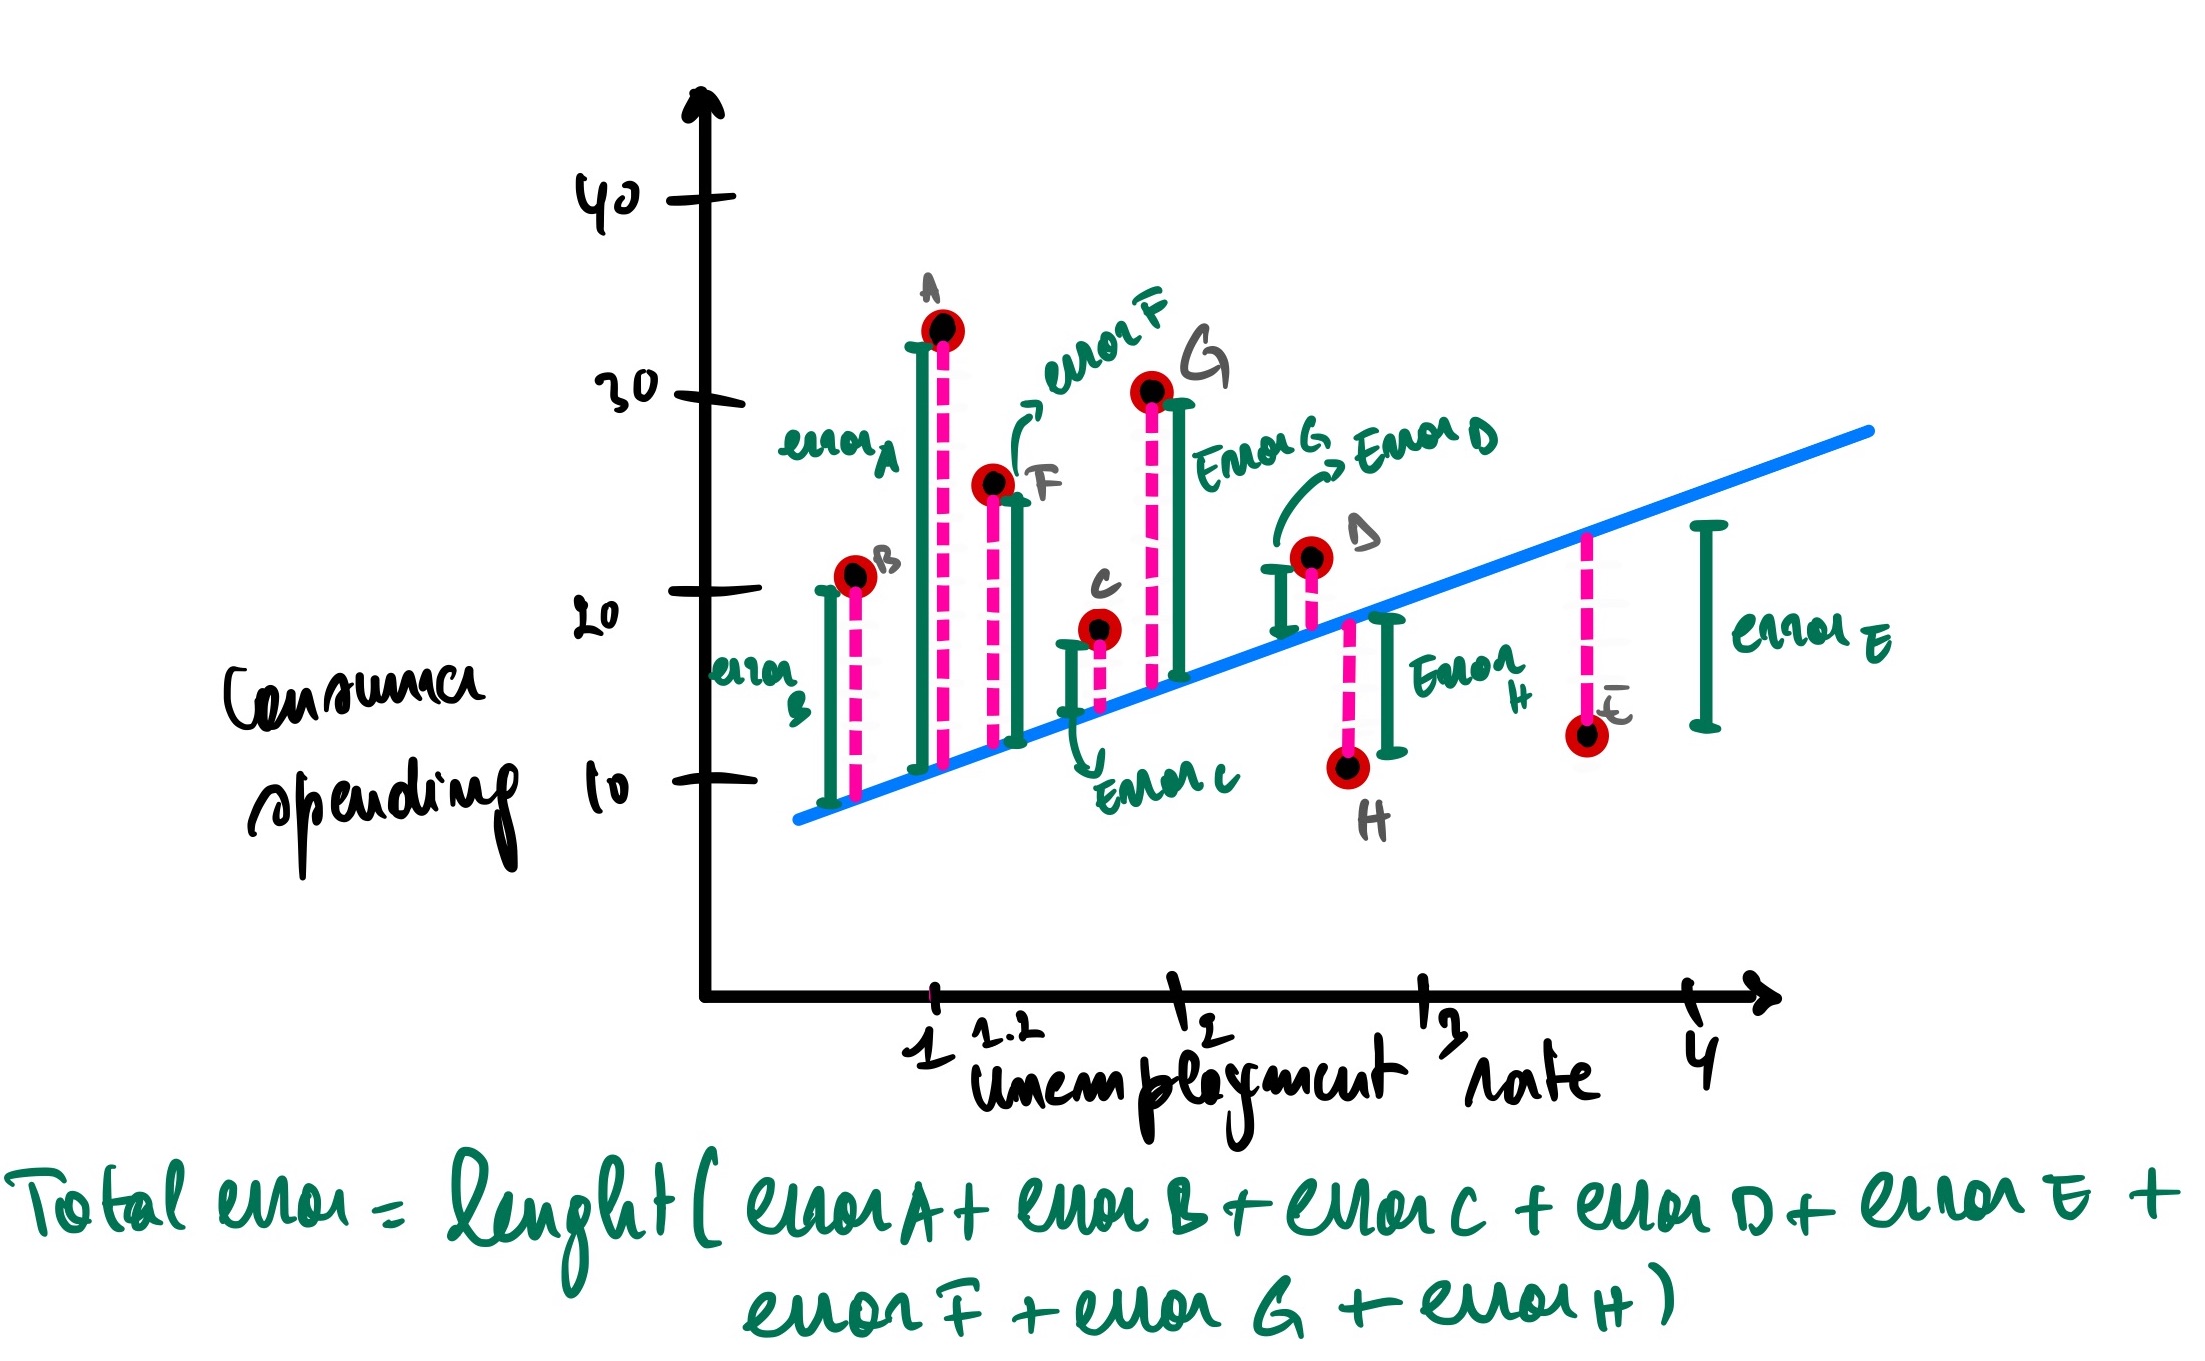
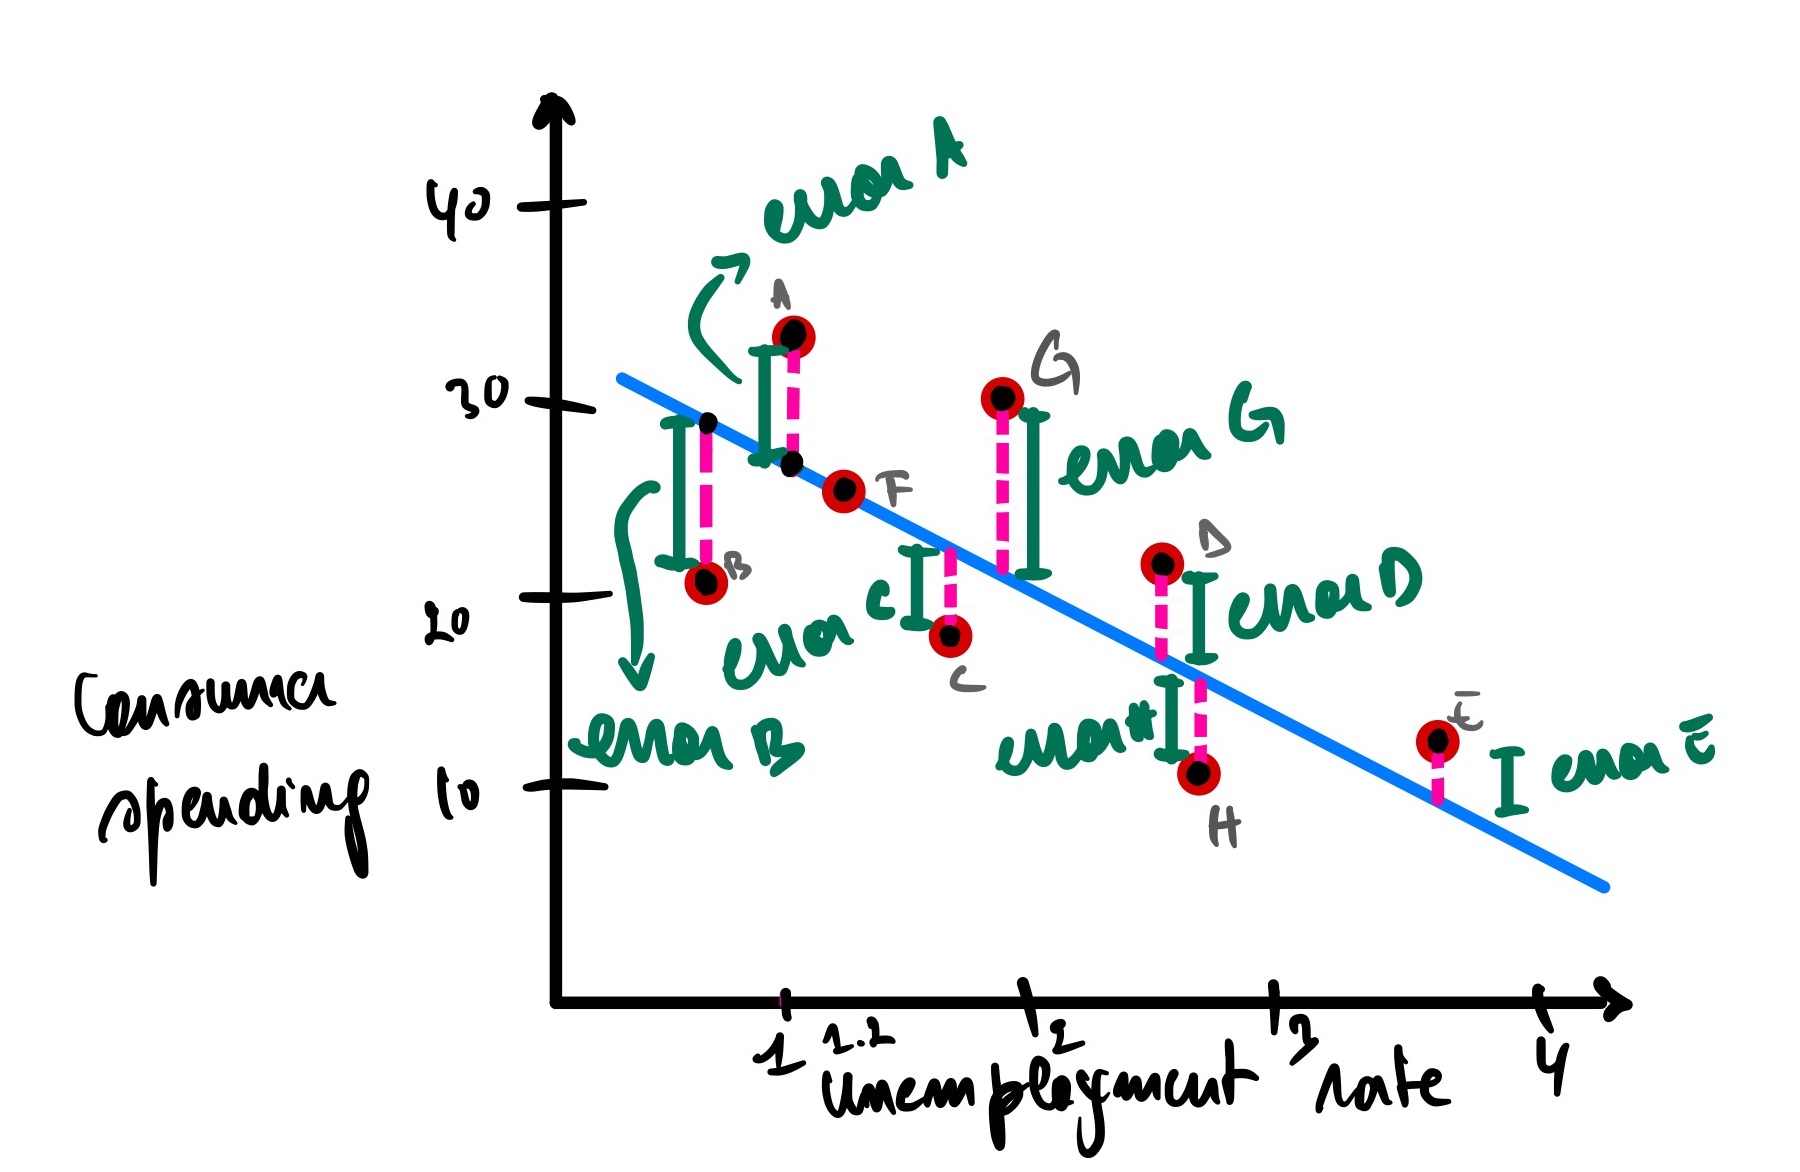
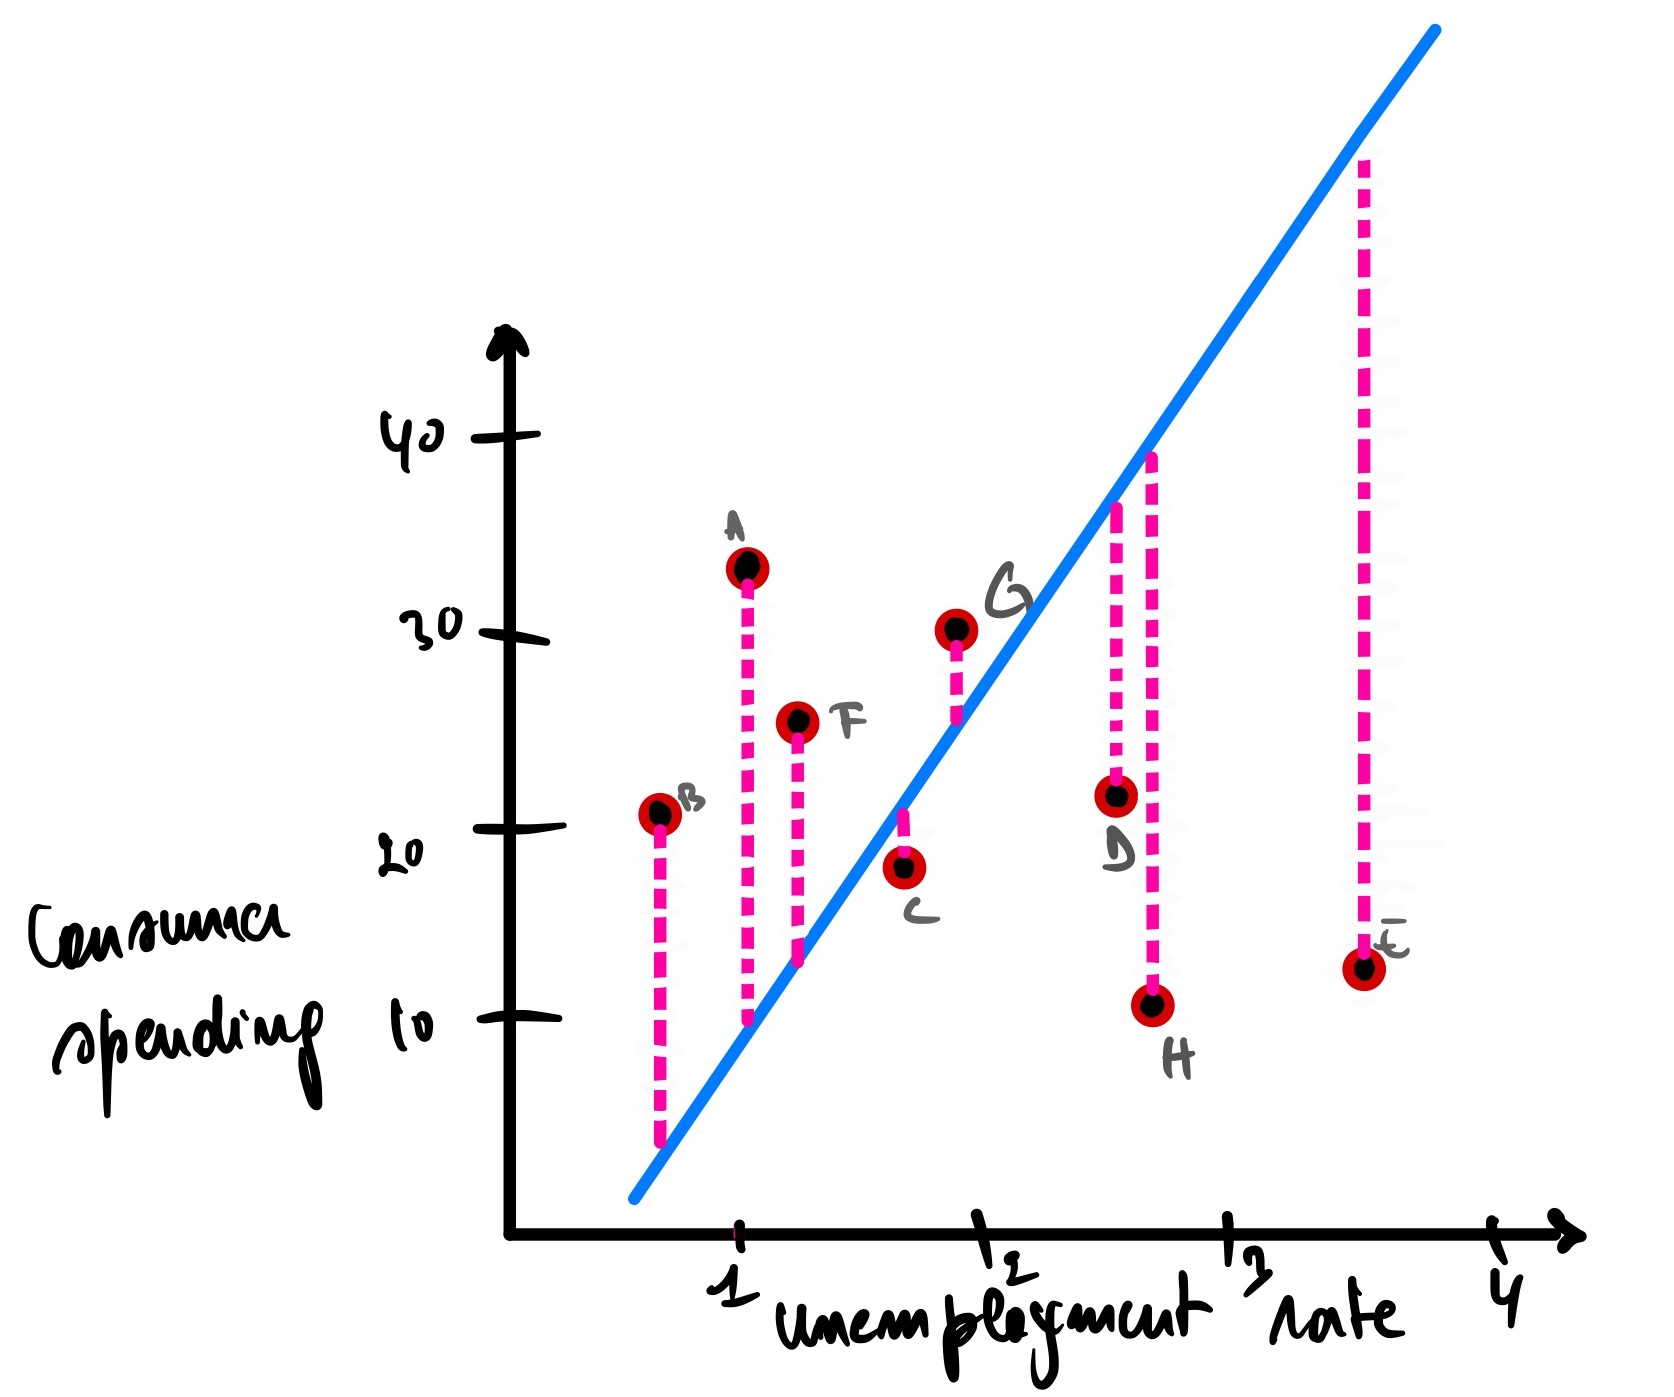
<p>Would this model make good predictions for unseen cities? Of course not. But how can we quantify that this model is worst than the previous one? We can look at the total errors by adding the length of the pink lines, which is the summation of the distance between the observed and predicted data points.</p>

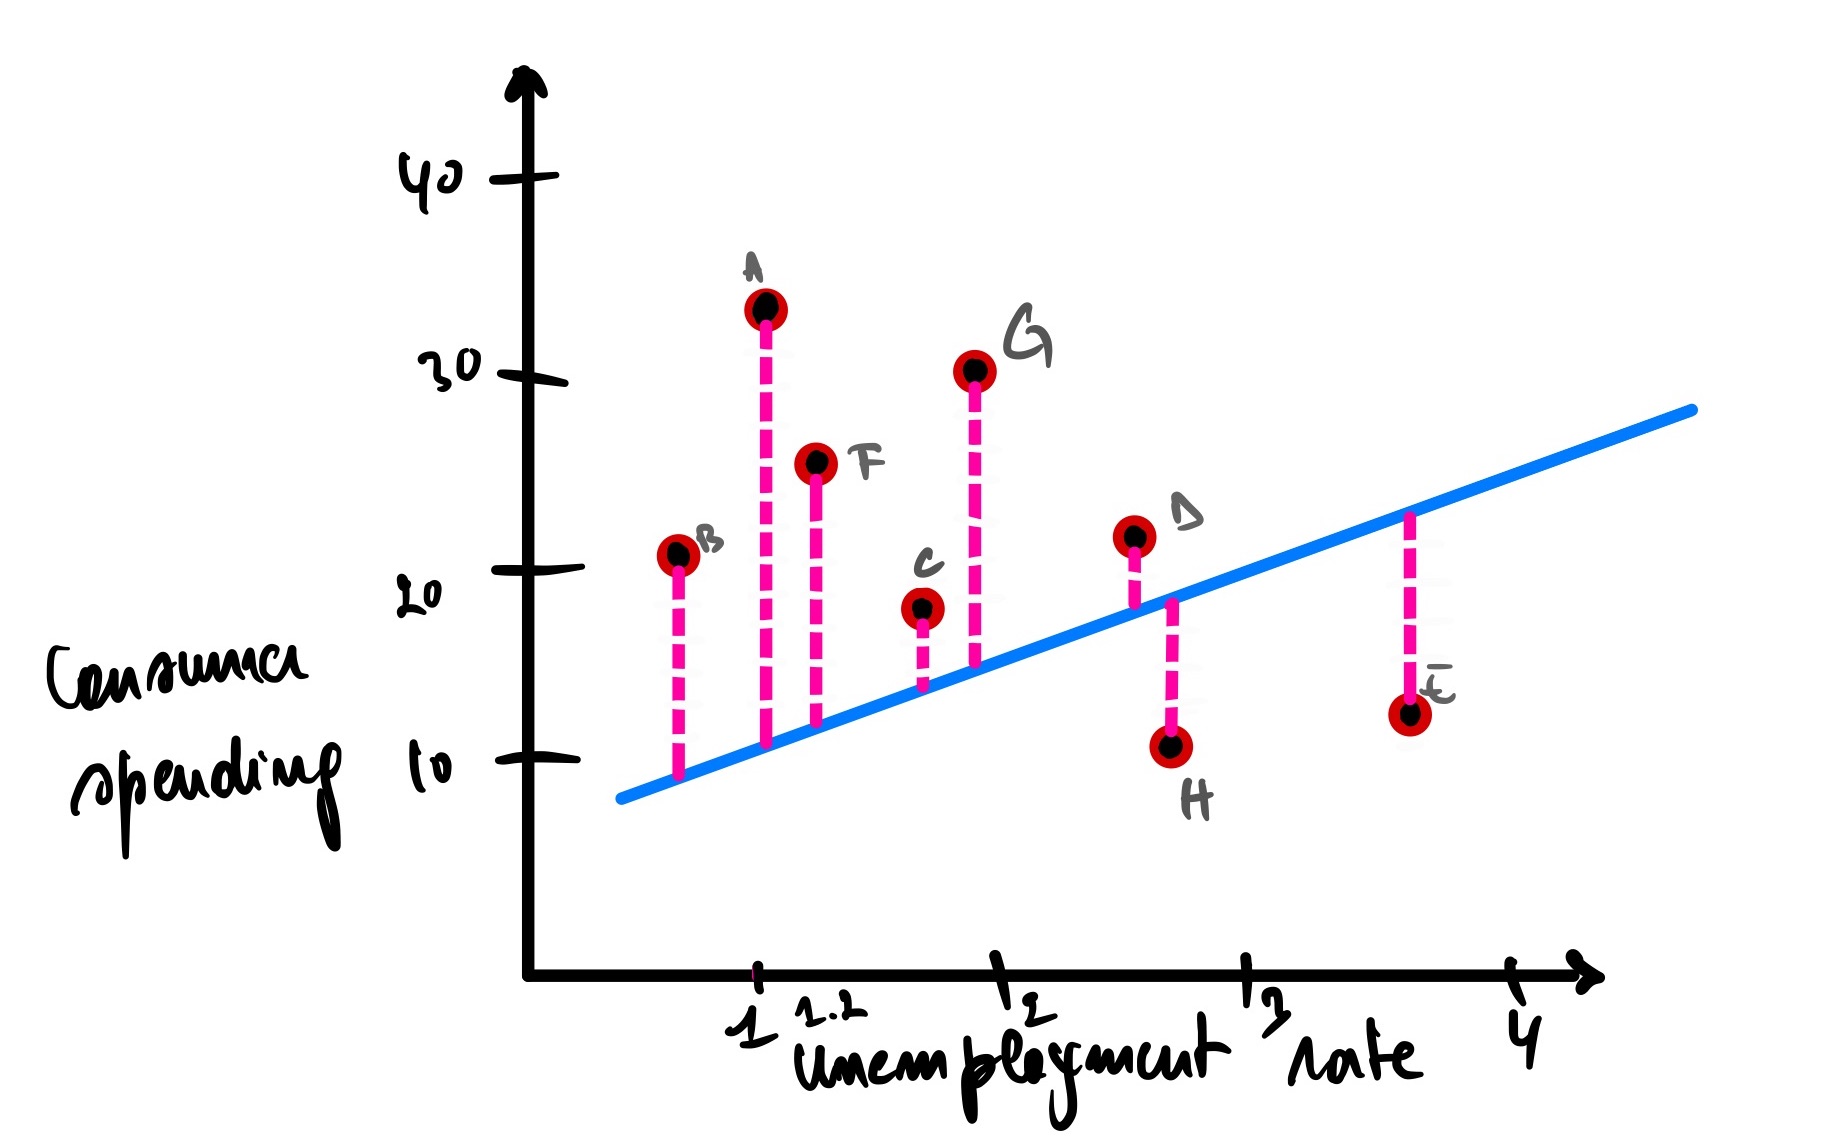
<p>Let’s imagine for a second that we have a new line that fits the data this way.</p>

<p><img src="/blog/assets/post_cont_image/worst_model.jpg" alt="worst_model" /></p>

<p><img src="/blog/assets/post_cont_image/worst_model_error.jpg" alt="worst_model_error" /></p>

<p>We can see that the total errors (SSE) of the second model that fits our data is greater than the first model, meaning that this second model does not fit our data well compared to our first model. In other words, the second model won’t make a better prediction than the first one.</p>

<p><img src="/blog/assets/post_cont_image/best_model_error.jpg" alt="best_model_error" /></p>

<p>Now, how about this one?</p>

<p><img src="/blog/assets/post_cont_image/better_model.jpg" alt="better_model" /></p>

<p>This one is better than the second model but worse than the first model, meaning that its SSE is less than the second model’s SSE but greater than the first model’s SSE.</p>

<p>Now, how about this one?</p>

<p><img src="/blog/assets/post_cont_image/the_worst.jpg" alt="the_worst" /></p>

<p>Okay, this one, we can all agree that it is the worst of the bunch.</p>

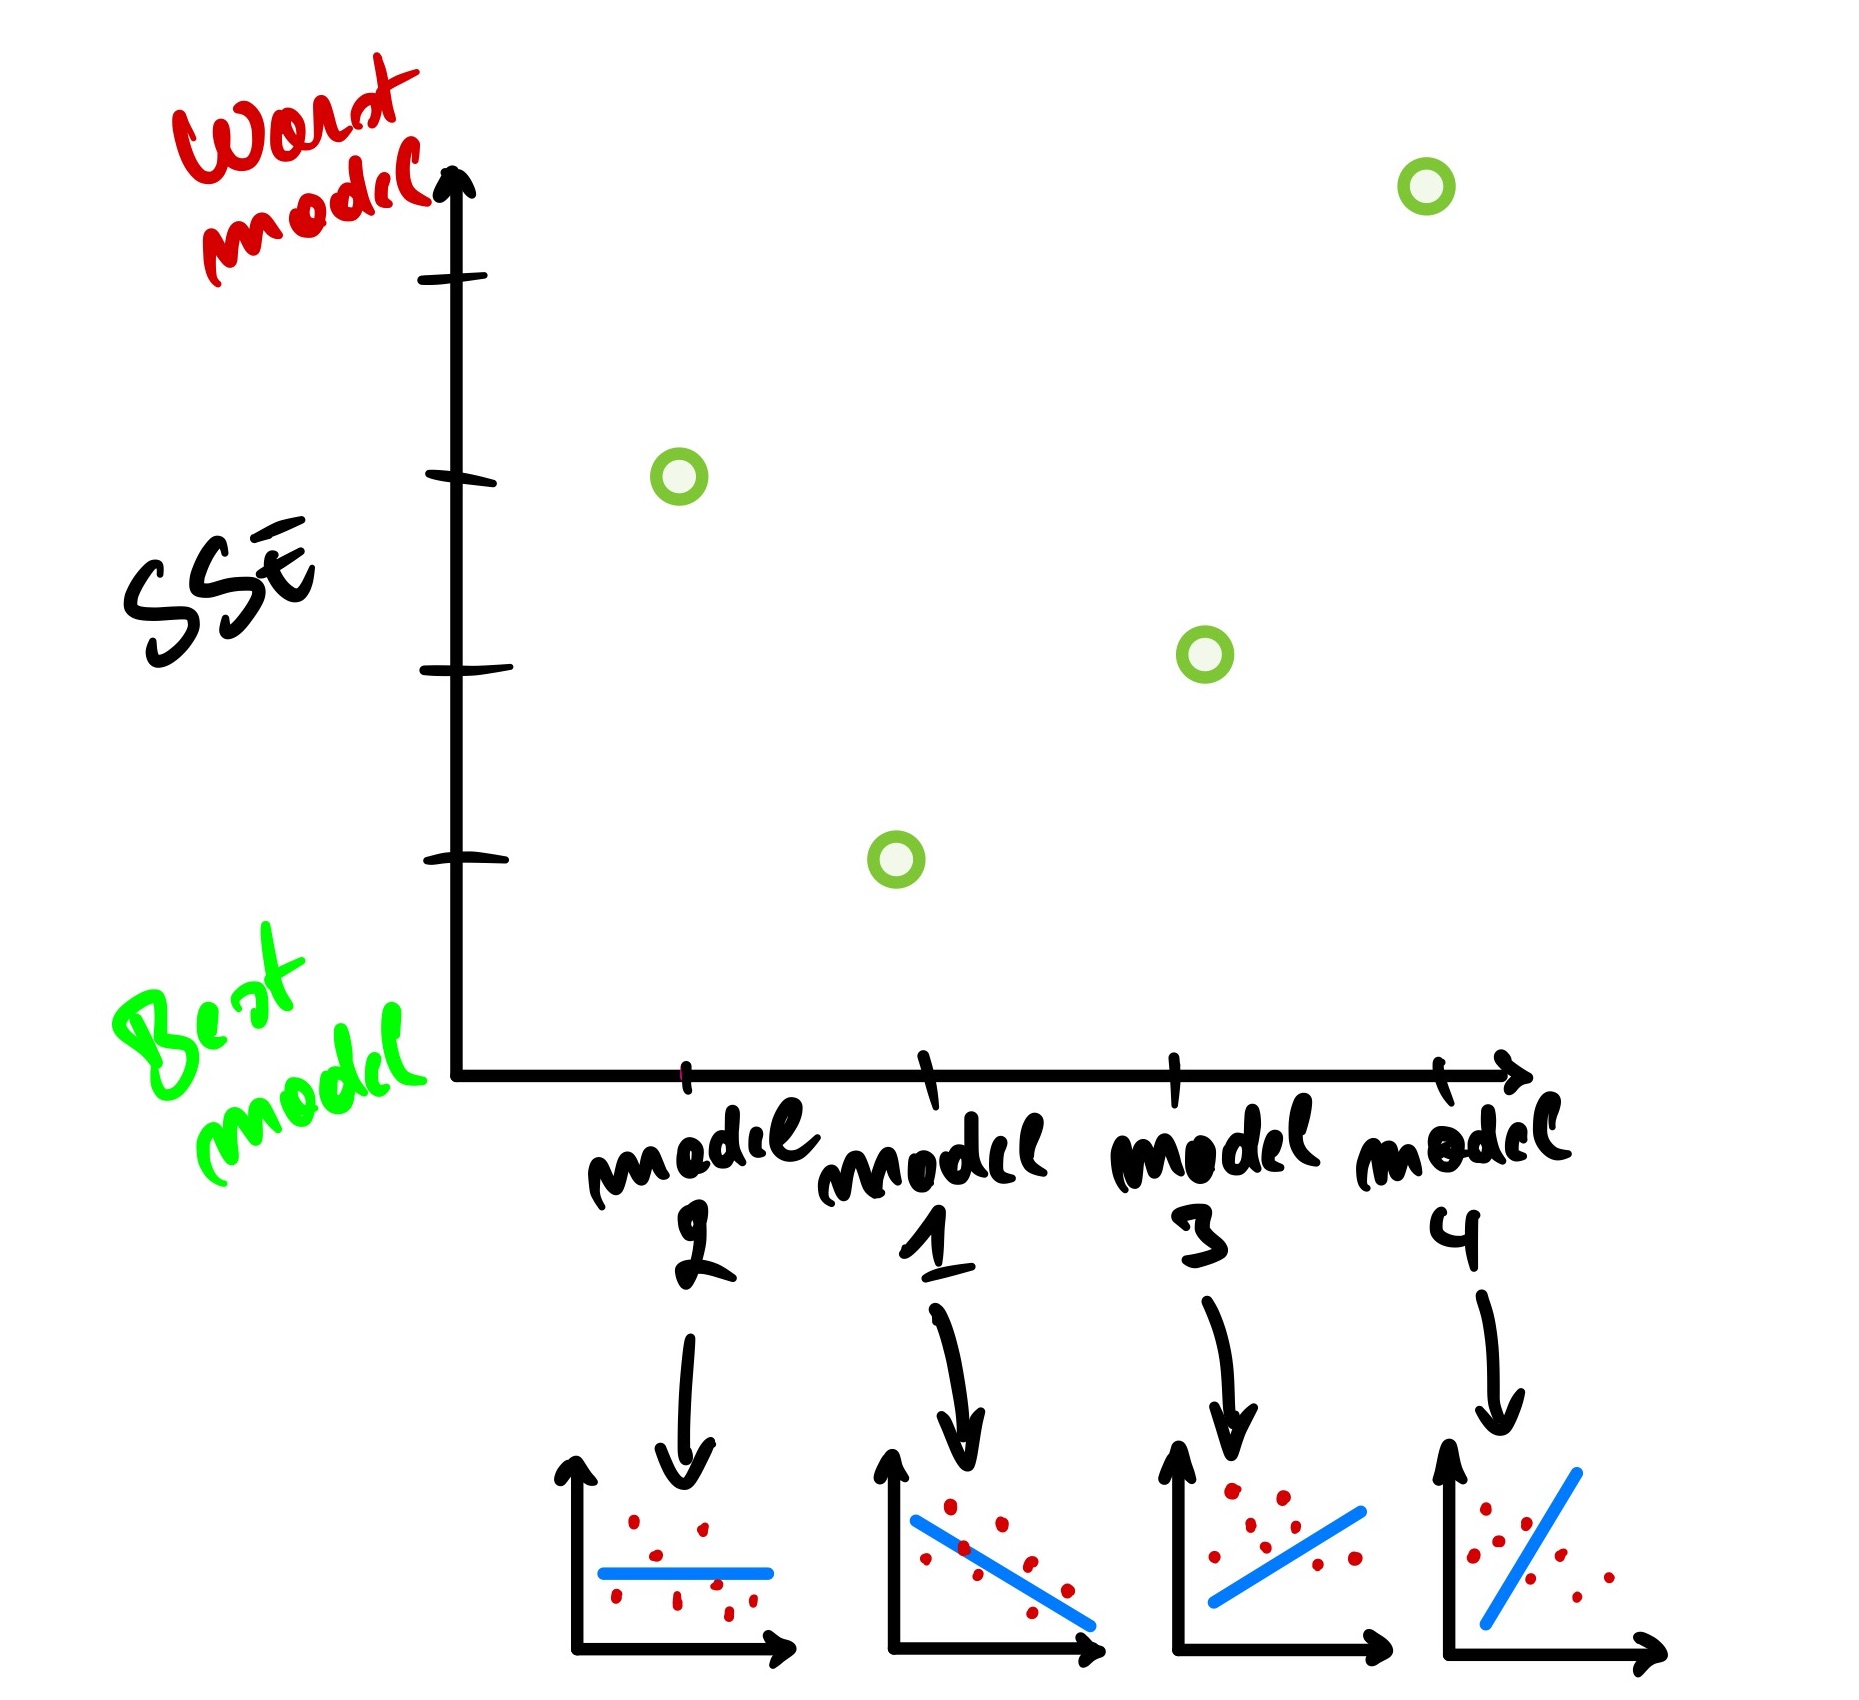
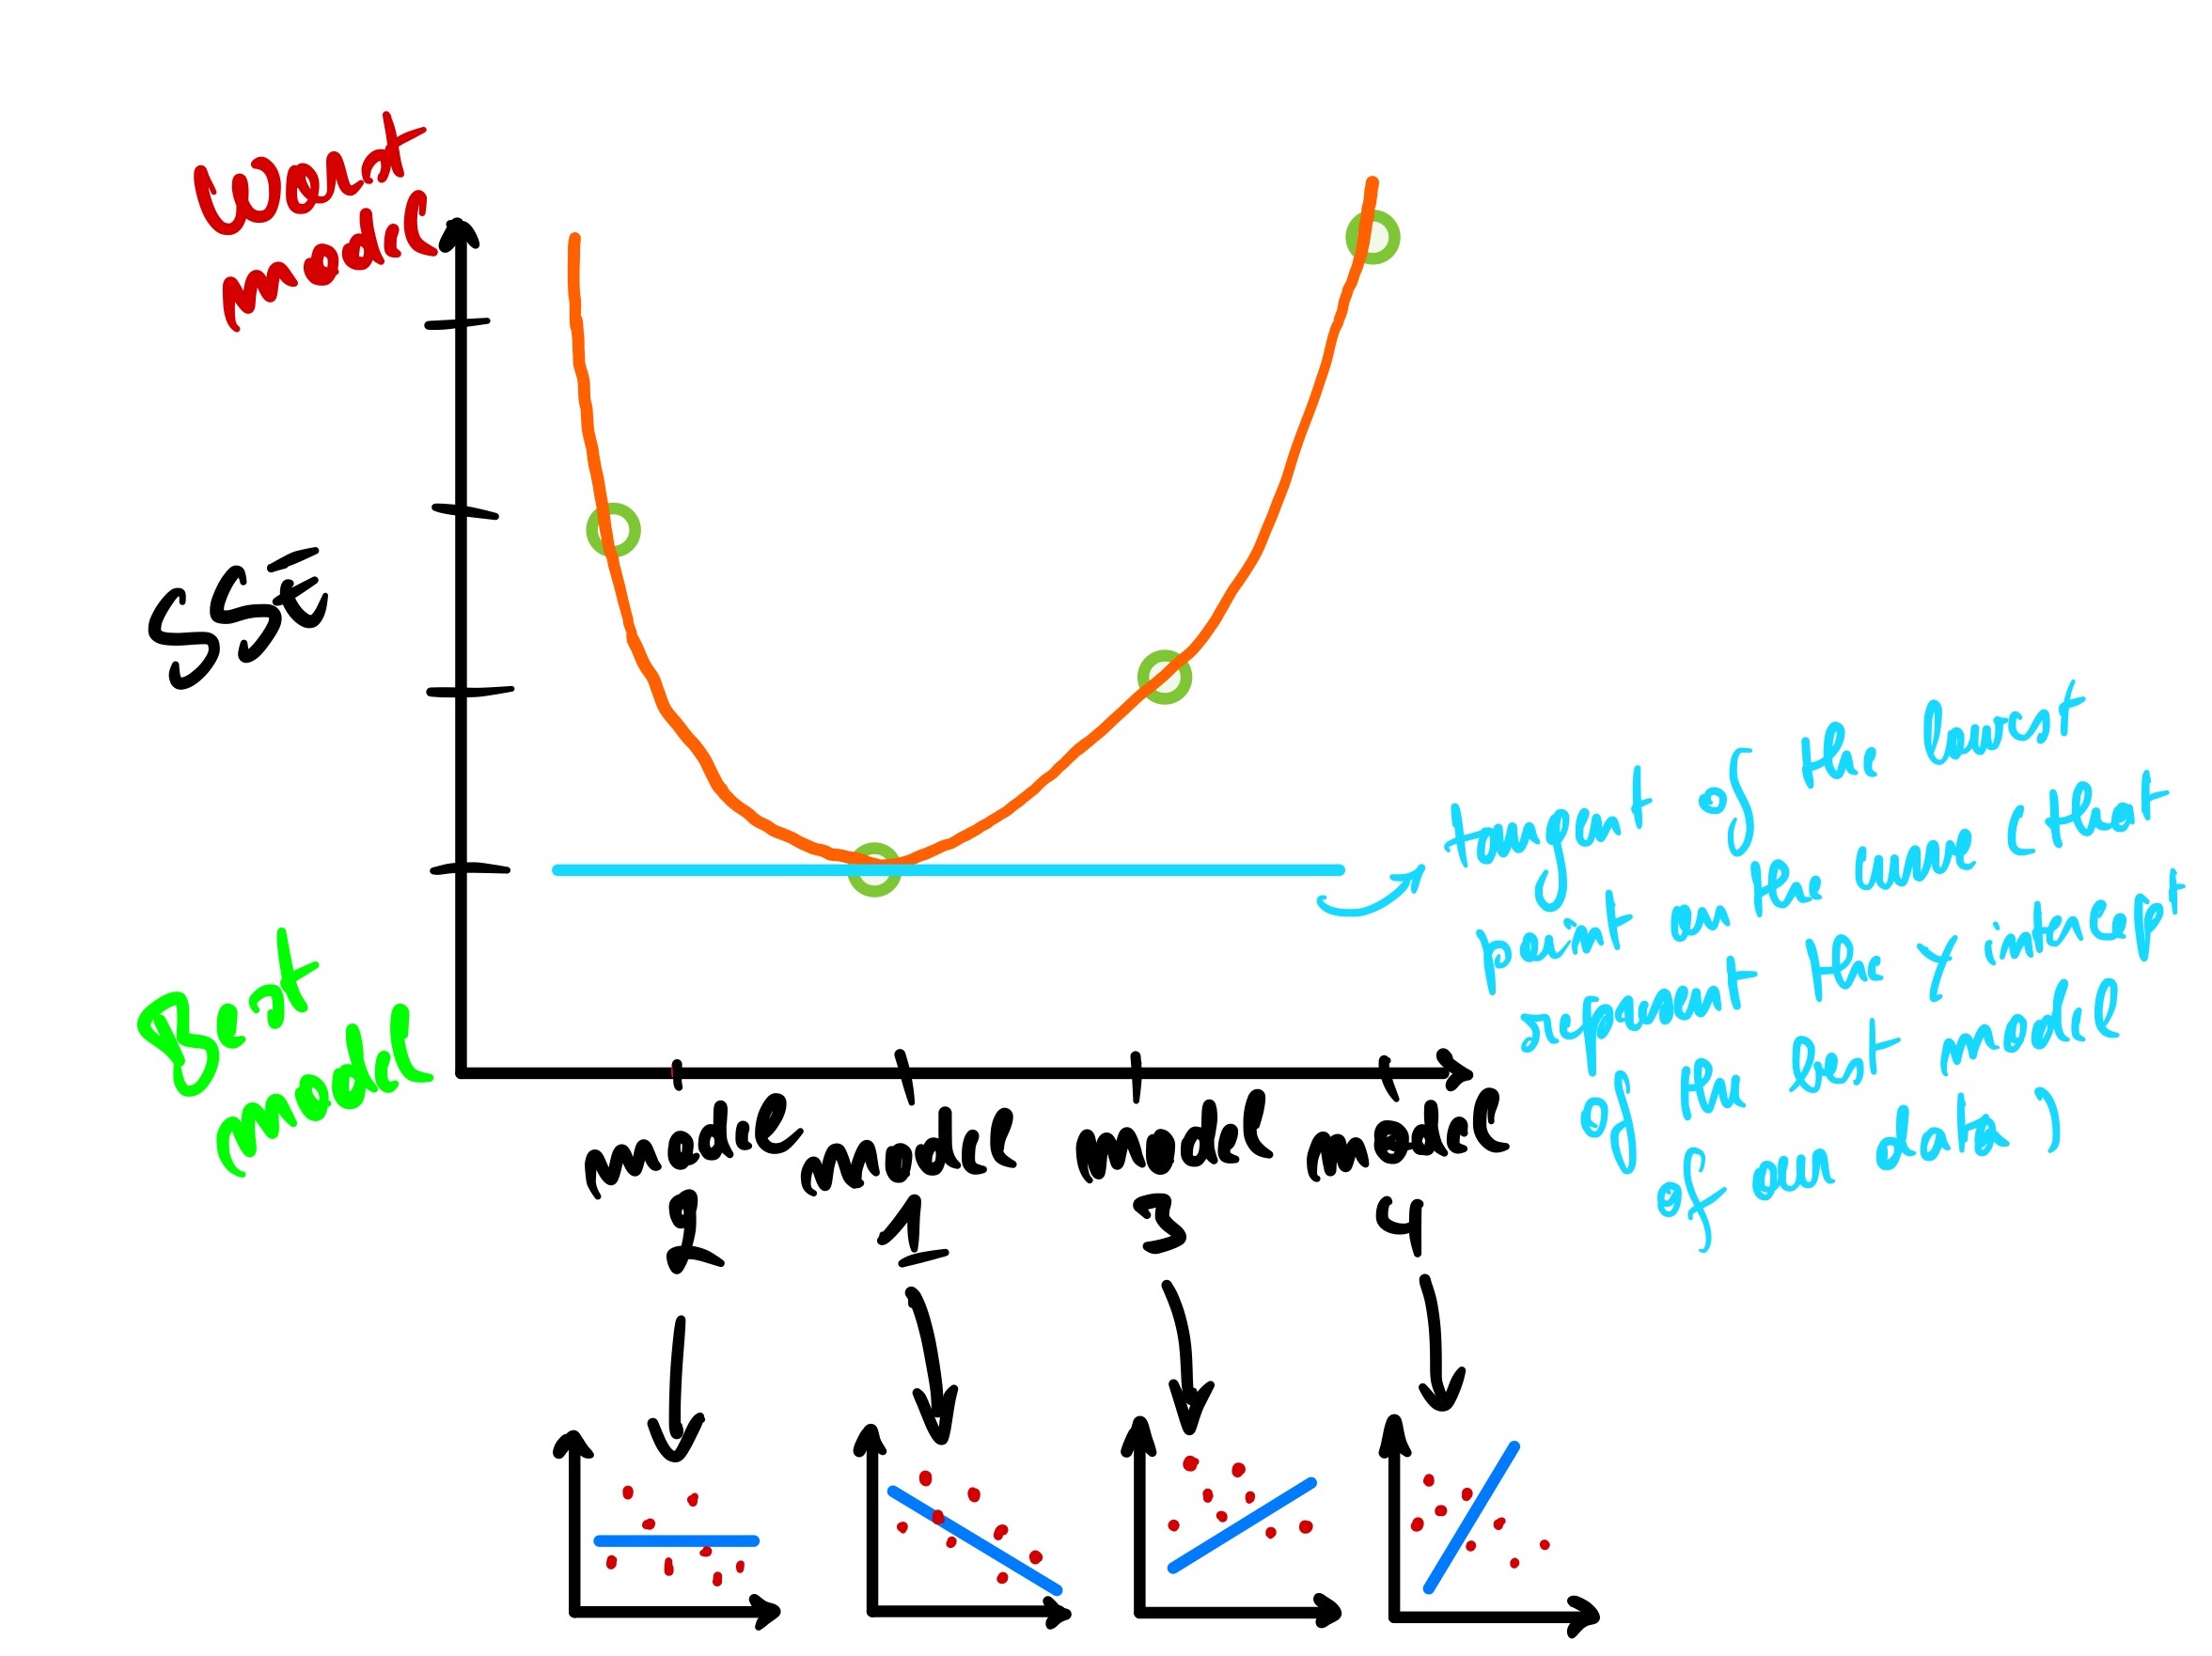
<p>Using this information, we can plot the SSE on the Y-axis of a graph and visualize how the lines perform one again another.</p>

<p><img src="/blog/assets/post_cont_image/sse_plot.jpg" alt="sse_plot" /></p>

<p>We can see that model 1 has the smallest SSE while model 4 has the largest SSE.</p>

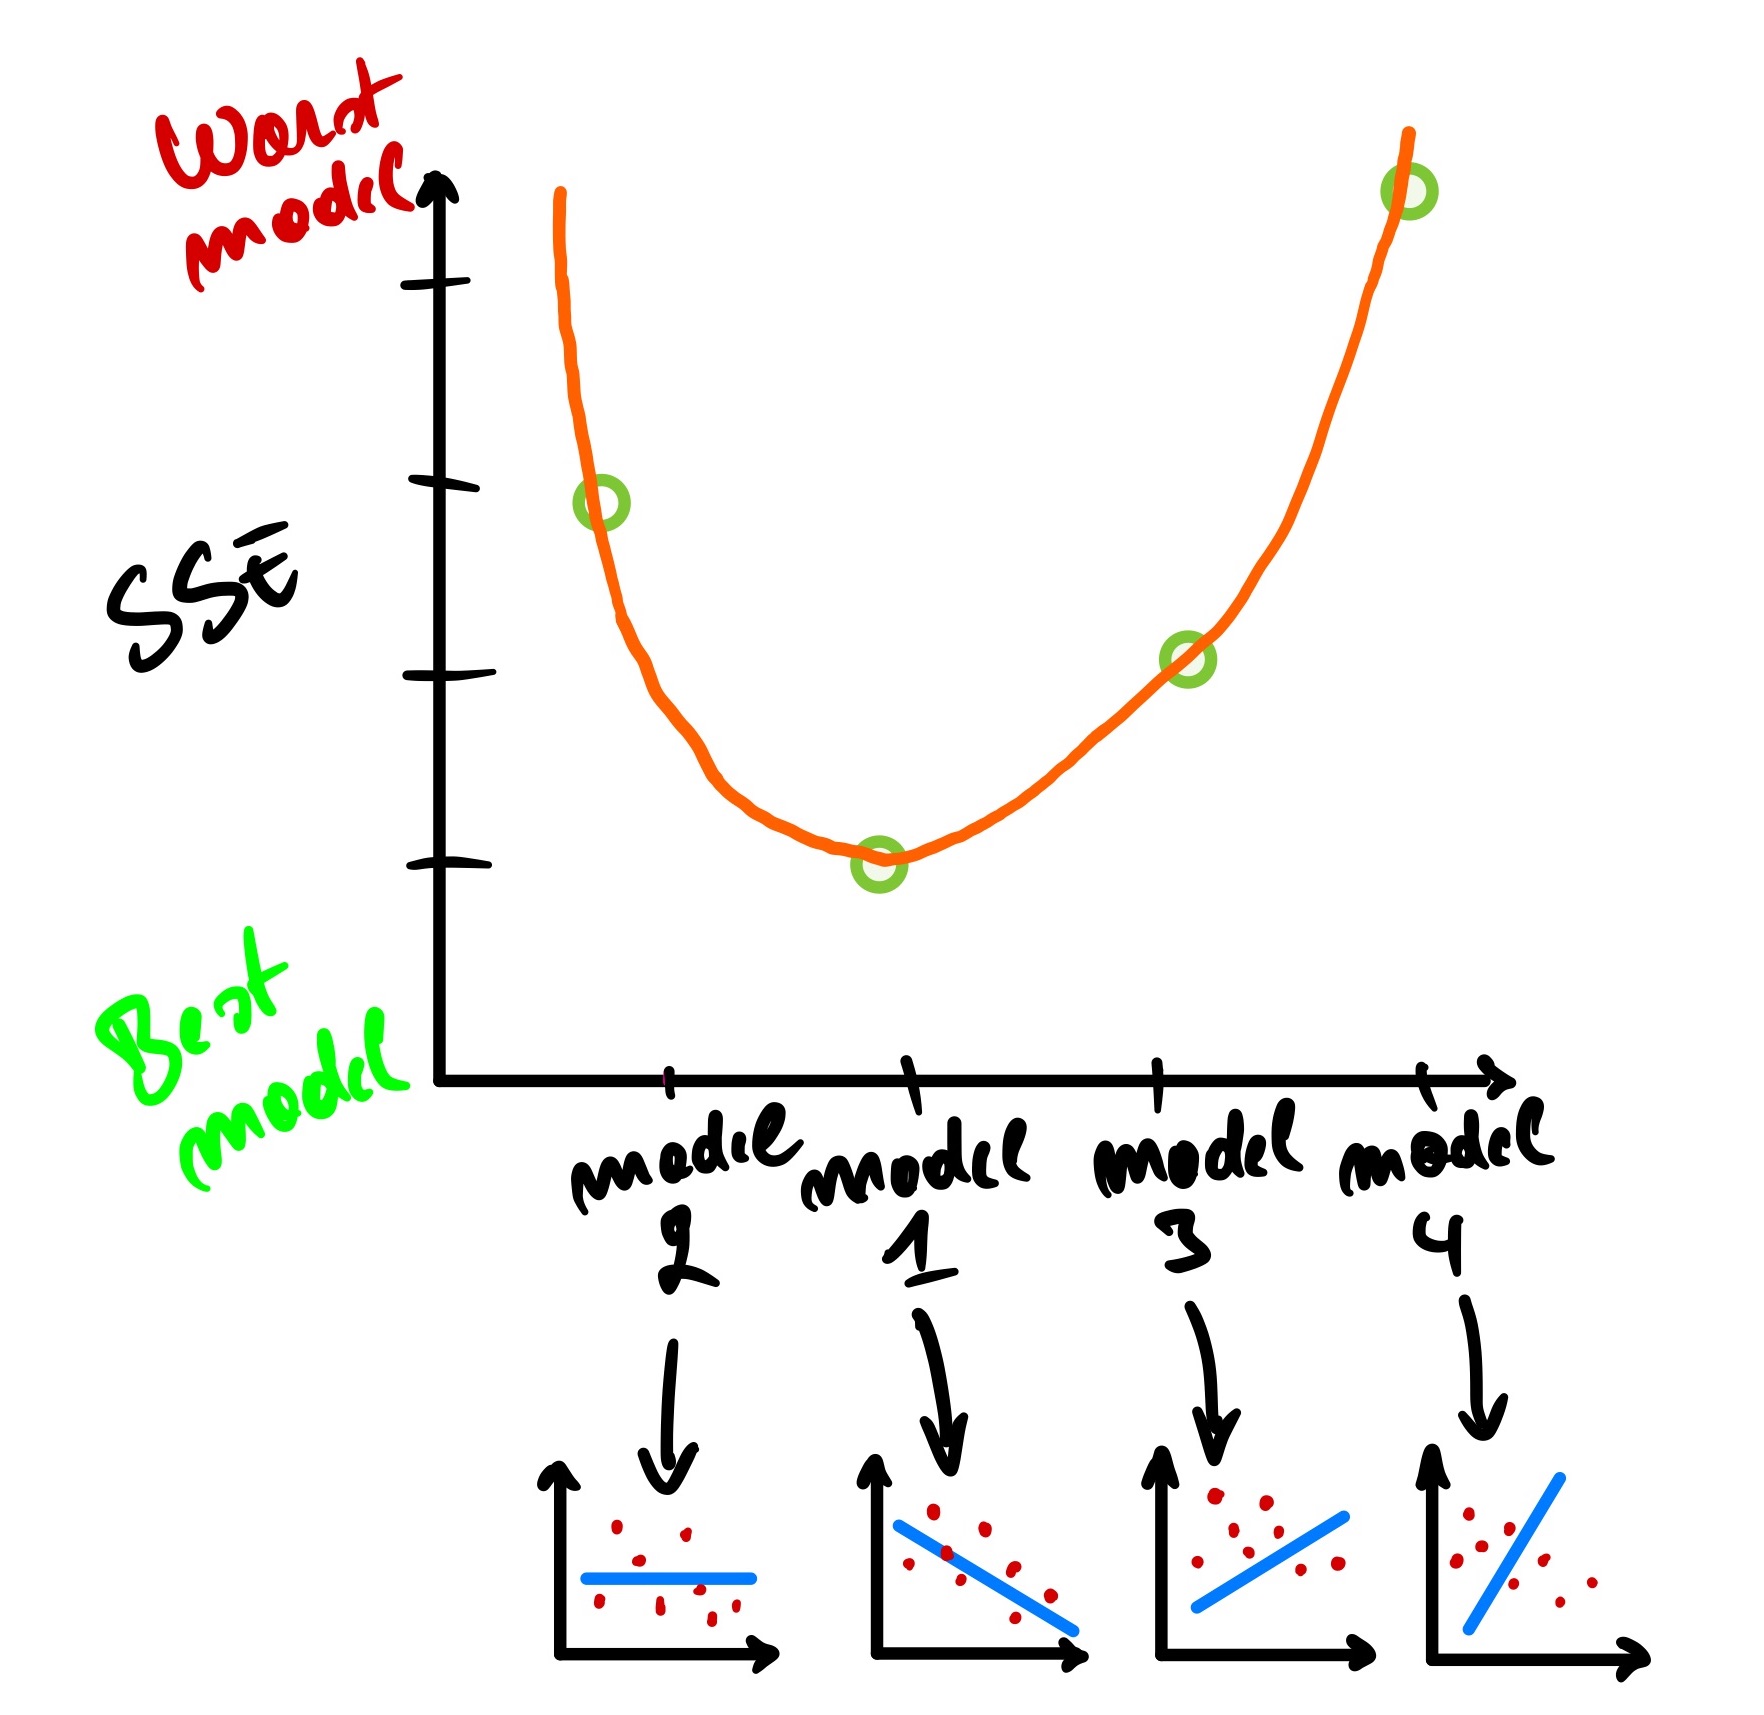
<p>We could plot as the Y-axis intercept of those models, and from there, we can have a curve-like plot.</p>

<p><img src="/blog/assets/post_cont_image/sse_curve.jpg" alt="sse_curve" /></p>

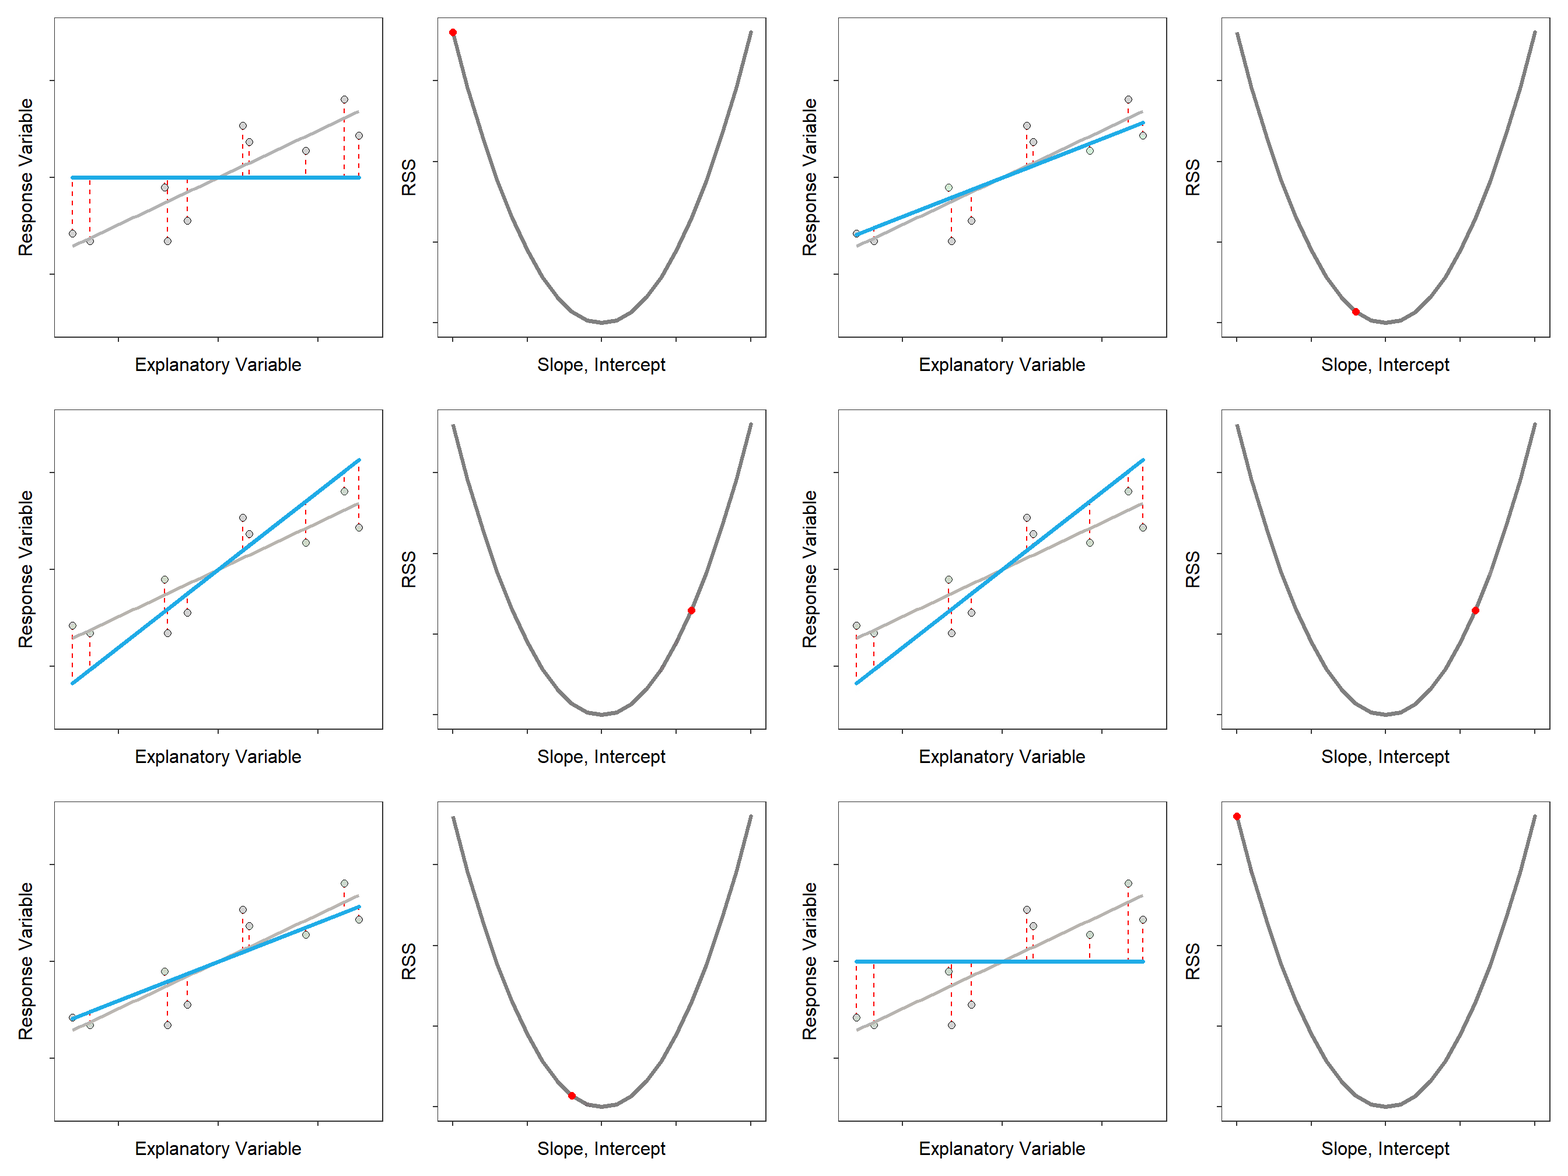
<p>We can have it animated for a better understanding.</p>

<p><img src="/blog/assets/post_cont_image/sse_anim.gif" alt="sse_animated" /></p>

<p>gif credit: <a href="https://derekogle.com/Book207/SLRFoundations.html">https://derekogle.com/</a></p>

<p>So to find the best model, we need to get to the lowest point on that curve, representing the y-axis intercept of the best model that fits our data. And how do we get that lowest point? Using the derivative of the curve where the derivative is equal to 0; means that the tangent line on that point is horizontal.</p>

<p><img src="/blog/assets/post_cont_image/tangent_curve.jpg" alt="tangent_curve" /></p>

<p>Gradient descent is the iterative method to find the lowest point of the curve where we have the minimum error between the actual and predicted values of a machine learning model. It starts with a guess at any point on the curve and then goes on into a loop that improves from the previous guess until it reaches its lowest point. Gradient descent is used not only for linear regression but also for logistic regression, neural networks, and other machine learning models.</p>

<h3>Multidimension linear regression</h3>

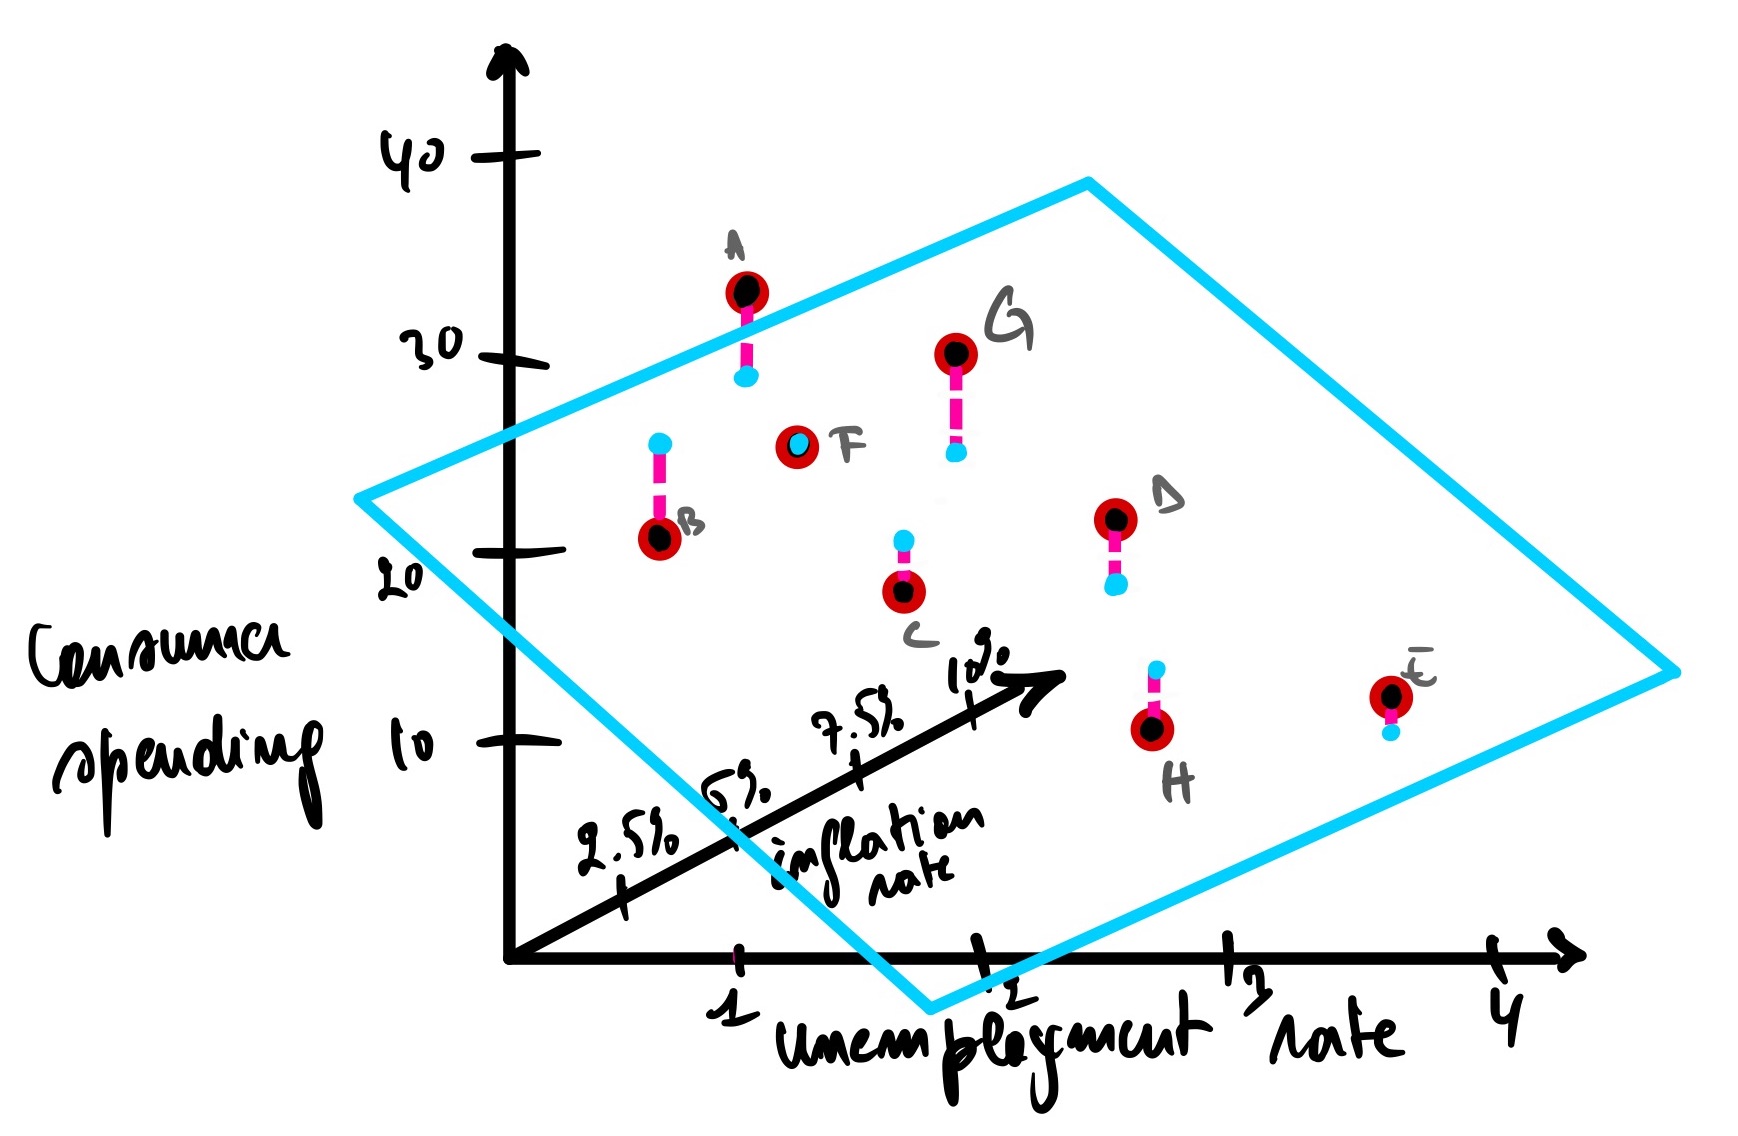
<p>So far, we have seen a linear regression within two variables (two dimension axis). In this case, we only have one independent variable known as input or predictor (unemployment rate) and a dependent variable known as output, response variable, or target (consumer spending). However, this does not mean that it is always this way. We can have multiple input and output variables.</p>

<p>Let’s add another independent variable to the mix, the inflation rate. So now we have two independent variables; as the unemployment rate and inflation rate increase, this should decrease the consumer spending of the people in any given economy. This is called a multidimensional linear regression with 3 axes and a plane instead of a line representing the model.</p>

<p><img src="/blog/assets/post_cont_image/plane_axis.jpg" alt="plane_axis" /></p>

<p>The same concepts apply here; the best model will have a minimum distance between the actual data points and the predicted data points. R², P-value, and gradient descent are all calculated the same.</p>

<p>Note: For instance, when we have more than 3 variables, we won’t be able to represent it on a graph as we just did because we live in a 3-dimensional world, and so far, there is no way to have 4-dimensional representation. But besides this, all the other concepts seen are the same.</p>

<h3>Conclusion</h3>

<p>As we have seen, linear regression is one of the simplest Machine Learning models, yet it is very powerful. Depending on the problem we are trying to solve, this might be what we are looking for, as simplicity is a desirable model feature when we want to understand how a model came up with the result (model interpretability). For example, when a model is used for loan underwriting, we need to understand what independent variables contributed the most to granting or rejecting a loan application. It is also instrumental in the medical field when high stake accountability is involved. Neural networks provide better results but might not be the best because they lack interpretability. That is why it is commonly referred to as a black box model.</p>

<p>In this post, we explored the main topic of Linear regression; we defined what it is, when to use it, how it works, and all its metrics and variation. We have covered almost any theory you need to know about linear regression, and I hope you learned something new as I did when writing this blog. I also discovered the power of ChatGPT in improving my productivity while learning and writing. I will certainly use it for my next blog post, a hands-on version of this post where we will dive into linear regression using the scikit-learn library. Excited about that one, so stay tuned!</p>

<p>If you like this post, please subscribe to stay updated with new posts, and if you have a thought, correction, or a question, I would love to hear it by commenting below. Remember, practice makes perfect! Keep on learning every day! Cheers!</p>]]></content><author><name>Stern Semasuka</name></author><category term="machine learning" /><category term="linear regression" /><category term="sse" /><category term="mse" /><category term="r²" /><category term="p-value" /><category term="gradient descent" /><summary type="html"><![CDATA[Hello Folks! Welcome back. In this post, I will discuss the theory behind linear regression models, one of the wildly used machine learning models to predict continuous variables (fancy terms to say that we are predicting a number, also referred to as numerical target or label). The model is quite simple to understand yet powerful. We use it when model interpretability (when we want to know which dependent variables, aka features, are the most predictive) is required, like in the consumer lending or medical fields where transparency is at its core. In the next post, we will dive deeper into the coding part of a Linear Regression.]]></summary><media:thumbnail xmlns:media="http://search.yahoo.com/mrss/" url="https://semasuka.github.io/blog/blog/assets/post_images/regress_post_img.jpeg" /><media:content medium="image" url="https://semasuka.github.io/blog/blog/assets/post_images/regress_post_img.jpeg" xmlns:media="http://search.yahoo.com/mrss/" /></entry><entry><title type="html">Credit Card Approval Prediction (End-To-End Machine Learning Project)</title><link href="https://semasuka.github.io/blog/blog/2022/10/12/credit-card-approval-prediction.html" rel="alternate" type="text/html" title="Credit Card Approval Prediction (End-To-End Machine Learning Project)" /><published>2022-10-12T00:00:00+00:00</published><updated>2022-10-12T00:00:00+00:00</updated><id>https://semasuka.github.io/blog/blog/2022/10/12/credit-card-approval-prediction</id><content type="html" xml:base="https://semasuka.github.io/blog/blog/2022/10/12/credit-card-approval-prediction.html"><![CDATA[<p>Welcome back, forks! After a long period of not posting here, I am happy to share that I am back again on MIB. In this post, we will work on an end-to-end machine learning project. I firmly believe this is one of the most detailed and comprehensive end-to-end ML project blog post on the internet. This project is perfect for the beginner in Machine Learning and seasoned ML engineers who could still learn one or two things from this post. This project was featured on Luke Barousse Youtube channel, click <a href="https://www.youtube.com/watch?v=5Q0gB7imNOo&amp;t=222s">here</a> to watch the video.<!-- more --></p>

<p>Here is the roadmap we will follow:</p>
<ul>
  <li>We will start with exploratory data analysis(EDA)</li>
  <li>Feature engineering</li>
  <li>Feature selection</li>
  <li>Data preprocessing</li>
  <li>Model training</li>
  <li>Model selection</li>
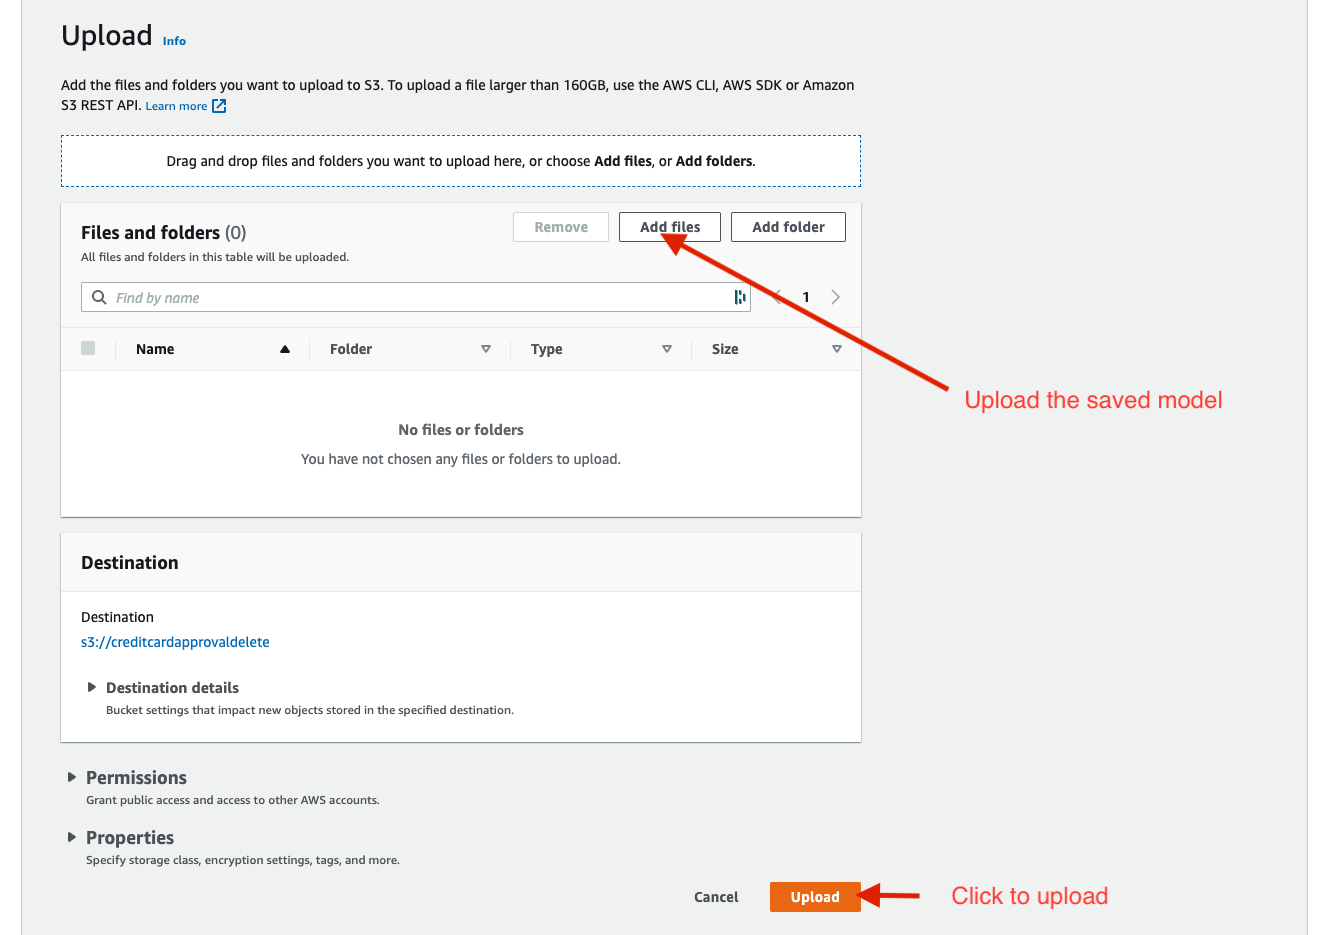
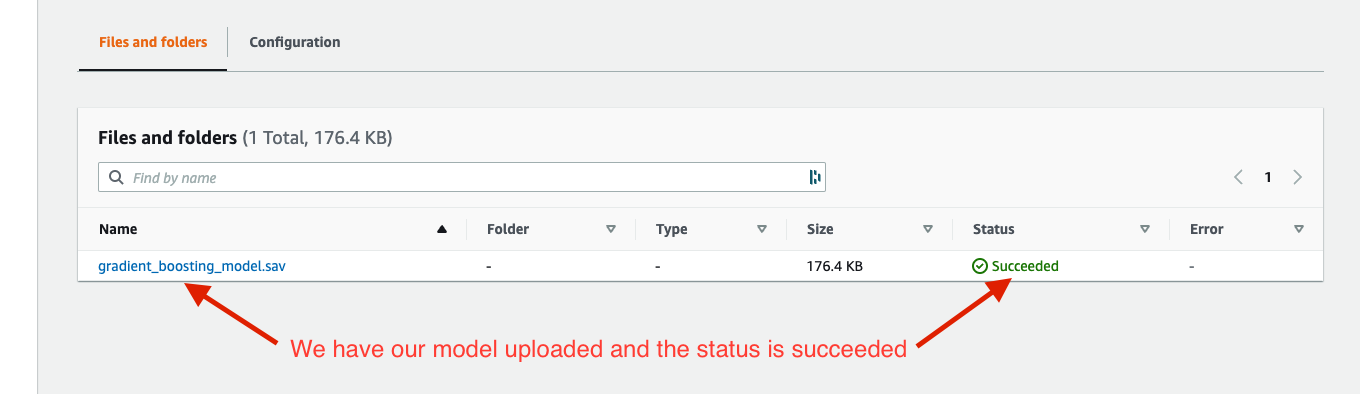
  <li>Model storage on AWS blob storage</li>
  <li>Build a web app interface for the model using Streamlit.</li>
  <li>Finally, deploy the model.</li>
</ul>

<p>The goal is to predict whether an application for a credit card will be approved or not, using the applicant data.</p>

<p>I chose this project because when applying for a loan, credit card, or any other type of credit at any financial institution, there is a hard inquiry that affects your credit score negatively. This app predicts the probability of being approved without affecting your credit score. This app can be used by applicants who want to find out if they will be approved for a credit card without affecting their credit score.</p>

<p><strong><em>For those who are in a hurry, here is the key insights results from the analysis of this project:</em></strong></p>

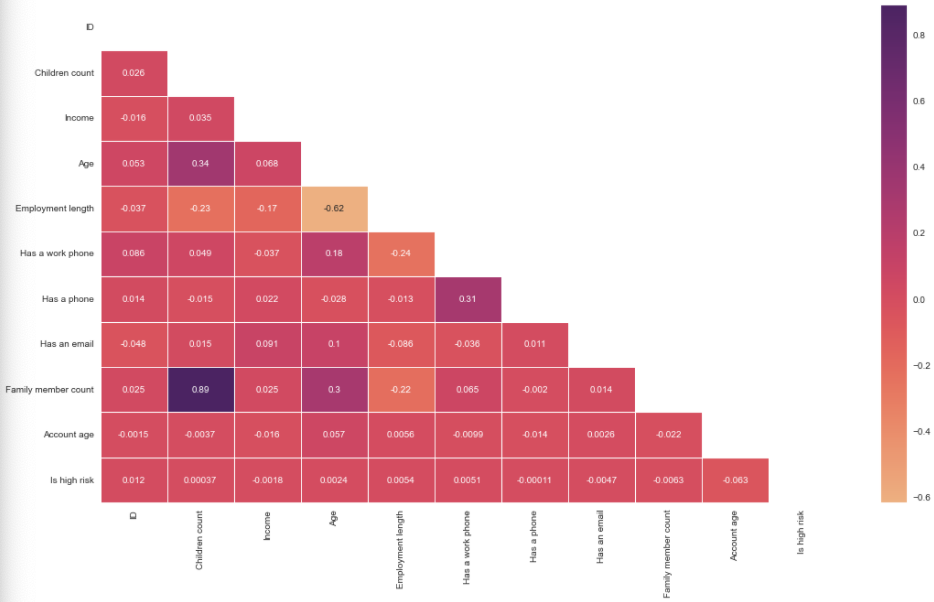
<p>Correlation between the features.</p>

<p><img src="/blog/assets/post_cont_image/heatmap_cc_approval.png" alt="heatmap" /></p>

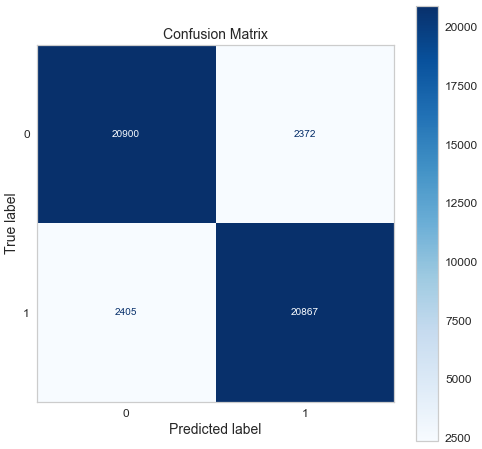
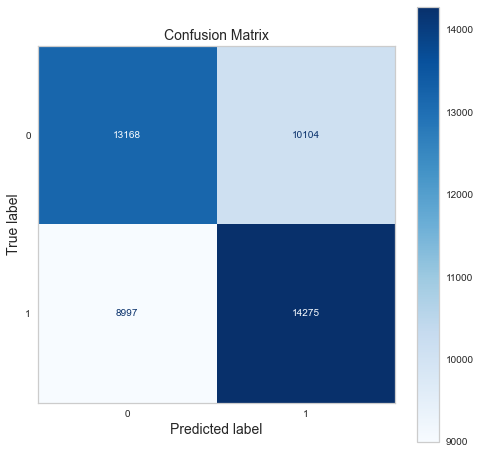
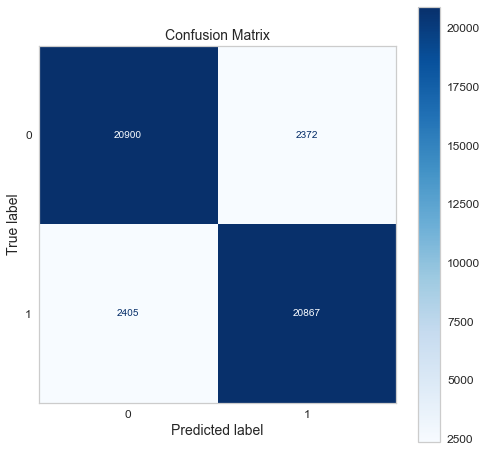
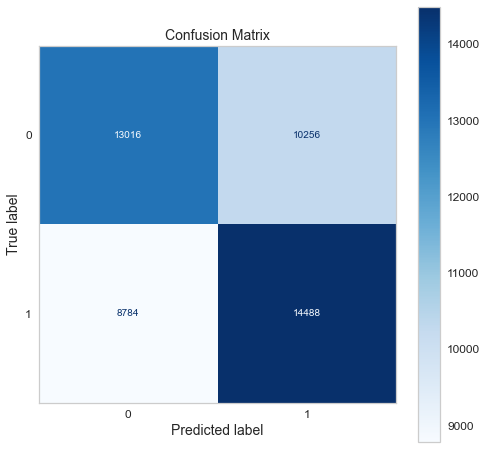
<p>Confusion matrix of gradient boosting classifier.</p>

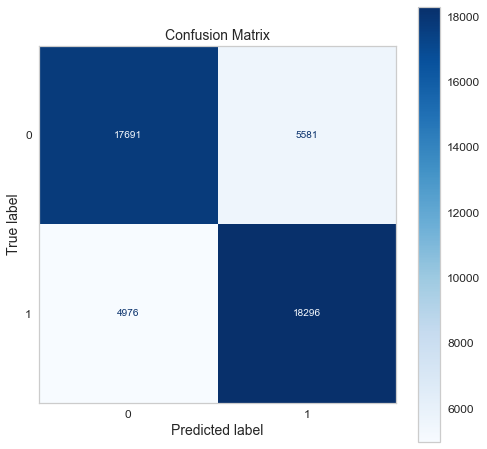
<p><img src="/blog/assets/post_cont_image/cm_cc_approval.png" alt="Confusion matrix" /></p>

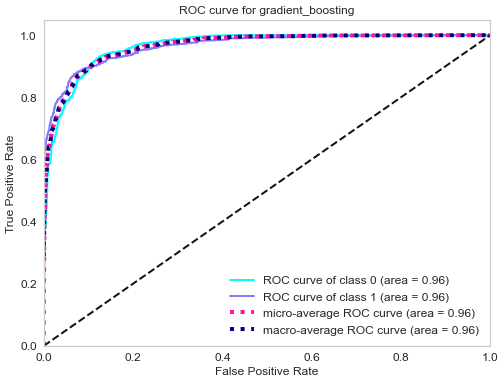
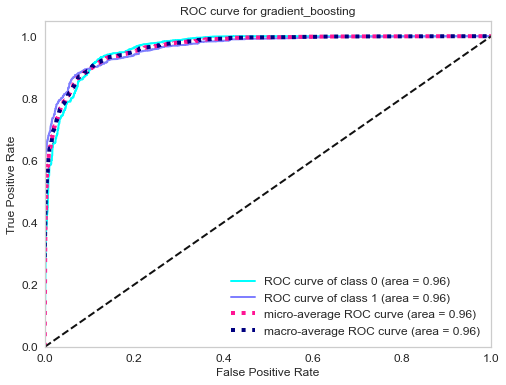
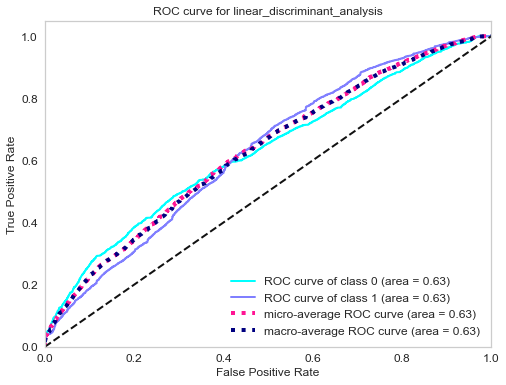
<p>ROC curve of gradient boosting classifier.</p>

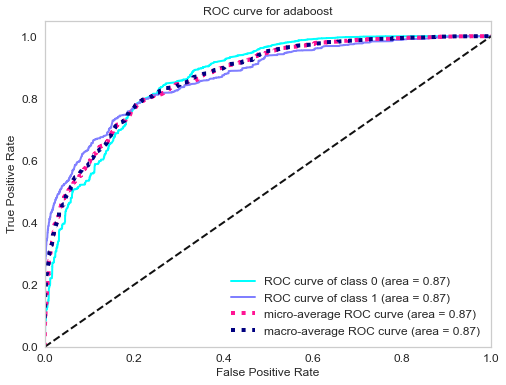
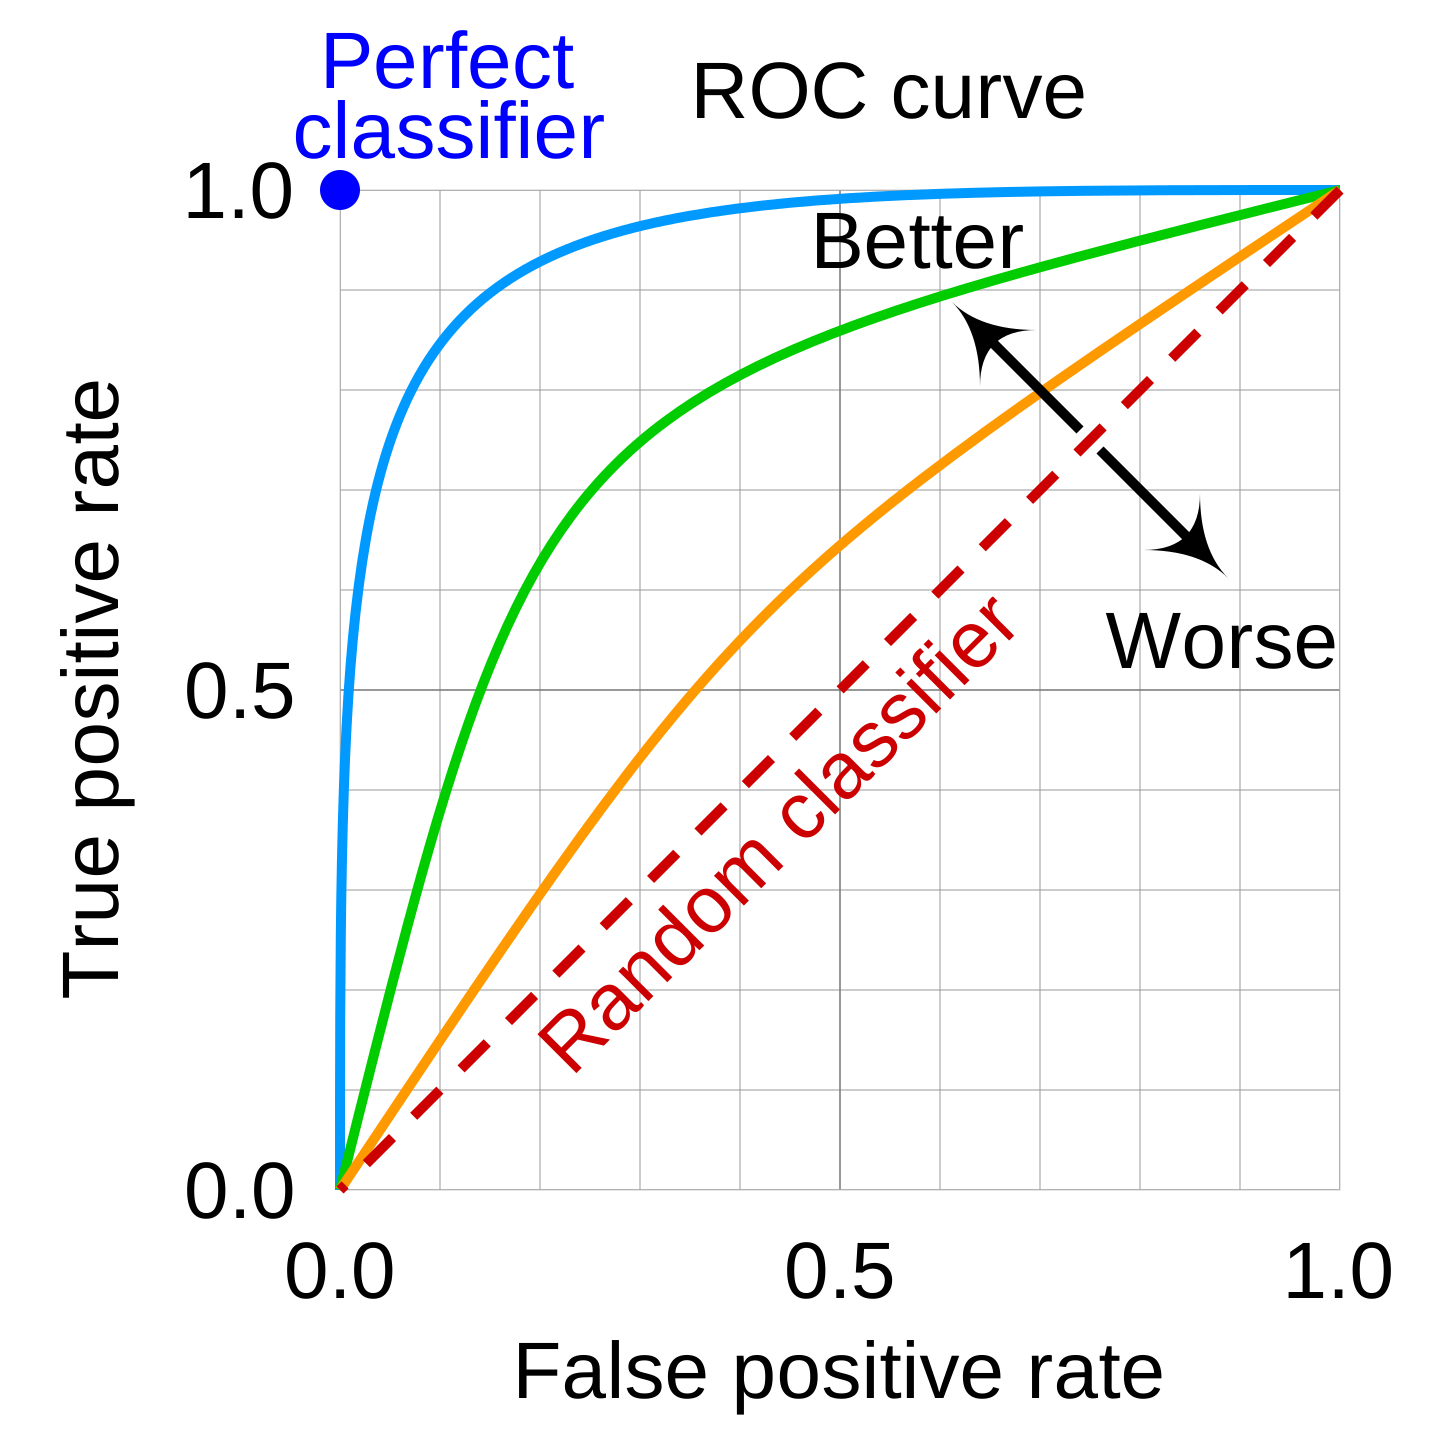
<p><img src="/blog/assets/post_cont_image/roc_cc_approval.png" alt="ROC curve" /></p>

<p>Top 3 models (with default parameters)</p>

<table>
  <thead>
    <tr>
      <th>Model</th>
      <th>Recall score</th>
    </tr>
  </thead>
  <tbody>
    <tr>
      <td>Support vector machine</td>
      <td>88%</td>
    </tr>
    <tr>
      <td>Gradient boosting</td>
      <td>90%</td>
    </tr>
    <tr>
      <td>Adaboost</td>
      <td>79%</td>
    </tr>
  </tbody>
</table>

<ul>
  <li><strong>The final model used for this project: Gradient boosting</strong></li>
  <li><strong>Metrics used: Recall</strong></li>
  <li>
    <p><strong>Why choose recall as metrics</strong>:
Since the objective of this problem is to minimize the risk of a credit default, the metrics to use depends on the current economic situation:</p>

    <ul>
      <li>
        <p>During a bull market (when the economy is expanding), people feel wealthy and are employed. Money is usually cheap, and the risk of default is low because of economic stability and low unemployment. The financial institution can handle the risk of default; therefore, it is not very strict about giving credit. The financial institution can handle some bad clients as long as most credit card owners are good clients (aka those who pay back their credit in time and in total).In this case, having a good recall (sensitivity) is ideal.</p>
      </li>
      <li>
        <p>During a bear market (when the economy is contracting), people lose their jobs and money through the stock market and other investment venues. Many people struggle to meet their financial obligations. The financial institution, therefore, tends to be more conservative in giving out credit or loans. The financial institution can’t afford to give out credit to many clients who won’t be able to pay back their credit. The financial institution would rather have a smaller number of good clients, even if it means that some good clients are denied credit. In this case, having a good precision (specificity) is desirable.</p>

        <p><strong><em>Note</em></strong>: There is always a trade-off between precision and recall. Choosing the right metrics depends on the problem you are solving.</p>

        <p><strong><em>Conclusion</em></strong>: Since the time I worked on this project (beginning 2022), we were in the longest bull market (excluding March 2020 flash crash) ever recorded; we will use recall as our metric.</p>
      </li>
    </ul>
  </li>
</ul>

<p><strong>Lessons learned and recommendation</strong></p>

<ul>
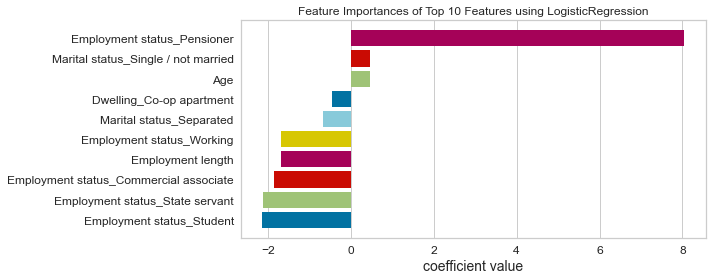
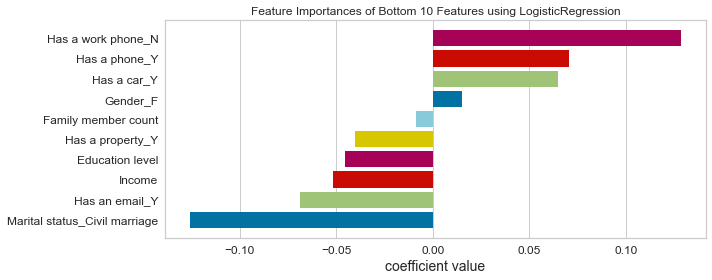
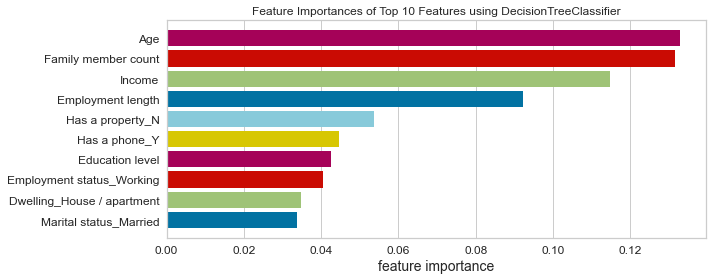
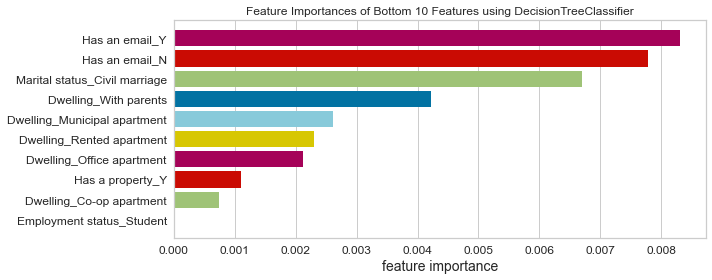
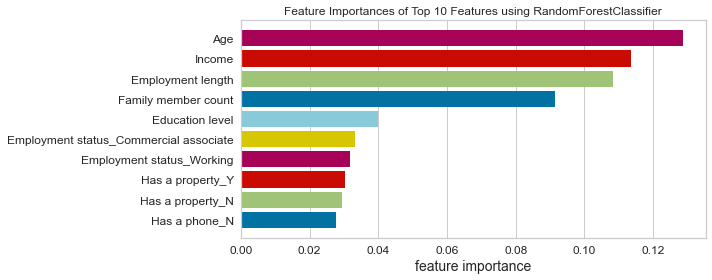
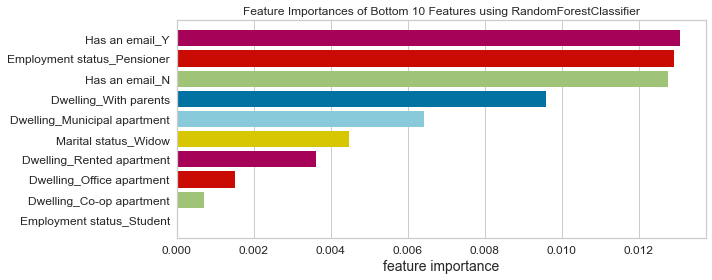
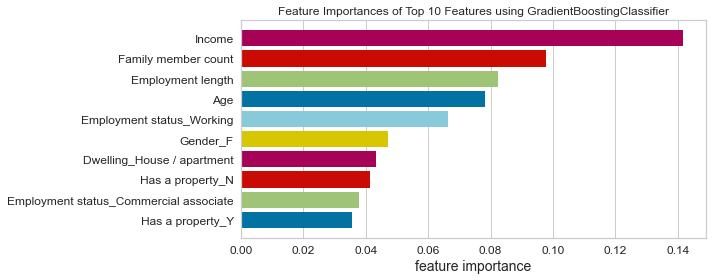
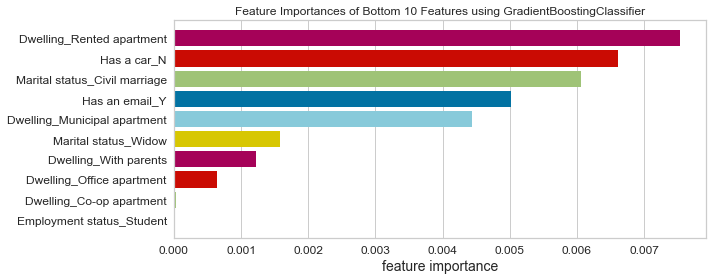
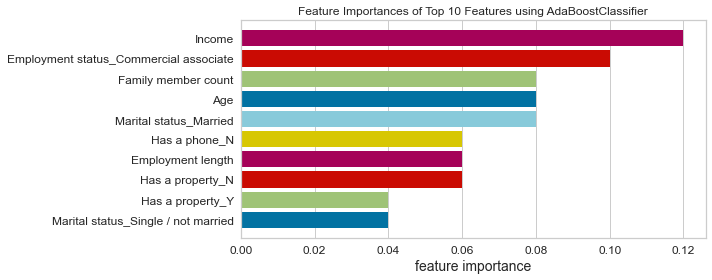
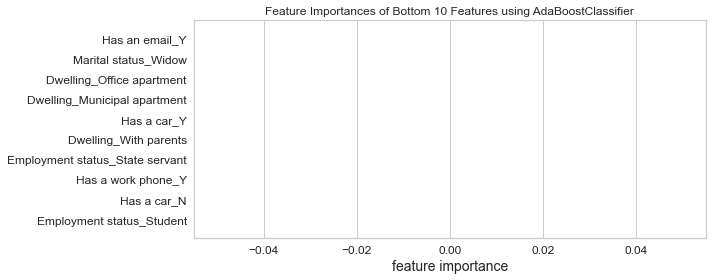
  <li>Based on this project’s analysis, income, family member headcount, and employment length are the three most predictive features in determining whether an applicant will be approved for a credit card. Other features like age and working employment status are also helpful. The least useful features are the type of dwelling and car ownership.</li>
  <li>The recommendation would be to focus more on the most predictive features when looking at the applicant profile and pay less attention to the least predictive features.</li>
</ul>

<p><strong><em>For the rest of my nerdy friends, let’s get started from scratch</em></strong></p>

<h3>Pre-requisites</h3>

<p>Wait! no, so fast! Before we start writing code, we need to have our python/jupyter environment ready, and Ken Jee has a fantastic video on this; click <a href="https://www.youtube.com/watch?v=C4OPn58BLaU">here</a> to watch it.</p>

<h3>Import necessary libraries</h3>

<p>Now we can import all the required libraries. Feel free to visit my <a href="https://semasuka.github.io/blog/2019/01/06/introduction-to-jupyter-notebook.html">other post</a>, where I talk about installing these libraries in the jupyter environment.</p>

<div class="language-python highlighter-rouge"><div class="highlight"><pre class="highlight"><code><span class="kn">import</span> <span class="nn">numpy</span> <span class="k">as</span> <span class="n">np</span>
<span class="kn">import</span> <span class="nn">pandas</span> <span class="k">as</span> <span class="n">pd</span>
<span class="kn">import</span> <span class="nn">missingno</span> <span class="k">as</span> <span class="n">msno</span>
<span class="kn">import</span> <span class="nn">matplotlib</span>
<span class="kn">import</span> <span class="nn">matplotlib.pyplot</span> <span class="k">as</span> <span class="n">plt</span>
<span class="kn">import</span> <span class="nn">seaborn</span> <span class="k">as</span> <span class="n">sns</span>
<span class="kn">import</span> <span class="nn">warnings</span>
<span class="kn">from</span> <span class="nn">pandas.core.common</span> <span class="kn">import</span> <span class="n">SettingWithCopyWarning</span>
<span class="kn">from</span> <span class="nn">pathlib</span> <span class="kn">import</span> <span class="n">Path</span>
<span class="kn">from</span> <span class="nn">scipy.stats</span> <span class="kn">import</span> <span class="n">probplot</span><span class="p">,</span> <span class="n">chi2_contingency</span><span class="p">,</span> <span class="n">chi2</span><span class="p">,</span> <span class="n">stats</span>
<span class="kn">from</span> <span class="nn">sklearn.model_selection</span> <span class="kn">import</span> <span class="n">train_test_split</span><span class="p">,</span> <span class="n">GridSearchCV</span><span class="p">,</span> <span class="n">RandomizedSearchCV</span><span class="p">,</span> <span class="n">cross_val_score</span><span class="p">,</span> <span class="n">cross_val_predict</span>
<span class="kn">from</span> <span class="nn">sklearn.base</span> <span class="kn">import</span> <span class="n">BaseEstimator</span><span class="p">,</span> <span class="n">TransformerMixin</span>
<span class="kn">from</span> <span class="nn">sklearn.pipeline</span> <span class="kn">import</span> <span class="n">Pipeline</span>
<span class="kn">from</span> <span class="nn">sklearn.calibration</span> <span class="kn">import</span> <span class="n">CalibratedClassifierCV</span>
<span class="kn">from</span> <span class="nn">sklearn.compose</span> <span class="kn">import</span> <span class="n">ColumnTransformer</span>
<span class="kn">from</span> <span class="nn">sklearn.preprocessing</span> <span class="kn">import</span> <span class="n">OneHotEncoder</span><span class="p">,</span> <span class="n">MinMaxScaler</span><span class="p">,</span> <span class="n">OrdinalEncoder</span>
<span class="kn">from</span> <span class="nn">sklearn.metrics</span> <span class="kn">import</span> <span class="n">ConfusionMatrixDisplay</span><span class="p">,</span> <span class="n">classification_report</span><span class="p">,</span> <span class="n">roc_curve</span><span class="p">,</span> <span class="n">roc_auc_score</span>
<span class="kn">from</span> <span class="nn">imblearn.over_sampling</span> <span class="kn">import</span> <span class="n">SMOTE</span>
<span class="kn">from</span> <span class="nn">sklearn.linear_model</span> <span class="kn">import</span> <span class="n">SGDClassifier</span><span class="p">,</span> <span class="n">LogisticRegression</span>
<span class="kn">from</span> <span class="nn">sklearn.svm</span> <span class="kn">import</span> <span class="n">SVC</span>
<span class="kn">from</span> <span class="nn">sklearn.tree</span> <span class="kn">import</span> <span class="n">DecisionTreeClassifier</span>
<span class="kn">from</span> <span class="nn">sklearn.ensemble</span> <span class="kn">import</span> <span class="n">RandomForestClassifier</span><span class="p">,</span> <span class="n">GradientBoostingClassifier</span><span class="p">,</span> <span class="n">BaggingClassifier</span><span class="p">,</span> <span class="n">AdaBoostClassifier</span><span class="p">,</span> <span class="n">ExtraTreesClassifier</span>
<span class="kn">from</span> <span class="nn">sklearn.naive_bayes</span> <span class="kn">import</span> <span class="n">GaussianNB</span>
<span class="kn">from</span> <span class="nn">sklearn.neighbors</span> <span class="kn">import</span> <span class="n">KNeighborsClassifier</span>
<span class="kn">from</span> <span class="nn">sklearn.discriminant_analysis</span> <span class="kn">import</span> <span class="n">LinearDiscriminantAnalysis</span>
<span class="kn">from</span> <span class="nn">sklearn.neural_network</span> <span class="kn">import</span> <span class="n">MLPClassifier</span>
<span class="kn">from</span> <span class="nn">sklearn.inspection</span> <span class="kn">import</span> <span class="n">permutation_importance</span>
<span class="kn">import</span> <span class="nn">scikitplot</span> <span class="k">as</span> <span class="n">skplt</span>
<span class="kn">from</span> <span class="nn">yellowbrick.model_selection</span> <span class="kn">import</span> <span class="n">FeatureImportances</span>
<span class="kn">import</span> <span class="nn">joblib</span>
<span class="kn">import</span> <span class="nn">os</span>
<span class="o">%</span><span class="n">matplotlib</span> <span class="n">inline</span>
</code></pre></div></div>

<p>I will briefly explain what each library does and why we need it for this project.</p>

<ul>
  <li>NumPy is a library for manipulating multidimensional arrays and matrices. In this project, we will use NumPy to change the sequences of the elements in a list and also transform an array with negative values into absolute ones.</li>
  <li>Pandas is a library to manipulate tabular data stored as dataframes (More than two columns) and Series(when dealing with one column); we will use it in this project to import the data into our notebook, create dataframes, merge and concatenate dataframes.</li>
  <li>MissingNo is a great library to visualize at a glance missing value in a Pandas dataframe.</li>
  <li>Scipy is a library that contains mathematical modules like statistics, optimization, linear algebra, etc</li>
  <li>Pathlib is a built-in python library with useful path functionalities. Pathlib will use it in the project to check if a file exists at a specific path, then use the joblib to save it.</li>
  <li>Matplotlib is a data visualization library to plot different types of plots like histograms, line plots, scatter plots, contour plots, etc. It is built on top of NumPy.</li>
  <li>Seaborn is another data visualization library built on top of Matplotlib with added features and simpler syntax than Matplotlib. We will mainly use this library for our exploratory data analysis.</li>
  <li>Warnings is a python builtin library to control the warnings at the execution time</li>
  <li>Scikit-learn, also called sklearn, is the industry standard machine learning library from which all the machine learning algorithms are imported. It is built on NumPy, Scipy, and Matplotlib.</li>
  <li>Imbalance learn is a library based on sklearn, which provides tools when dealing with classification with imbalanced classes. Here classes mean the prediction results, which in this case, are approved or denied for a credit card. In this project, we have two outcomes (we have a binary classification), and one of the outcomes is less likely to happen, which is reflected in the data. So we use the SMOTE technique to balance the outcomes because we don’t want to train on unbalanced data as we try to avoid bias.</li>
  <li>Scikit-plot is a helpful library that plots scikit-learn objects; for this project, Scikit-plot will use to plot the ROC curve.</li>
  <li>Yellowbrick extends the scikit-learn API library to make a model selection. In this project, we have used it to plot the feature importance.</li>
  <li>Joblib is a builtin python library to save models as files; those models will deploy on AWS S3</li>
  <li>os is a builtin library to access some of the operating system functionality</li>
  <li>Finally, magic command <code class="language-plaintext highlighter-rouge">%matplotlib inline</code> will make your plot outputs appear and be stored within the notebook.</li>
</ul>

<h3>Import the data</h3>

<p>After importing the libraries, we will now import the datasets. The datasets are from Kaggle. Here is the <a href="https://www.kaggle.com/datasets/rikdifos/credit-card-approval-prediction">link</a>.</p>

<p>There are two ways to import the CSV, we can download the file and pass the local machine path to the <code class="language-plaintext highlighter-rouge">read_csv</code> pandas function, or we can host the data on GitHub and directly read the hosted CSV file as a raw data. In this case, we went with the latter method.</p>

<p>The first dataset is the application record with all the information about the applicants like gender, age, income, etc. The second dataset is the credit record which holds information about the credit status and balance. we will store those two dataset in <code class="language-plaintext highlighter-rouge">cc_data_full_data</code> and <code class="language-plaintext highlighter-rouge">credit_status</code> respectively.</p>

<div class="language-python highlighter-rouge"><div class="highlight"><pre class="highlight"><code><span class="n">cc_data_full_data</span> <span class="o">=</span> <span class="n">pd</span><span class="p">.</span><span class="n">read_csv</span><span class="p">(</span><span class="s">'https://raw.githubusercontent.com/semasuka/Credit-card-approval-prediction-classification/main/datasets/application_record.csv'</span><span class="p">)</span>
<span class="n">credit_status</span> <span class="o">=</span> <span class="n">pd</span><span class="p">.</span><span class="n">read_csv</span><span class="p">(</span><span class="s">'https://raw.githubusercontent.com/semasuka/Credit-card-approval-prediction-classification/main/datasets/credit_record.csv'</span><span class="p">)</span>
</code></pre></div></div>

<p>Let’s glance at the first five rows using each Pandas’ <code class="language-plaintext highlighter-rouge">head</code>` method.</p>

<div class="language-python highlighter-rouge"><div class="highlight"><pre class="highlight"><code><span class="n">cc_data_full_data</span><span class="p">.</span><span class="n">head</span><span class="p">()</span>
</code></pre></div></div>

<div>
<style scoped="">
    .dataframe tbody tr th:only-of-type {
        vertical-align: middle;
    }

    .dataframe tbody tr th {
        vertical-align: top;
    }

    .dataframe thead th {
        text-align: right;
    }
</style>
<table border="1" class="dataframe">
  <thead>
    <tr style="text-align: right;">
      <th></th>
      <th>ID</th>
      <th>CODE_GENDER</th>
      <th>FLAG_OWN_CAR</th>
      <th>FLAG_OWN_REALTY</th>
      <th>CNT_CHILDREN</th>
      <th>AMT_INCOME_TOTAL</th>
      <th>NAME_INCOME_TYPE</th>
      <th>NAME_EDUCATION_TYPE</th>
      <th>NAME_FAMILY_STATUS</th>
      <th>NAME_HOUSING_TYPE</th>
      <th>DAYS_BIRTH</th>
      <th>DAYS_EMPLOYED</th>
      <th>FLAG_MOBIL</th>
      <th>FLAG_WORK_PHONE</th>
      <th>FLAG_PHONE</th>
      <th>FLAG_EMAIL</th>
      <th>OCCUPATION_TYPE</th>
      <th>CNT_FAM_MEMBERS</th>
    </tr>
  </thead>
  <tbody>
    <tr>
      <th>0</th>
      <td>5008804</td>
      <td>M</td>
      <td>Y</td>
      <td>Y</td>
      <td>0</td>
      <td>427500.0</td>
      <td>Working</td>
      <td>Higher education</td>
      <td>Civil marriage</td>
      <td>Rented apartment</td>
      <td>-12005</td>
      <td>-4542</td>
      <td>1</td>
      <td>1</td>
      <td>0</td>
      <td>0</td>
      <td>NaN</td>
      <td>2.0</td>
    </tr>
    <tr>
      <th>1</th>
      <td>5008805</td>
      <td>M</td>
      <td>Y</td>
      <td>Y</td>
      <td>0</td>
      <td>427500.0</td>
      <td>Working</td>
      <td>Higher education</td>
      <td>Civil marriage</td>
      <td>Rented apartment</td>
      <td>-12005</td>
      <td>-4542</td>
      <td>1</td>
      <td>1</td>
      <td>0</td>
      <td>0</td>
      <td>NaN</td>
      <td>2.0</td>
    </tr>
    <tr>
      <th>2</th>
      <td>5008806</td>
      <td>M</td>
      <td>Y</td>
      <td>Y</td>
      <td>0</td>
      <td>112500.0</td>
      <td>Working</td>
      <td>Secondary / secondary special</td>
      <td>Married</td>
      <td>House / apartment</td>
      <td>-21474</td>
      <td>-1134</td>
      <td>1</td>
      <td>0</td>
      <td>0</td>
      <td>0</td>
      <td>Security staff</td>
      <td>2.0</td>
    </tr>
    <tr>
      <th>3</th>
      <td>5008808</td>
      <td>F</td>
      <td>N</td>
      <td>Y</td>
      <td>0</td>
      <td>270000.0</td>
      <td>Commercial associate</td>
      <td>Secondary / secondary special</td>
      <td>Single / not married</td>
      <td>House / apartment</td>
      <td>-19110</td>
      <td>-3051</td>
      <td>1</td>
      <td>0</td>
      <td>1</td>
      <td>1</td>
      <td>Sales staff</td>
      <td>1.0</td>
    </tr>
    <tr>
      <th>4</th>
      <td>5008809</td>
      <td>F</td>
      <td>N</td>
      <td>Y</td>
      <td>0</td>
      <td>270000.0</td>
      <td>Commercial associate</td>
      <td>Secondary / secondary special</td>
      <td>Single / not married</td>
      <td>House / apartment</td>
      <td>-19110</td>
      <td>-3051</td>
      <td>1</td>
      <td>0</td>
      <td>1</td>
      <td>1</td>
      <td>Sales staff</td>
      <td>1.0</td>
    </tr>
  </tbody>
</table>
</div>

<div class="language-python highlighter-rouge"><div class="highlight"><pre class="highlight"><code><span class="n">credit_status</span><span class="p">.</span><span class="n">head</span><span class="p">()</span>
</code></pre></div></div>

<div>
<style scoped="">
    .dataframe tbody tr th:only-of-type {
        vertical-align: middle;
    }

    .dataframe tbody tr th {
        vertical-align: top;
    }

    .dataframe thead th {
        text-align: right;
    }
</style>
<table border="1" class="dataframe">
  <thead>
    <tr style="text-align: right;">
      <th></th>
      <th>ID</th>
      <th>MONTHS_BALANCE</th>
      <th>STATUS</th>
    </tr>
  </thead>
  <tbody>
    <tr>
      <th>0</th>
      <td>5001711</td>
      <td>0</td>
      <td>X</td>
    </tr>
    <tr>
      <th>1</th>
      <td>5001711</td>
      <td>-1</td>
      <td>0</td>
    </tr>
    <tr>
      <th>2</th>
      <td>5001711</td>
      <td>-2</td>
      <td>0</td>
    </tr>
    <tr>
      <th>3</th>
      <td>5001711</td>
      <td>-3</td>
      <td>0</td>
    </tr>
    <tr>
      <th>4</th>
      <td>5001712</td>
      <td>0</td>
      <td>C</td>
    </tr>
  </tbody>
</table>
</div>

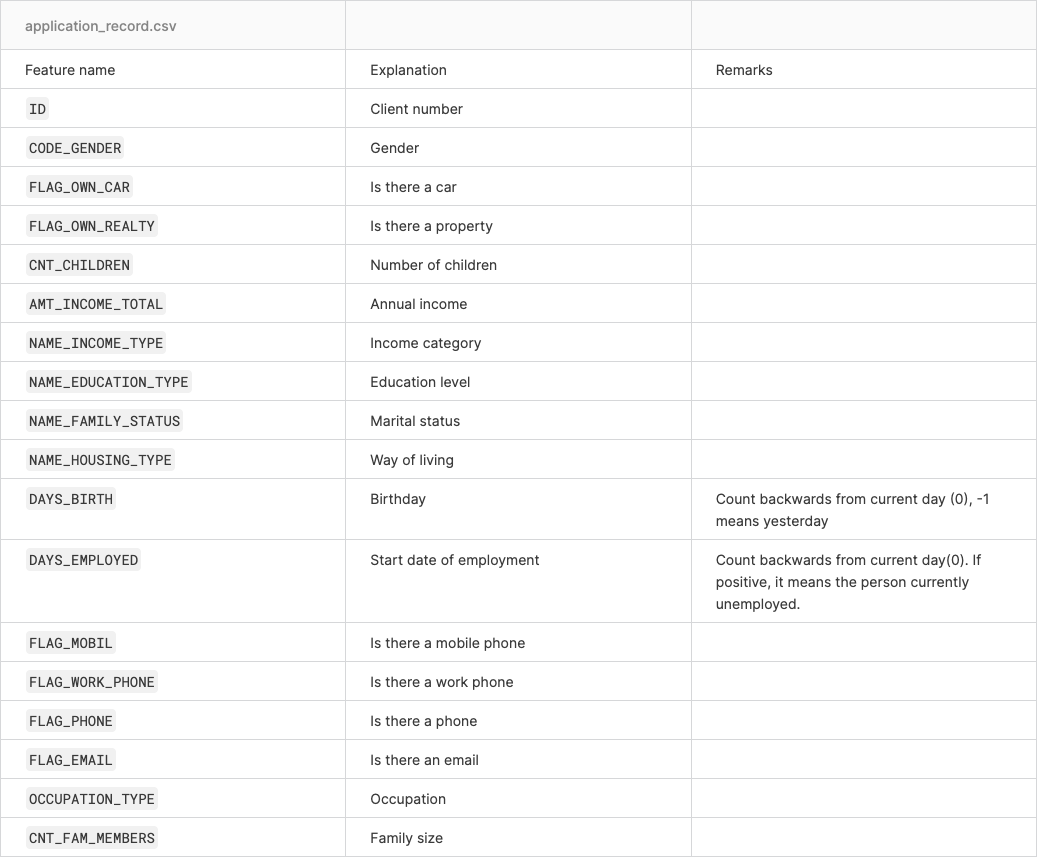
<p>Now let’s look at the metadata of the datasets to understand the data better.</p>

<p>For the application record dataset.</p>

<p><img src="/blog/assets/post_cont_image/cc_app_meta.png" alt="appli_rec_metadata" /></p>

<p>And for the credit record dataset.</p>

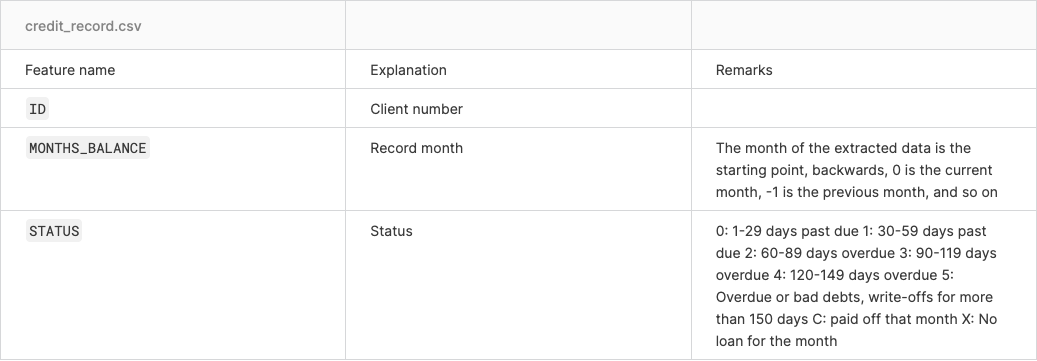
<p><img src="/blog/assets/post_cont_image/credit_meta.png" alt="appli_rec_metadata" /></p>

<h3>Creating a target variable</h3>

<p>As you may have noticed from our first dataset, we don’t have a target variable that states whether the client is good or not (a client who will not default on their credit card would be called a good client). We will use the credit record to come up with the target variable. We use the <a href="https://www.listendata.com/2019/09/credit-risk-vintage-analysis.html">vintage analysis</a> for this.</p>

<p>For simplicity purposes, we will say that the applicants over 60 days overdue are considered bad clients. When the target variable is 1, that means a bad client, and when it is 0, that represents a good client. That is what the following script does.</p>

<div class="language-python highlighter-rouge"><div class="highlight"><pre class="highlight"><code><span class="n">begin_month</span><span class="o">=</span><span class="n">pd</span><span class="p">.</span><span class="n">DataFrame</span><span class="p">(</span><span class="n">credit_status</span><span class="p">.</span><span class="n">groupby</span><span class="p">([</span><span class="s">'ID'</span><span class="p">])[</span><span class="s">'MONTHS_BALANCE'</span><span class="p">].</span><span class="n">agg</span><span class="p">(</span><span class="nb">min</span><span class="p">))</span>
<span class="n">begin_month</span><span class="o">=</span><span class="n">begin_month</span><span class="p">.</span><span class="n">rename</span><span class="p">(</span><span class="n">columns</span><span class="o">=</span><span class="p">{</span><span class="s">'MONTHS_BALANCE'</span><span class="p">:</span><span class="s">'Account age'</span><span class="p">})</span>
<span class="n">cc_data_full_data</span><span class="o">=</span><span class="n">pd</span><span class="p">.</span><span class="n">merge</span><span class="p">(</span><span class="n">cc_data_full_data</span><span class="p">,</span><span class="n">begin_month</span><span class="p">,</span><span class="n">how</span><span class="o">=</span><span class="s">'left'</span><span class="p">,</span><span class="n">on</span><span class="o">=</span><span class="s">'ID'</span><span class="p">)</span>
<span class="n">credit_status</span><span class="p">[</span><span class="s">'dep_value'</span><span class="p">]</span> <span class="o">=</span> <span class="bp">None</span>
<span class="n">credit_status</span><span class="p">[</span><span class="s">'dep_value'</span><span class="p">][</span><span class="n">credit_status</span><span class="p">[</span><span class="s">'STATUS'</span><span class="p">]</span> <span class="o">==</span><span class="s">'2'</span><span class="p">]</span><span class="o">=</span><span class="s">'Yes'</span>
<span class="n">credit_status</span><span class="p">[</span><span class="s">'dep_value'</span><span class="p">][</span><span class="n">credit_status</span><span class="p">[</span><span class="s">'STATUS'</span><span class="p">]</span> <span class="o">==</span><span class="s">'3'</span><span class="p">]</span><span class="o">=</span><span class="s">'Yes'</span>
<span class="n">credit_status</span><span class="p">[</span><span class="s">'dep_value'</span><span class="p">][</span><span class="n">credit_status</span><span class="p">[</span><span class="s">'STATUS'</span><span class="p">]</span> <span class="o">==</span><span class="s">'4'</span><span class="p">]</span><span class="o">=</span><span class="s">'Yes'</span>
<span class="n">credit_status</span><span class="p">[</span><span class="s">'dep_value'</span><span class="p">][</span><span class="n">credit_status</span><span class="p">[</span><span class="s">'STATUS'</span><span class="p">]</span> <span class="o">==</span><span class="s">'5'</span><span class="p">]</span><span class="o">=</span><span class="s">'Yes'</span>
<span class="n">cpunt</span><span class="o">=</span><span class="n">credit_status</span><span class="p">.</span><span class="n">groupby</span><span class="p">(</span><span class="s">'ID'</span><span class="p">).</span><span class="n">count</span><span class="p">()</span>
<span class="n">cpunt</span><span class="p">[</span><span class="s">'dep_value'</span><span class="p">][</span><span class="n">cpunt</span><span class="p">[</span><span class="s">'dep_value'</span><span class="p">]</span> <span class="o">&gt;</span> <span class="mi">0</span><span class="p">]</span><span class="o">=</span><span class="s">'Yes'</span>
<span class="n">cpunt</span><span class="p">[</span><span class="s">'dep_value'</span><span class="p">][</span><span class="n">cpunt</span><span class="p">[</span><span class="s">'dep_value'</span><span class="p">]</span> <span class="o">==</span> <span class="mi">0</span><span class="p">]</span><span class="o">=</span><span class="s">'No'</span>
<span class="n">cpunt</span> <span class="o">=</span> <span class="n">cpunt</span><span class="p">[[</span><span class="s">'dep_value'</span><span class="p">]]</span>
<span class="n">cc_data_full_data</span> <span class="o">=</span> <span class="n">pd</span><span class="p">.</span><span class="n">merge</span><span class="p">(</span><span class="n">cc_data_full_data</span><span class="p">,</span><span class="n">cpunt</span><span class="p">,</span><span class="n">how</span><span class="o">=</span><span class="s">'inner'</span><span class="p">,</span><span class="n">on</span><span class="o">=</span><span class="s">'ID'</span><span class="p">)</span>
<span class="n">cc_data_full_data</span><span class="p">[</span><span class="s">'Is high risk'</span><span class="p">]</span><span class="o">=</span><span class="n">cc_data_full_data</span><span class="p">[</span><span class="s">'dep_value'</span><span class="p">]</span>
<span class="n">cc_data_full_data</span><span class="p">.</span><span class="n">loc</span><span class="p">[</span><span class="n">cc_data_full_data</span><span class="p">[</span><span class="s">'Is high risk'</span><span class="p">]</span><span class="o">==</span><span class="s">'Yes'</span><span class="p">,</span><span class="s">'Is high risk'</span><span class="p">]</span><span class="o">=</span><span class="mi">1</span>
<span class="n">cc_data_full_data</span><span class="p">.</span><span class="n">loc</span><span class="p">[</span><span class="n">cc_data_full_data</span><span class="p">[</span><span class="s">'Is high risk'</span><span class="p">]</span><span class="o">==</span><span class="s">'No'</span><span class="p">,</span><span class="s">'Is high risk'</span><span class="p">]</span><span class="o">=</span><span class="mi">0</span>
<span class="n">cc_data_full_data</span><span class="p">.</span><span class="n">drop</span><span class="p">(</span><span class="s">'dep_value'</span><span class="p">,</span><span class="n">axis</span><span class="o">=</span><span class="mi">1</span><span class="p">,</span><span class="n">inplace</span><span class="o">=</span><span class="bp">True</span><span class="p">)</span>
<span class="n">pd</span><span class="p">.</span><span class="n">options</span><span class="p">.</span><span class="n">mode</span><span class="p">.</span><span class="n">chained_assignment</span> <span class="o">=</span> <span class="bp">None</span> <span class="c1"># hide warning SettingWithCopyWarning
</span></code></pre></div></div>

<div class="language-plaintext highlighter-rouge"><div class="highlight"><pre class="highlight"><code>/var/folders/bb/dzx22n7n1t1gkqfhhky4j2ch0000gn/T/ipykernel_29855/1467211908.py:5: SettingWithCopyWarning: 
A value is trying to be set on a copy of a slice from a DataFrame

See the caveats in the documentation: https://pandas.pydata.org/pandas-docs/stable/user_guide/indexing.html#returning-a-view-versus-a-copy
  credit_status['dep_value'][credit_status['STATUS'] =='2']='Yes'
/var/folders/bb/dzx22n7n1t1gkqfhhky4j2ch0000gn/T/ipykernel_29855/1467211908.py:6: SettingWithCopyWarning: 
A value is trying to be set on a copy of a slice from a DataFrame

See the caveats in the documentation: https://pandas.pydata.org/pandas-docs/stable/user_guide/indexing.html#returning-a-view-versus-a-copy
  credit_status['dep_value'][credit_status['STATUS'] =='3']='Yes'
/var/folders/bb/dzx22n7n1t1gkqfhhky4j2ch0000gn/T/ipykernel_29855/1467211908.py:7: SettingWithCopyWarning: 
A value is trying to be set on a copy of a slice from a DataFrame

See the caveats in the documentation: https://pandas.pydata.org/pandas-docs/stable/user_guide/indexing.html#returning-a-view-versus-a-copy
  credit_status['dep_value'][credit_status['STATUS'] =='4']='Yes'
/var/folders/bb/dzx22n7n1t1gkqfhhky4j2ch0000gn/T/ipykernel_29855/1467211908.py:8: SettingWithCopyWarning: 
A value is trying to be set on a copy of a slice from a DataFrame

See the caveats in the documentation: https://pandas.pydata.org/pandas-docs/stable/user_guide/indexing.html#returning-a-view-versus-a-copy
  credit_status['dep_value'][credit_status['STATUS'] =='5']='Yes'
</code></pre></div></div>

<p>Let’s print the first 5 rows of the dataframe, with the newly created target column <code class="language-plaintext highlighter-rouge">Is high risk</code> at the end.</p>

<div class="language-python highlighter-rouge"><div class="highlight"><pre class="highlight"><code><span class="n">cc_data_full_data</span><span class="p">.</span><span class="n">head</span><span class="p">()</span>
</code></pre></div></div>

<div>
<style scoped="">
    .dataframe tbody tr th:only-of-type {
        vertical-align: middle;
    }

    .dataframe tbody tr th {
        vertical-align: top;
    }

    .dataframe thead th {
        text-align: right;
    }
</style>
<table border="1" class="dataframe">
  <thead>
    <tr style="text-align: right;">
      <th></th>
      <th>ID</th>
      <th>CODE_GENDER</th>
      <th>FLAG_OWN_CAR</th>
      <th>FLAG_OWN_REALTY</th>
      <th>CNT_CHILDREN</th>
      <th>AMT_INCOME_TOTAL</th>
      <th>NAME_INCOME_TYPE</th>
      <th>NAME_EDUCATION_TYPE</th>
      <th>NAME_FAMILY_STATUS</th>
      <th>NAME_HOUSING_TYPE</th>
      <th>DAYS_BIRTH</th>
      <th>DAYS_EMPLOYED</th>
      <th>FLAG_MOBIL</th>
      <th>FLAG_WORK_PHONE</th>
      <th>FLAG_PHONE</th>
      <th>FLAG_EMAIL</th>
      <th>OCCUPATION_TYPE</th>
      <th>CNT_FAM_MEMBERS</th>
      <th>Account age</th>
      <th>Is high risk</th>
    </tr>
  </thead>
  <tbody>
    <tr>
      <th>0</th>
      <td>5008804</td>
      <td>M</td>
      <td>Y</td>
      <td>Y</td>
      <td>0</td>
      <td>427500.0</td>
      <td>Working</td>
      <td>Higher education</td>
      <td>Civil marriage</td>
      <td>Rented apartment</td>
      <td>-12005</td>
      <td>-4542</td>
      <td>1</td>
      <td>1</td>
      <td>0</td>
      <td>0</td>
      <td>NaN</td>
      <td>2.0</td>
      <td>-15.0</td>
      <td>0</td>
    </tr>
    <tr>
      <th>1</th>
      <td>5008805</td>
      <td>M</td>
      <td>Y</td>
      <td>Y</td>
      <td>0</td>
      <td>427500.0</td>
      <td>Working</td>
      <td>Higher education</td>
      <td>Civil marriage</td>
      <td>Rented apartment</td>
      <td>-12005</td>
      <td>-4542</td>
      <td>1</td>
      <td>1</td>
      <td>0</td>
      <td>0</td>
      <td>NaN</td>
      <td>2.0</td>
      <td>-14.0</td>
      <td>0</td>
    </tr>
    <tr>
      <th>2</th>
      <td>5008806</td>
      <td>M</td>
      <td>Y</td>
      <td>Y</td>
      <td>0</td>
      <td>112500.0</td>
      <td>Working</td>
      <td>Secondary / secondary special</td>
      <td>Married</td>
      <td>House / apartment</td>
      <td>-21474</td>
      <td>-1134</td>
      <td>1</td>
      <td>0</td>
      <td>0</td>
      <td>0</td>
      <td>Security staff</td>
      <td>2.0</td>
      <td>-29.0</td>
      <td>0</td>
    </tr>
    <tr>
      <th>3</th>
      <td>5008808</td>
      <td>F</td>
      <td>N</td>
      <td>Y</td>
      <td>0</td>
      <td>270000.0</td>
      <td>Commercial associate</td>
      <td>Secondary / secondary special</td>
      <td>Single / not married</td>
      <td>House / apartment</td>
      <td>-19110</td>
      <td>-3051</td>
      <td>1</td>
      <td>0</td>
      <td>1</td>
      <td>1</td>
      <td>Sales staff</td>
      <td>1.0</td>
      <td>-4.0</td>
      <td>0</td>
    </tr>
    <tr>
      <th>4</th>
      <td>5008809</td>
      <td>F</td>
      <td>N</td>
      <td>Y</td>
      <td>0</td>
      <td>270000.0</td>
      <td>Commercial associate</td>
      <td>Secondary / secondary special</td>
      <td>Single / not married</td>
      <td>House / apartment</td>
      <td>-19110</td>
      <td>-3051</td>
      <td>1</td>
      <td>0</td>
      <td>1</td>
      <td>1</td>
      <td>Sales staff</td>
      <td>1.0</td>
      <td>-26.0</td>
      <td>0</td>
    </tr>
  </tbody>
</table>
</div>

<p>Since the features (columns) names are not very descriptive, we will change them to make them more readable.</p>

<div class="language-python highlighter-rouge"><div class="highlight"><pre class="highlight"><code><span class="c1"># rename the features to more readable feature names
</span><span class="n">cc_data_full_data</span> <span class="o">=</span> <span class="n">cc_data_full_data</span><span class="p">.</span><span class="n">rename</span><span class="p">(</span><span class="n">columns</span><span class="o">=</span><span class="p">{</span>
    <span class="s">'CODE_GENDER'</span><span class="p">:</span><span class="s">'Gender'</span><span class="p">,</span>
    <span class="s">'FLAG_OWN_CAR'</span><span class="p">:</span><span class="s">'Has a car'</span><span class="p">,</span>
    <span class="s">'FLAG_OWN_REALTY'</span><span class="p">:</span><span class="s">'Has a property'</span><span class="p">,</span>
    <span class="s">'CNT_CHILDREN'</span><span class="p">:</span><span class="s">'Children count'</span><span class="p">,</span>
    <span class="s">'AMT_INCOME_TOTAL'</span><span class="p">:</span><span class="s">'Income'</span><span class="p">,</span>
    <span class="s">'NAME_INCOME_TYPE'</span><span class="p">:</span><span class="s">'Employment status'</span><span class="p">,</span>
    <span class="s">'NAME_EDUCATION_TYPE'</span><span class="p">:</span><span class="s">'Education level'</span><span class="p">,</span>
    <span class="s">'NAME_FAMILY_STATUS'</span><span class="p">:</span><span class="s">'Marital status'</span><span class="p">,</span>
    <span class="s">'NAME_HOUSING_TYPE'</span><span class="p">:</span><span class="s">'Dwelling'</span><span class="p">,</span>
    <span class="s">'DAYS_BIRTH'</span><span class="p">:</span><span class="s">'Age'</span><span class="p">,</span>
    <span class="s">'DAYS_EMPLOYED'</span><span class="p">:</span> <span class="s">'Employment length'</span><span class="p">,</span>
    <span class="s">'FLAG_MOBIL'</span><span class="p">:</span> <span class="s">'Has a mobile phone'</span><span class="p">,</span>
    <span class="s">'FLAG_WORK_PHONE'</span><span class="p">:</span> <span class="s">'Has a work phone'</span><span class="p">,</span>
    <span class="s">'FLAG_PHONE'</span><span class="p">:</span> <span class="s">'Has a phone'</span><span class="p">,</span>
    <span class="s">'FLAG_EMAIL'</span><span class="p">:</span> <span class="s">'Has an email'</span><span class="p">,</span>
    <span class="s">'OCCUPATION_TYPE'</span><span class="p">:</span> <span class="s">'Job title'</span><span class="p">,</span>
    <span class="s">'CNT_FAM_MEMBERS'</span><span class="p">:</span> <span class="s">'Family member count'</span><span class="p">,</span>
    <span class="s">'Account age'</span><span class="p">:</span> <span class="s">'Account age'</span>
    <span class="p">})</span>
</code></pre></div></div>

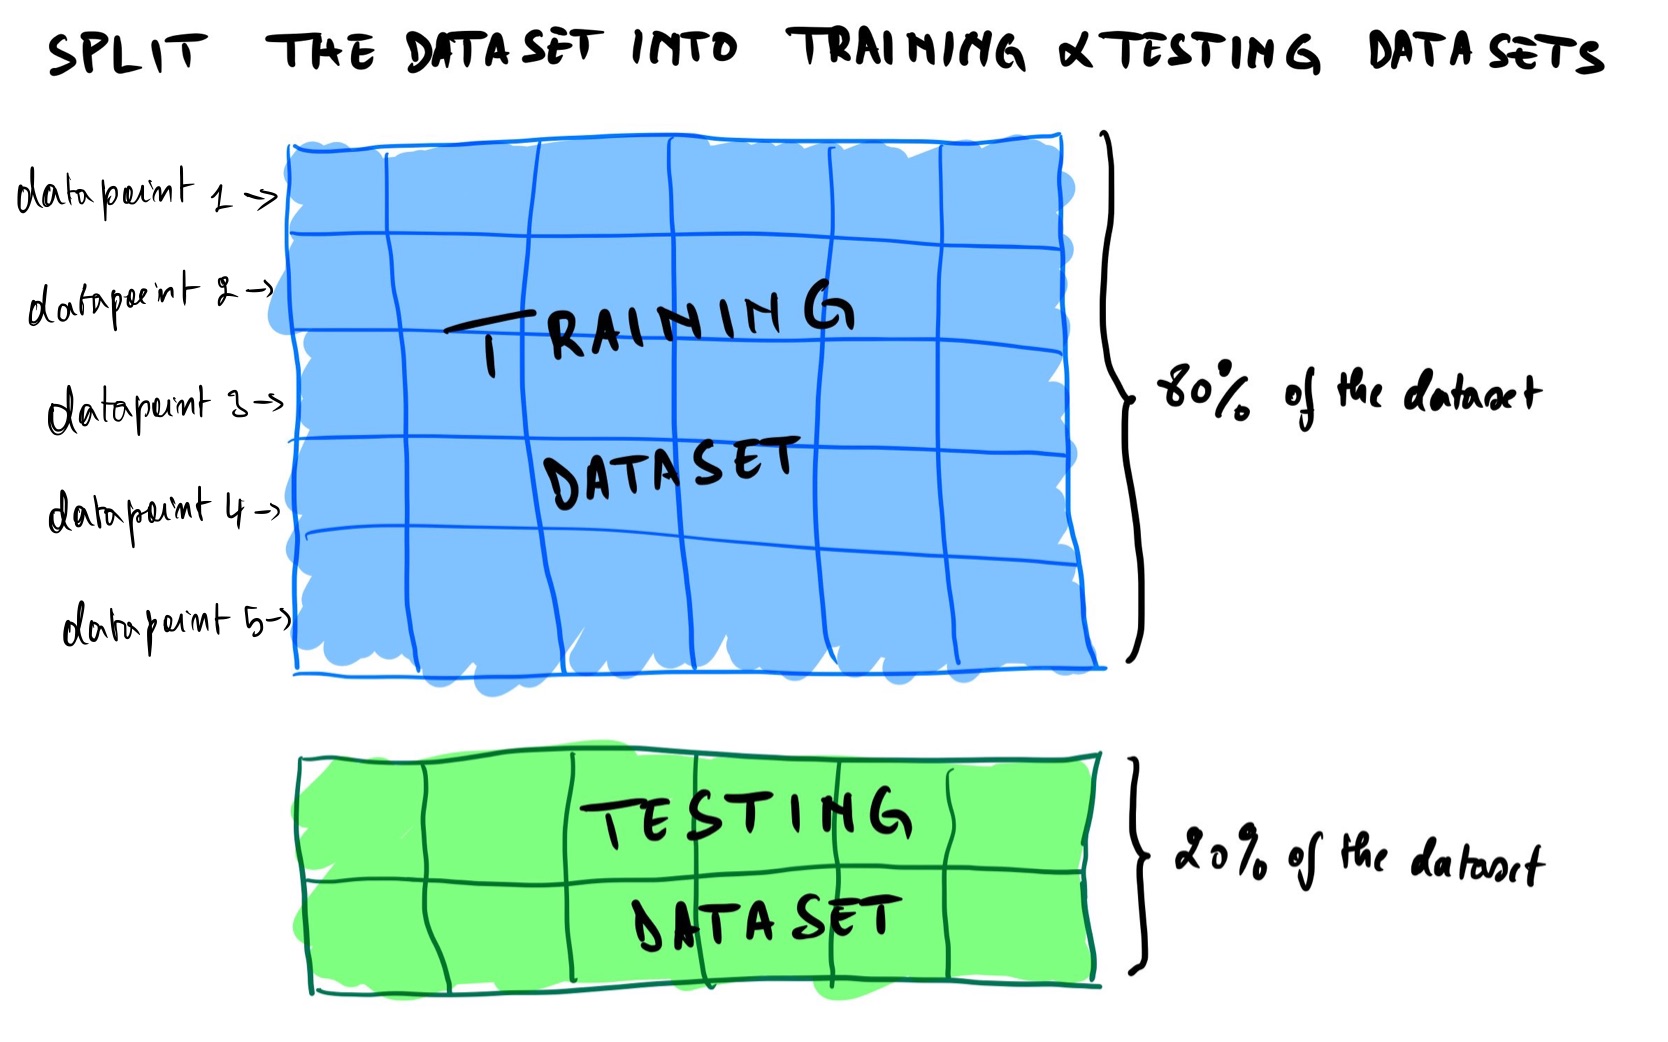
<p>Now we will split the <code class="language-plaintext highlighter-rouge">cc_data_full_data</code> into a training and testing set. We will use 80% of the data for training and 20% for testing and store them respectively in <code class="language-plaintext highlighter-rouge">cc_train_original</code> and <code class="language-plaintext highlighter-rouge">cc_test_original</code> variables.</p>

<div class="language-python highlighter-rouge"><div class="highlight"><pre class="highlight"><code><span class="c1"># split the data into train and test dataset
</span><span class="k">def</span> <span class="nf">data_split</span><span class="p">(</span><span class="n">df</span><span class="p">,</span> <span class="n">test_size</span><span class="p">):</span>
    <span class="n">train_df</span><span class="p">,</span> <span class="n">test_df</span> <span class="o">=</span> <span class="n">train_test_split</span><span class="p">(</span><span class="n">df</span><span class="p">,</span> <span class="n">test_size</span><span class="o">=</span><span class="n">test_size</span><span class="p">,</span> <span class="n">random_state</span><span class="o">=</span><span class="mi">42</span><span class="p">)</span>
    <span class="c1"># reset the indexes
</span>    <span class="k">return</span> <span class="n">train_df</span><span class="p">.</span><span class="n">reset_index</span><span class="p">(</span><span class="n">drop</span><span class="o">=</span><span class="bp">True</span><span class="p">),</span> <span class="n">test_df</span><span class="p">.</span><span class="n">reset_index</span><span class="p">(</span><span class="n">drop</span><span class="o">=</span><span class="bp">True</span><span class="p">)</span>
</code></pre></div></div>

<div class="language-python highlighter-rouge"><div class="highlight"><pre class="highlight"><code><span class="c1"># we set the test_size to 0.2, which means that the train_size will be 0.8
</span><span class="n">cc_train_original</span><span class="p">,</span> <span class="n">cc_test_original</span> <span class="o">=</span> <span class="n">data_split</span><span class="p">(</span><span class="n">cc_data_full_data</span><span class="p">,</span> <span class="mf">0.2</span><span class="p">)</span>
</code></pre></div></div>

<p>Dataframe’s <code class="language-plaintext highlighter-rouge">shape</code> function helps us know the dimension of the dataframe. Here we have 20 features(columns) and 29165 observations(rows) for the training dataset.</p>

<div class="language-python highlighter-rouge"><div class="highlight"><pre class="highlight"><code><span class="n">cc_train_original</span><span class="p">.</span><span class="n">shape</span>
</code></pre></div></div>

<div class="language-plaintext highlighter-rouge"><div class="highlight"><pre class="highlight"><code>(29165, 20)
</code></pre></div></div>

<p>And 20 features(columns) and 7292 observations(rows) for the testing dataset.</p>

<div class="language-python highlighter-rouge"><div class="highlight"><pre class="highlight"><code><span class="n">cc_test_original</span><span class="p">.</span><span class="n">shape</span>
</code></pre></div></div>

<div class="language-plaintext highlighter-rouge"><div class="highlight"><pre class="highlight"><code>(7292, 20)
</code></pre></div></div>

<p>Finally, we will export the data as a CSV file on our local machine and create a copy of the dataset. Please note that these steps are optional. It is best practice to keep the original dataset untouched as a backup and work with the copy.</p>

<div class="language-python highlighter-rouge"><div class="highlight"><pre class="highlight"><code><span class="n">cc_train_original</span><span class="p">.</span><span class="n">to_csv</span><span class="p">(</span><span class="s">'dataset/train.csv'</span><span class="p">,</span><span class="n">index</span><span class="o">=</span><span class="bp">False</span><span class="p">)</span>
</code></pre></div></div>

<div class="language-python highlighter-rouge"><div class="highlight"><pre class="highlight"><code><span class="n">cc_test_original</span><span class="p">.</span><span class="n">to_csv</span><span class="p">(</span><span class="s">'dataset/test.csv'</span><span class="p">,</span><span class="n">index</span><span class="o">=</span><span class="bp">False</span><span class="p">)</span>
</code></pre></div></div>

<div class="language-python highlighter-rouge"><div class="highlight"><pre class="highlight"><code><span class="c1"># creating a copy of the dataset so that the original stays untouched
</span><span class="n">cc_train_copy</span> <span class="o">=</span> <span class="n">cc_train_original</span><span class="p">.</span><span class="n">copy</span><span class="p">()</span>
<span class="n">cc_test_copy</span> <span class="o">=</span> <span class="n">cc_test_original</span><span class="p">.</span><span class="n">copy</span><span class="p">()</span>
</code></pre></div></div>

<h3>Data at a glance</h3>

<p>Now that we have split the dataset into training and testing datasets, we will focus on the training dataset for now and use the test dataset toward the end of this post.</p>

<p>Let’s review the first 5 rows again with the <code class="language-plaintext highlighter-rouge">head()</code> function.</p>

<div class="language-python highlighter-rouge"><div class="highlight"><pre class="highlight"><code><span class="n">cc_data_full_data</span><span class="p">.</span><span class="n">head</span><span class="p">()</span>
</code></pre></div></div>

<div>
<style scoped="">
    .dataframe tbody tr th:only-of-type {
        vertical-align: middle;
    }

    .dataframe tbody tr th {
        vertical-align: top;
    }

    .dataframe thead th {
        text-align: right;
    }
</style>
<table border="1" class="dataframe">
  <thead>
    <tr style="text-align: right;">
      <th></th>
      <th>ID</th>
      <th>Gender</th>
      <th>Has a car</th>
      <th>Has a property</th>
      <th>Children count</th>
      <th>Income</th>
      <th>Employment status</th>
      <th>Education level</th>
      <th>Marital status</th>
      <th>Dwelling</th>
      <th>Age</th>
      <th>Employment length</th>
      <th>Has a mobile phone</th>
      <th>Has a work phone</th>
      <th>Has a phone</th>
      <th>Has an email</th>
      <th>Job title</th>
      <th>Family member count</th>
      <th>Account age</th>
      <th>Is high risk</th>
    </tr>
  </thead>
  <tbody>
    <tr>
      <th>0</th>
      <td>5008804</td>
      <td>M</td>
      <td>Y</td>
      <td>Y</td>
      <td>0</td>
      <td>427500.0</td>
      <td>Working</td>
      <td>Higher education</td>
      <td>Civil marriage</td>
      <td>Rented apartment</td>
      <td>-12005</td>
      <td>-4542</td>
      <td>1</td>
      <td>1</td>
      <td>0</td>
      <td>0</td>
      <td>NaN</td>
      <td>2.0</td>
      <td>-15.0</td>
      <td>0</td>
    </tr>
    <tr>
      <th>1</th>
      <td>5008805</td>
      <td>M</td>
      <td>Y</td>
      <td>Y</td>
      <td>0</td>
      <td>427500.0</td>
      <td>Working</td>
      <td>Higher education</td>
      <td>Civil marriage</td>
      <td>Rented apartment</td>
      <td>-12005</td>
      <td>-4542</td>
      <td>1</td>
      <td>1</td>
      <td>0</td>
      <td>0</td>
      <td>NaN</td>
      <td>2.0</td>
      <td>-14.0</td>
      <td>0</td>
    </tr>
    <tr>
      <th>2</th>
      <td>5008806</td>
      <td>M</td>
      <td>Y</td>
      <td>Y</td>
      <td>0</td>
      <td>112500.0</td>
      <td>Working</td>
      <td>Secondary / secondary special</td>
      <td>Married</td>
      <td>House / apartment</td>
      <td>-21474</td>
      <td>-1134</td>
      <td>1</td>
      <td>0</td>
      <td>0</td>
      <td>0</td>
      <td>Security staff</td>
      <td>2.0</td>
      <td>-29.0</td>
      <td>0</td>
    </tr>
    <tr>
      <th>3</th>
      <td>5008808</td>
      <td>F</td>
      <td>N</td>
      <td>Y</td>
      <td>0</td>
      <td>270000.0</td>
      <td>Commercial associate</td>
      <td>Secondary / secondary special</td>
      <td>Single / not married</td>
      <td>House / apartment</td>
      <td>-19110</td>
      <td>-3051</td>
      <td>1</td>
      <td>0</td>
      <td>1</td>
      <td>1</td>
      <td>Sales staff</td>
      <td>1.0</td>
      <td>-4.0</td>
      <td>0</td>
    </tr>
    <tr>
      <th>4</th>
      <td>5008809</td>
      <td>F</td>
      <td>N</td>
      <td>Y</td>
      <td>0</td>
      <td>270000.0</td>
      <td>Commercial associate</td>
      <td>Secondary / secondary special</td>
      <td>Single / not married</td>
      <td>House / apartment</td>
      <td>-19110</td>
      <td>-3051</td>
      <td>1</td>
      <td>0</td>
      <td>1</td>
      <td>1</td>
      <td>Sales staff</td>
      <td>1.0</td>
      <td>-26.0</td>
      <td>0</td>
    </tr>
  </tbody>
</table>
</div>

<p>Now let’s see the data types of each of the features with the <code class="language-plaintext highlighter-rouge">info()</code> function.</p>

<div class="language-python highlighter-rouge"><div class="highlight"><pre class="highlight"><code><span class="n">cc_data_full_data</span><span class="p">.</span><span class="n">info</span><span class="p">()</span>
</code></pre></div></div>

<div class="language-plaintext highlighter-rouge"><div class="highlight"><pre class="highlight"><code>&lt;class 'pandas.core.frame.DataFrame'&gt;
Int64Index: 36457 entries, 0 to 36456
Data columns (total 20 columns):
 #   Column               Non-Null Count  Dtype  
---  ------               --------------  -----  
 0   ID                   36457 non-null  int64  
 1   Gender               36457 non-null  object 
 2   Has a car            36457 non-null  object 
 3   Has a property       36457 non-null  object 
 4   Children count       36457 non-null  int64  
 5   Income               36457 non-null  float64
 6   Employment status    36457 non-null  object 
 7   Education level      36457 non-null  object 
 8   Marital status       36457 non-null  object 
 9   Dwelling             36457 non-null  object 
 10  Age                  36457 non-null  int64  
 11  Employment length    36457 non-null  int64  
 12  Has a mobile phone   36457 non-null  int64  
 13  Has a work phone     36457 non-null  int64  
 14  Has a phone          36457 non-null  int64  
 15  Has an email         36457 non-null  int64  
 16  Job title            25134 non-null  object 
 17  Family member count  36457 non-null  float64
 18  Account age          36457 non-null  float64
 19  Is high risk         36457 non-null  object 
dtypes: float64(3), int64(8), object(9)
memory usage: 5.8+ MB
</code></pre></div></div>

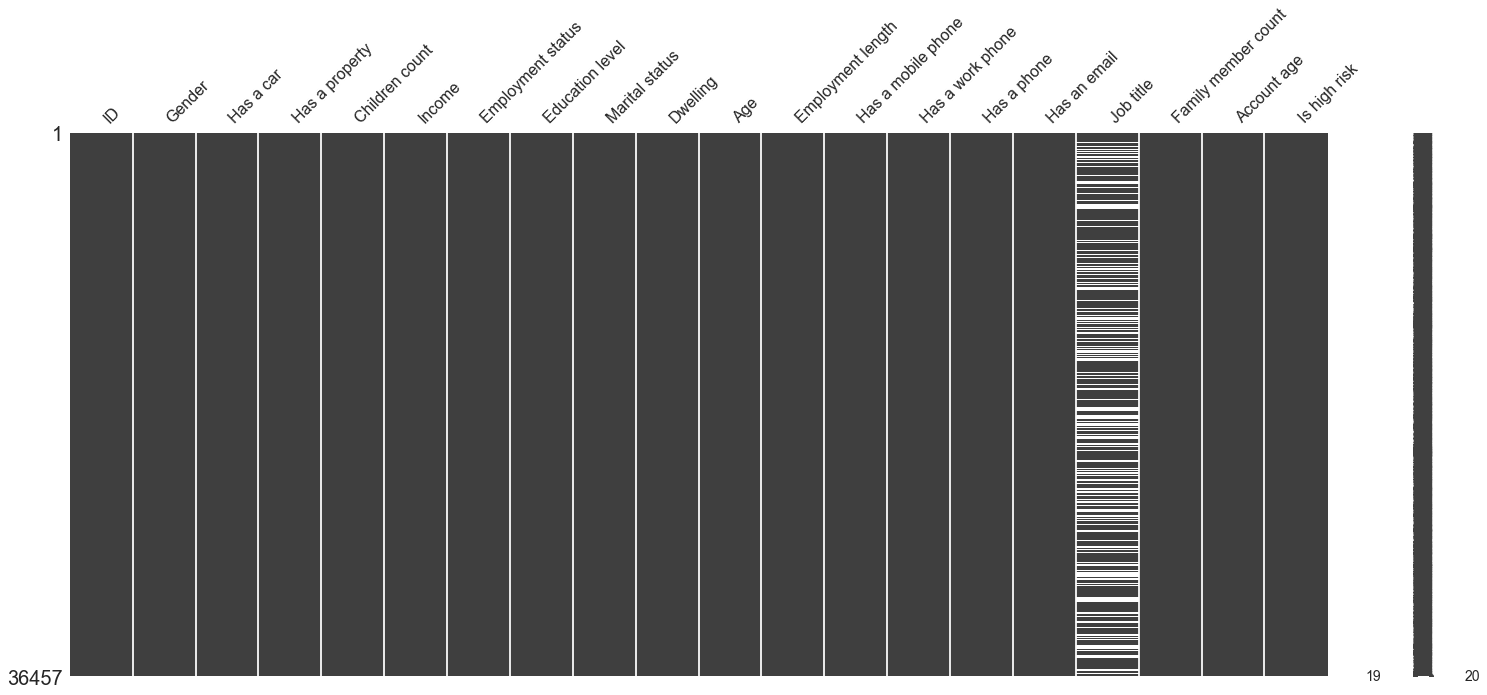
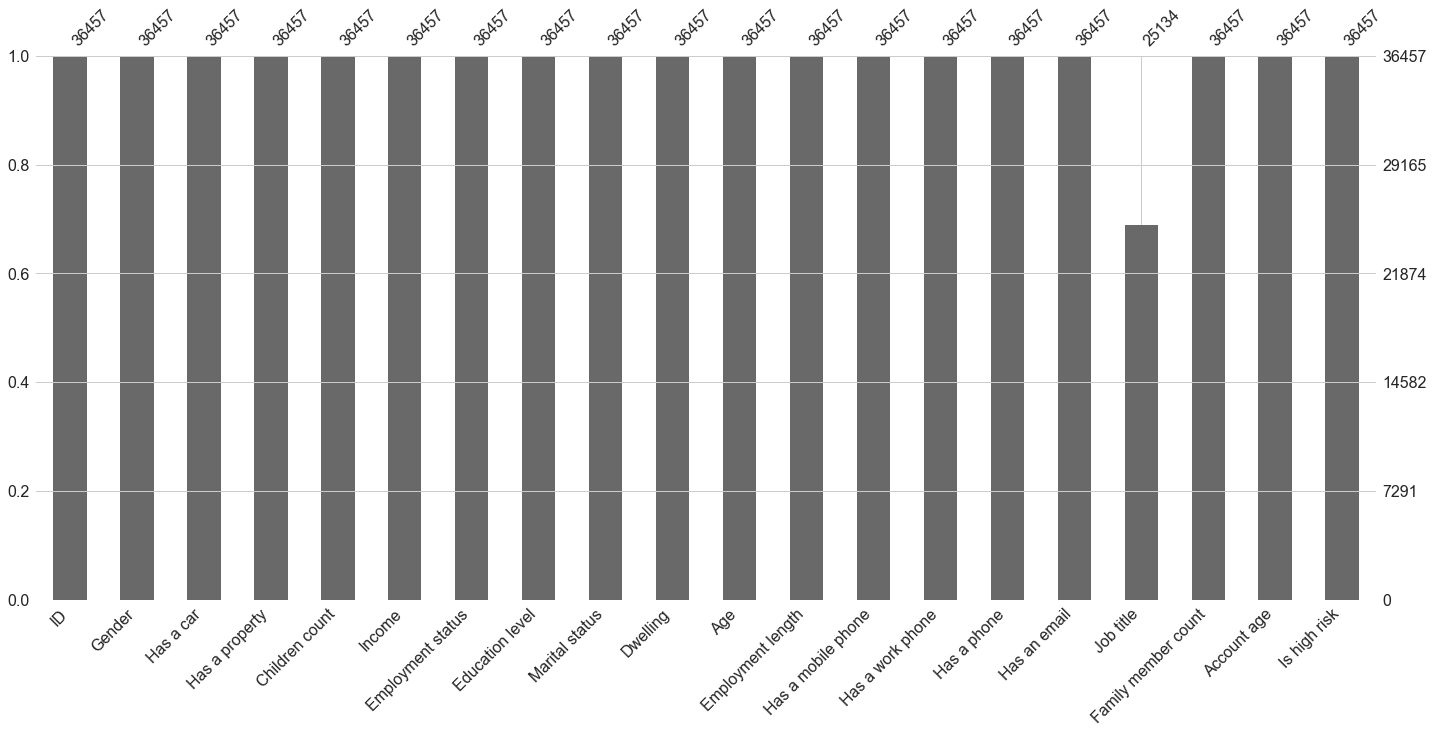
<p>Let’s digest the information above. The first column is the indexes of the features; the second is the names; the third is the count of non-null values(only the job title has missing values); and the fourth is datatypes (objects which mean strings datatype, float or integer).</p>

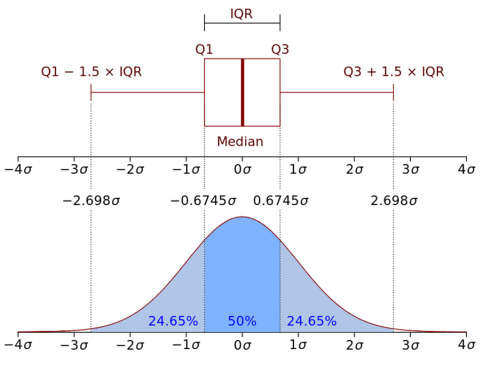
<p>The <code class="language-plaintext highlighter-rouge">describe()</code> function gives us statistics about the numerical features in the dataset. These statistics include each numerical feature’s count, mean, standard deviation, interquartile range(25%, 50%, 75%), and minimum and maximum values.</p>

<div class="language-python highlighter-rouge"><div class="highlight"><pre class="highlight"><code><span class="n">cc_data_full_data</span><span class="p">.</span><span class="n">describe</span><span class="p">()</span>
</code></pre></div></div>

<div>
<style scoped="">
    .dataframe tbody tr th:only-of-type {
        vertical-align: middle;
    }

    .dataframe tbody tr th {
        vertical-align: top;
    }

    .dataframe thead th {
        text-align: right;
    }
</style>
<table border="1" class="dataframe">
  <thead>
    <tr style="text-align: right;">
      <th></th>
      <th>ID</th>
      <th>Children count</th>
      <th>Income</th>
      <th>Age</th>
      <th>Employment length</th>
      <th>Has a mobile phone</th>
      <th>Has a work phone</th>
      <th>Has a phone</th>
      <th>Has an email</th>
      <th>Family member count</th>
      <th>Account age</th>
    </tr>
  </thead>
  <tbody>
    <tr>
      <th>count</th>
      <td>3.645700e+04</td>
      <td>36457.000000</td>
      <td>3.645700e+04</td>
      <td>36457.000000</td>
      <td>36457.000000</td>
      <td>36457.0</td>
      <td>36457.000000</td>
      <td>36457.000000</td>
      <td>36457.000000</td>
      <td>36457.000000</td>
      <td>36457.000000</td>
    </tr>
    <tr>
      <th>mean</th>
      <td>5.078227e+06</td>
      <td>0.430315</td>
      <td>1.866857e+05</td>
      <td>-15975.173382</td>
      <td>59262.935568</td>
      <td>1.0</td>
      <td>0.225526</td>
      <td>0.294813</td>
      <td>0.089722</td>
      <td>2.198453</td>
      <td>-26.164193</td>
    </tr>
    <tr>
      <th>std</th>
      <td>4.187524e+04</td>
      <td>0.742367</td>
      <td>1.017892e+05</td>
      <td>4200.549944</td>
      <td>137651.334859</td>
      <td>0.0</td>
      <td>0.417934</td>
      <td>0.455965</td>
      <td>0.285787</td>
      <td>0.911686</td>
      <td>16.501854</td>
    </tr>
    <tr>
      <th>min</th>
      <td>5.008804e+06</td>
      <td>0.000000</td>
      <td>2.700000e+04</td>
      <td>-25152.000000</td>
      <td>-15713.000000</td>
      <td>1.0</td>
      <td>0.000000</td>
      <td>0.000000</td>
      <td>0.000000</td>
      <td>1.000000</td>
      <td>-60.000000</td>
    </tr>
    <tr>
      <th>25%</th>
      <td>5.042028e+06</td>
      <td>0.000000</td>
      <td>1.215000e+05</td>
      <td>-19438.000000</td>
      <td>-3153.000000</td>
      <td>1.0</td>
      <td>0.000000</td>
      <td>0.000000</td>
      <td>0.000000</td>
      <td>2.000000</td>
      <td>-39.000000</td>
    </tr>
    <tr>
      <th>50%</th>
      <td>5.074614e+06</td>
      <td>0.000000</td>
      <td>1.575000e+05</td>
      <td>-15563.000000</td>
      <td>-1552.000000</td>
      <td>1.0</td>
      <td>0.000000</td>
      <td>0.000000</td>
      <td>0.000000</td>
      <td>2.000000</td>
      <td>-24.000000</td>
    </tr>
    <tr>
      <th>75%</th>
      <td>5.115396e+06</td>
      <td>1.000000</td>
      <td>2.250000e+05</td>
      <td>-12462.000000</td>
      <td>-408.000000</td>
      <td>1.0</td>
      <td>0.000000</td>
      <td>1.000000</td>
      <td>0.000000</td>
      <td>3.000000</td>
      <td>-12.000000</td>
    </tr>
    <tr>
      <th>max</th>
      <td>5.150487e+06</td>
      <td>19.000000</td>
      <td>1.575000e+06</td>
      <td>-7489.000000</td>
      <td>365243.000000</td>
      <td>1.0</td>
      <td>1.000000</td>
      <td>1.000000</td>
      <td>1.000000</td>
      <td>20.000000</td>
      <td>0.000000</td>
    </tr>
  </tbody>
</table>
</div>

<p>We will use the <a href="https://github.com/ResidentMario/missingno">Missingno</a> to visualize the missing values per feature using its <code class="language-plaintext highlighter-rouge">matrix</code> function.</p>

<div class="language-python highlighter-rouge"><div class="highlight"><pre class="highlight"><code><span class="n">msno</span><span class="p">.</span><span class="n">matrix</span><span class="p">(</span><span class="n">cc_data_full_data</span><span class="p">)</span>
<span class="n">plt</span><span class="p">.</span><span class="n">show</span><span class="p">()</span>
</code></pre></div></div>

<p><img src="/blog/assets/post_cont_image/output_52_0.png" alt="png" /></p>

<p>Here we can see that the Job title is the only feature with missing values. Slim white lines represent missing values.</p>

<p>To see a clear representation of the missing values count, we can use its <code class="language-plaintext highlighter-rouge">bar()</code> function to have a barplot with the count of non-null values.</p>

<div class="language-python highlighter-rouge"><div class="highlight"><pre class="highlight"><code><span class="n">msno</span><span class="p">.</span><span class="n">bar</span><span class="p">(</span><span class="n">cc_data_full_data</span><span class="p">)</span>
<span class="n">plt</span><span class="p">.</span><span class="n">show</span><span class="p">()</span>
</code></pre></div></div>

<p><img src="/blog/assets/post_cont_image/output_55_0.png" alt="png" /></p>

<p>Now we will create functions to analyze each feature(Univariate analysis). Don’t worry too much about understanding these functions, as we will see how they are used during the exploratory data analysis section.</p>

<p>Our first function <code class="language-plaintext highlighter-rouge">value_cnt_norm_cal</code> is used to calculate the count of each class in a feature with its frequency (normalized on a scale of 100)</p>

<div class="language-python highlighter-rouge"><div class="highlight"><pre class="highlight"><code><span class="k">def</span> <span class="nf">value_cnt_norm_cal</span><span class="p">(</span><span class="n">df</span><span class="p">,</span><span class="n">feature</span><span class="p">):</span>
    <span class="s">'''Function that will return the value count and frequency of each observation within a feature'''</span>
    <span class="c1"># get the value counts of each feature
</span>    <span class="n">ftr_value_cnt</span> <span class="o">=</span> <span class="n">df</span><span class="p">[</span><span class="n">feature</span><span class="p">].</span><span class="n">value_counts</span><span class="p">()</span>
    <span class="c1"># normalize the value counts on a scale of 100
</span>    <span class="n">ftr_value_cnt_norm</span> <span class="o">=</span> <span class="n">df</span><span class="p">[</span><span class="n">feature</span><span class="p">].</span><span class="n">value_counts</span><span class="p">(</span><span class="n">normalize</span><span class="o">=</span><span class="bp">True</span><span class="p">)</span> <span class="o">*</span> <span class="mi">100</span>
    <span class="c1"># concatenate the value counts with normalized value count column wise
</span>    <span class="n">ftr_value_cnt_concat</span> <span class="o">=</span> <span class="n">pd</span><span class="p">.</span><span class="n">concat</span><span class="p">([</span><span class="n">ftr_value_cnt</span><span class="p">,</span> <span class="n">ftr_value_cnt_norm</span><span class="p">],</span> <span class="n">axis</span><span class="o">=</span><span class="mi">1</span><span class="p">)</span>
    <span class="c1"># give it a column name
</span>    <span class="n">ftr_value_cnt_concat</span><span class="p">.</span><span class="n">columns</span> <span class="o">=</span> <span class="p">[</span><span class="s">'Count'</span><span class="p">,</span> <span class="s">'Frequency (%)'</span><span class="p">]</span>
    <span class="c1"># return the dataframe
</span>    <span class="k">return</span> <span class="n">ftr_value_cnt_concat</span>
</code></pre></div></div>

<p><code class="language-plaintext highlighter-rouge">gen_info_feat</code> returned the description, the datatype, statistics, the value counts and frequencies</p>

<p>Note: I have used the if statement to handle features differently depending on their data type and characteristics. For example, I divided age by 365.25 and changed it to a positive value because it is expressed in days instead of years. Same as employment length; however, we did not print the value count for account age.</p>

<div class="language-python highlighter-rouge"><div class="highlight"><pre class="highlight"><code><span class="k">def</span> <span class="nf">gen_info_feat</span><span class="p">(</span><span class="n">df</span><span class="p">,</span><span class="n">feature</span><span class="p">):</span>
    <span class="s">'''function to display general information about the feature'''</span>
    <span class="c1"># if the feature is Age
</span>    <span class="k">if</span> <span class="n">feature</span> <span class="o">==</span> <span class="s">'Age'</span><span class="p">:</span>
        <span class="c1"># change the feature to be expressed in positive numbers of days and divide by 365.25 to be expressed in years and get the description
</span>        <span class="k">print</span><span class="p">(</span><span class="s">'Description:</span><span class="se">\n</span><span class="s">{}'</span><span class="p">.</span><span class="nb">format</span><span class="p">((</span><span class="n">np</span><span class="p">.</span><span class="nb">abs</span><span class="p">(</span><span class="n">df</span><span class="p">[</span><span class="n">feature</span><span class="p">])</span><span class="o">/</span><span class="mf">365.25</span><span class="p">).</span><span class="n">describe</span><span class="p">()))</span>
        <span class="c1"># print separators
</span>        <span class="k">print</span><span class="p">(</span><span class="s">'*'</span><span class="o">*</span><span class="mi">50</span><span class="p">)</span>
        <span class="c1"># print the datatype
</span>        <span class="k">print</span><span class="p">(</span><span class="s">'Object type:{}'</span><span class="p">.</span><span class="nb">format</span><span class="p">(</span><span class="n">df</span><span class="p">[</span><span class="n">feature</span><span class="p">].</span><span class="n">dtype</span><span class="p">))</span>
    <span class="c1"># if the feature is employment length
</span>    <span class="k">if</span> <span class="n">feature</span> <span class="o">==</span> <span class="s">'Employment length'</span><span class="p">:</span>
        <span class="c1"># select only the rows where the rows are negative values to ignore those who have retired or are unemployed
</span>        <span class="n">employment_len_no_ret</span> <span class="o">=</span> <span class="n">cc_train_copy</span><span class="p">[</span><span class="s">'Employment length'</span><span class="p">][</span><span class="n">cc_train_copy</span><span class="p">[</span><span class="s">'Employment length'</span><span class="p">]</span> <span class="o">&lt;</span> <span class="mi">0</span><span class="p">]</span>
        <span class="c1"># change the negative values to positive values
</span>        <span class="n">employment_len_no_ret_yrs</span> <span class="o">=</span> <span class="n">np</span><span class="p">.</span><span class="nb">abs</span><span class="p">(</span><span class="n">employment_len_no_ret</span><span class="p">)</span><span class="o">/</span><span class="mf">365.25</span>
        <span class="c1"># print the descriptions
</span>        <span class="k">print</span><span class="p">(</span><span class="s">'Description:</span><span class="se">\n</span><span class="s">{}'</span><span class="p">.</span><span class="nb">format</span><span class="p">((</span><span class="n">employment_len_no_ret_yrs</span><span class="p">).</span><span class="n">describe</span><span class="p">()))</span>
        <span class="c1"># print separators
</span>        <span class="k">print</span><span class="p">(</span><span class="s">'*'</span><span class="o">*</span><span class="mi">50</span><span class="p">)</span>
        <span class="c1"># print the datatype
</span>        <span class="k">print</span><span class="p">(</span><span class="s">'Object type:{}'</span><span class="p">.</span><span class="nb">format</span><span class="p">(</span><span class="n">employment_len_no_ret</span><span class="p">.</span><span class="n">dtype</span><span class="p">))</span>
    <span class="c1"># if the feature is account age
</span>    <span class="k">if</span> <span class="n">feature</span> <span class="o">==</span> <span class="s">'Account age'</span> <span class="ow">or</span> <span class="n">feature</span> <span class="o">==</span> <span class="s">'Income'</span><span class="p">:</span>
        <span class="c1"># change the account age to a positive number of months and get the description
</span>        <span class="k">print</span><span class="p">(</span><span class="s">'Description:</span><span class="se">\n</span><span class="s">{}'</span><span class="p">.</span><span class="nb">format</span><span class="p">((</span><span class="n">np</span><span class="p">.</span><span class="nb">abs</span><span class="p">(</span><span class="n">df</span><span class="p">[</span><span class="n">feature</span><span class="p">])).</span><span class="n">describe</span><span class="p">()))</span>
        <span class="c1"># print separators
</span>        <span class="k">print</span><span class="p">(</span><span class="s">'*'</span><span class="o">*</span><span class="mi">50</span><span class="p">)</span>
        <span class="c1"># print the datatype
</span>        <span class="k">print</span><span class="p">(</span><span class="s">'Object type:{}'</span><span class="p">.</span><span class="nb">format</span><span class="p">(</span><span class="n">df</span><span class="p">[</span><span class="n">feature</span><span class="p">].</span><span class="n">dtype</span><span class="p">))</span>
    <span class="c1"># if it is any other feature
</span>    <span class="k">else</span><span class="p">:</span>
        <span class="c1"># get the description
</span>        <span class="k">print</span><span class="p">(</span><span class="s">'Description:</span><span class="se">\n</span><span class="s">{}'</span><span class="p">.</span><span class="nb">format</span><span class="p">(</span><span class="n">df</span><span class="p">[</span><span class="n">feature</span><span class="p">].</span><span class="n">describe</span><span class="p">()))</span>
        <span class="c1"># print separators
</span>        <span class="k">print</span><span class="p">(</span><span class="s">'*'</span><span class="o">*</span><span class="mi">50</span><span class="p">)</span>
        <span class="c1"># print the datatype
</span>        <span class="k">print</span><span class="p">(</span><span class="s">'Object type:</span><span class="se">\n</span><span class="s">{}'</span><span class="p">.</span><span class="nb">format</span><span class="p">(</span><span class="n">df</span><span class="p">[</span><span class="n">feature</span><span class="p">].</span><span class="n">dtype</span><span class="p">))</span>
        <span class="c1"># print separators
</span>        <span class="k">print</span><span class="p">(</span><span class="s">'*'</span><span class="o">*</span><span class="mi">50</span><span class="p">)</span>
        <span class="c1"># calling the value_cnt_norm_cal function previously seen
</span>        <span class="n">value_cnt</span> <span class="o">=</span> <span class="n">value_cnt_norm_cal</span><span class="p">(</span><span class="n">df</span><span class="p">,</span><span class="n">feature</span><span class="p">)</span>
        <span class="c1"># print the result
</span>        <span class="k">print</span><span class="p">(</span><span class="s">'Value count:</span><span class="se">\n</span><span class="s">{}'</span><span class="p">.</span><span class="nb">format</span><span class="p">(</span><span class="n">value_cnt</span><span class="p">))</span>

</code></pre></div></div>

<p>The following function prints a pie chart.</p>

<div class="language-python highlighter-rouge"><div class="highlight"><pre class="highlight"><code><span class="k">def</span> <span class="nf">create_pie_plot</span><span class="p">(</span><span class="n">df</span><span class="p">,</span><span class="n">feature</span><span class="p">):</span>
    <span class="s">'''function to create a pie chart plot'''</span>
    <span class="c1"># if the feature is dwelling or education level
</span>    <span class="k">if</span> <span class="n">feature</span> <span class="o">==</span> <span class="s">'Dwelling'</span> <span class="ow">or</span> <span class="n">feature</span> <span class="o">==</span> <span class="s">'Education level'</span><span class="p">:</span>
        <span class="c1"># calling the value_cnt_norm_cal function previously seen
</span>        <span class="n">ratio_size</span> <span class="o">=</span> <span class="n">value_cnt_norm_cal</span><span class="p">(</span><span class="n">df</span><span class="p">,</span> <span class="n">feature</span><span class="p">)</span>
        <span class="c1"># get how many classes we have
</span>        <span class="n">ratio_size_len</span> <span class="o">=</span> <span class="nb">len</span><span class="p">(</span><span class="n">ratio_size</span><span class="p">.</span><span class="n">index</span><span class="p">)</span>
        <span class="n">ratio_list</span> <span class="o">=</span> <span class="p">[]</span>
        <span class="c1"># loop till the max range
</span>        <span class="k">for</span> <span class="n">i</span> <span class="ow">in</span> <span class="nb">range</span><span class="p">(</span><span class="n">ratio_size_len</span><span class="p">):</span>
            <span class="c1">#append the ratio of each feature to the list
</span>            <span class="n">ratio_list</span><span class="p">.</span><span class="n">append</span><span class="p">(</span><span class="n">ratio_size</span><span class="p">.</span><span class="n">iloc</span><span class="p">[</span><span class="n">i</span><span class="p">][</span><span class="s">'Frequency (%)'</span><span class="p">])</span>
        <span class="c1"># create a subplot
</span>        <span class="n">fig</span><span class="p">,</span> <span class="n">ax</span> <span class="o">=</span> <span class="n">plt</span><span class="p">.</span><span class="n">subplots</span><span class="p">(</span><span class="n">figsize</span><span class="o">=</span><span class="p">(</span><span class="mi">8</span><span class="p">,</span><span class="mi">8</span><span class="p">))</span>
        <span class="c1"># %1.2f%% display decimals in the pie chart with 2 decimal places
</span>        <span class="n">plt</span><span class="p">.</span><span class="n">pie</span><span class="p">(</span><span class="n">ratio_list</span><span class="p">,</span> <span class="n">startangle</span><span class="o">=</span><span class="mi">90</span><span class="p">,</span> <span class="n">wedgeprops</span><span class="o">=</span><span class="p">{</span><span class="s">'edgecolor'</span> <span class="p">:</span><span class="s">'black'</span><span class="p">})</span>
        <span class="c1"># add a title to the chart
</span>        <span class="n">plt</span><span class="p">.</span><span class="n">title</span><span class="p">(</span><span class="s">'Pie chart of {}'</span><span class="p">.</span><span class="nb">format</span><span class="p">(</span><span class="n">feature</span><span class="p">))</span>
        <span class="c1"># add a legend to the chart
</span>        <span class="n">plt</span><span class="p">.</span><span class="n">legend</span><span class="p">(</span><span class="n">loc</span><span class="o">=</span><span class="s">'best'</span><span class="p">,</span><span class="n">labels</span><span class="o">=</span><span class="n">ratio_size</span><span class="p">.</span><span class="n">index</span><span class="p">)</span>
        <span class="c1"># center the plot in the subplot
</span>        <span class="n">plt</span><span class="p">.</span><span class="n">axis</span><span class="p">(</span><span class="s">'equal'</span><span class="p">)</span>

        <span class="c1"># return the plot
</span>        <span class="k">return</span> <span class="n">plt</span><span class="p">.</span><span class="n">show</span><span class="p">()</span>
    <span class="c1"># for other features
</span>    <span class="k">else</span><span class="p">:</span>
        <span class="n">ratio_size</span> <span class="o">=</span> <span class="n">value_cnt_norm_cal</span><span class="p">(</span><span class="n">df</span><span class="p">,</span> <span class="n">feature</span><span class="p">)</span>
        <span class="n">ratio_size_len</span> <span class="o">=</span> <span class="nb">len</span><span class="p">(</span><span class="n">ratio_size</span><span class="p">.</span><span class="n">index</span><span class="p">)</span>
        <span class="n">ratio_list</span> <span class="o">=</span> <span class="p">[]</span>
        <span class="k">for</span> <span class="n">i</span> <span class="ow">in</span> <span class="nb">range</span><span class="p">(</span><span class="n">ratio_size_len</span><span class="p">):</span>
            <span class="n">ratio_list</span><span class="p">.</span><span class="n">append</span><span class="p">(</span><span class="n">ratio_size</span><span class="p">.</span><span class="n">iloc</span><span class="p">[</span><span class="n">i</span><span class="p">][</span><span class="s">'Frequency (%)'</span><span class="p">])</span>
        <span class="n">fig</span><span class="p">,</span> <span class="n">ax</span> <span class="o">=</span> <span class="n">plt</span><span class="p">.</span><span class="n">subplots</span><span class="p">(</span><span class="n">figsize</span><span class="o">=</span><span class="p">(</span><span class="mi">8</span><span class="p">,</span><span class="mi">8</span><span class="p">))</span>
        <span class="c1"># %1.2f%% display decimals in the pie chart with 2 decimal places
</span>        <span class="n">plt</span><span class="p">.</span><span class="n">pie</span><span class="p">(</span><span class="n">ratio_list</span><span class="p">,</span> <span class="n">labels</span><span class="o">=</span><span class="n">ratio_size</span><span class="p">.</span><span class="n">index</span><span class="p">,</span> <span class="n">autopct</span><span class="o">=</span><span class="s">'%1.2f%%'</span><span class="p">,</span> <span class="n">startangle</span><span class="o">=</span><span class="mi">90</span><span class="p">,</span> <span class="n">wedgeprops</span><span class="o">=</span><span class="p">{</span><span class="s">'edgecolor'</span> <span class="p">:</span><span class="s">'black'</span><span class="p">})</span>
        <span class="n">plt</span><span class="p">.</span><span class="n">title</span><span class="p">(</span><span class="s">'Pie chart of {}'</span><span class="p">.</span><span class="nb">format</span><span class="p">(</span><span class="n">feature</span><span class="p">))</span>
        <span class="n">plt</span><span class="p">.</span><span class="n">legend</span><span class="p">(</span><span class="n">loc</span><span class="o">=</span><span class="s">'best'</span><span class="p">)</span>
        <span class="n">plt</span><span class="p">.</span><span class="n">axis</span><span class="p">(</span><span class="s">'equal'</span><span class="p">)</span>
        <span class="k">return</span> <span class="n">plt</span><span class="p">.</span><span class="n">show</span><span class="p">()</span>
</code></pre></div></div>

<p>The next function create a bar plot.</p>

<div class="language-python highlighter-rouge"><div class="highlight"><pre class="highlight"><code><span class="k">def</span> <span class="nf">create_bar_plot</span><span class="p">(</span><span class="n">df</span><span class="p">,</span><span class="n">feature</span><span class="p">):</span>
    <span class="s">'''function to create a bar chart plot'''</span>
    <span class="k">if</span> <span class="n">feature</span> <span class="o">==</span> <span class="s">'Marital status'</span> <span class="ow">or</span> <span class="n">feature</span> <span class="o">==</span> <span class="s">'Dwelling'</span> <span class="ow">or</span> <span class="n">feature</span> <span class="o">==</span> <span class="s">'Job title'</span> <span class="ow">or</span> <span class="n">feature</span> <span class="o">==</span> <span class="s">'Employment status'</span> <span class="ow">or</span> <span class="n">feature</span> <span class="o">==</span> <span class="s">'Education level'</span><span class="p">:</span>
        <span class="n">fig</span><span class="p">,</span> <span class="n">ax</span> <span class="o">=</span> <span class="n">plt</span><span class="p">.</span><span class="n">subplots</span><span class="p">(</span><span class="n">figsize</span><span class="o">=</span><span class="p">(</span><span class="mi">6</span><span class="p">,</span><span class="mi">10</span><span class="p">))</span>
        <span class="c1"># create a barplot using seaborn with X-axis the indexes from value_cnt_norm_cal function and Y axis we use the value counts from the same function
</span>        <span class="n">sns</span><span class="p">.</span><span class="n">barplot</span><span class="p">(</span><span class="n">x</span><span class="o">=</span><span class="n">value_cnt_norm_cal</span><span class="p">(</span><span class="n">df</span><span class="p">,</span><span class="n">feature</span><span class="p">).</span><span class="n">index</span><span class="p">,</span><span class="n">y</span><span class="o">=</span><span class="n">value_cnt_norm_cal</span><span class="p">(</span><span class="n">df</span><span class="p">,</span><span class="n">feature</span><span class="p">).</span><span class="n">values</span><span class="p">[:,</span><span class="mi">0</span><span class="p">])</span>
        <span class="c1"># set the plot's tick labels to the index from the value_cnt_norm_cal function, rotate those ticks by 45 degrees
</span>        <span class="n">ax</span><span class="p">.</span><span class="n">set_xticklabels</span><span class="p">(</span><span class="n">labels</span><span class="o">=</span><span class="n">value_cnt_norm_cal</span><span class="p">(</span><span class="n">df</span><span class="p">,</span><span class="n">feature</span><span class="p">).</span><span class="n">index</span><span class="p">,</span><span class="n">rotation</span><span class="o">=</span><span class="mi">45</span><span class="p">,</span><span class="n">ha</span><span class="o">=</span><span class="s">'right'</span><span class="p">)</span>
        <span class="c1"># Give the X-axis the same label as the feature name
</span>        <span class="n">plt</span><span class="p">.</span><span class="n">xlabel</span><span class="p">(</span><span class="s">'{}'</span><span class="p">.</span><span class="nb">format</span><span class="p">(</span><span class="n">feature</span><span class="p">))</span>
        <span class="c1"># Give the Y-axis the label "Count"
</span>        <span class="n">plt</span><span class="p">.</span><span class="n">ylabel</span><span class="p">(</span><span class="s">'Count'</span><span class="p">)</span>
        <span class="c1"># Give the plot a title
</span>        <span class="n">plt</span><span class="p">.</span><span class="n">title</span><span class="p">(</span><span class="s">'{} count'</span><span class="p">.</span><span class="nb">format</span><span class="p">(</span><span class="n">feature</span><span class="p">))</span>
        <span class="c1"># Return the title
</span>        <span class="k">return</span> <span class="n">plt</span><span class="p">.</span><span class="n">show</span><span class="p">()</span>
    <span class="k">else</span><span class="p">:</span>
        <span class="n">fig</span><span class="p">,</span> <span class="n">ax</span> <span class="o">=</span> <span class="n">plt</span><span class="p">.</span><span class="n">subplots</span><span class="p">(</span><span class="n">figsize</span><span class="o">=</span><span class="p">(</span><span class="mi">6</span><span class="p">,</span><span class="mi">10</span><span class="p">))</span>
        <span class="n">sns</span><span class="p">.</span><span class="n">barplot</span><span class="p">(</span><span class="n">x</span><span class="o">=</span><span class="n">value_cnt_norm_cal</span><span class="p">(</span><span class="n">df</span><span class="p">,</span><span class="n">feature</span><span class="p">).</span><span class="n">index</span><span class="p">,</span><span class="n">y</span><span class="o">=</span><span class="n">value_cnt_norm_cal</span><span class="p">(</span><span class="n">df</span><span class="p">,</span><span class="n">feature</span><span class="p">).</span><span class="n">values</span><span class="p">[:,</span><span class="mi">0</span><span class="p">])</span>
        <span class="n">plt</span><span class="p">.</span><span class="n">xlabel</span><span class="p">(</span><span class="s">'{}'</span><span class="p">.</span><span class="nb">format</span><span class="p">(</span><span class="n">feature</span><span class="p">))</span>
        <span class="n">plt</span><span class="p">.</span><span class="n">ylabel</span><span class="p">(</span><span class="s">'Count'</span><span class="p">)</span>
        <span class="n">plt</span><span class="p">.</span><span class="n">title</span><span class="p">(</span><span class="s">'{} count'</span><span class="p">.</span><span class="nb">format</span><span class="p">(</span><span class="n">feature</span><span class="p">))</span>
        <span class="k">return</span> <span class="n">plt</span><span class="p">.</span><span class="n">show</span><span class="p">()</span>
</code></pre></div></div>

<p>This function will create a box plot for continuous variables.</p>

<p>Note: Depending on which transformation needs to be done on each feature, we have used a switch statement to handle the different feature that requires different handling.</p>

<div class="language-python highlighter-rouge"><div class="highlight"><pre class="highlight"><code><span class="k">def</span> <span class="nf">create_box_plot</span><span class="p">(</span><span class="n">df</span><span class="p">,</span><span class="n">feature</span><span class="p">):</span>
    <span class="s">'''function to create a box plot'''</span>
    <span class="k">if</span> <span class="n">feature</span> <span class="o">==</span> <span class="s">'Age'</span><span class="p">:</span>
        <span class="n">fig</span><span class="p">,</span> <span class="n">ax</span> <span class="o">=</span> <span class="n">plt</span><span class="p">.</span><span class="n">subplots</span><span class="p">(</span><span class="n">figsize</span><span class="o">=</span><span class="p">(</span><span class="mi">2</span><span class="p">,</span><span class="mi">8</span><span class="p">))</span>
        <span class="c1"># change the feature to be expressed in positive numbers days
</span>        <span class="n">sns</span><span class="p">.</span><span class="n">boxplot</span><span class="p">(</span><span class="n">y</span><span class="o">=</span><span class="n">np</span><span class="p">.</span><span class="nb">abs</span><span class="p">(</span><span class="n">df</span><span class="p">[</span><span class="n">feature</span><span class="p">])</span><span class="o">/</span><span class="mf">365.25</span><span class="p">)</span>
        <span class="n">plt</span><span class="p">.</span><span class="n">title</span><span class="p">(</span><span class="s">'{} distribution(Boxplot)'</span><span class="p">.</span><span class="nb">format</span><span class="p">(</span><span class="n">feature</span><span class="p">))</span>
        <span class="k">return</span> <span class="n">plt</span><span class="p">.</span><span class="n">show</span><span class="p">()</span>
    <span class="k">if</span> <span class="n">feature</span> <span class="o">==</span> <span class="s">'Children count'</span><span class="p">:</span>
        <span class="n">fig</span><span class="p">,</span> <span class="n">ax</span> <span class="o">=</span> <span class="n">plt</span><span class="p">.</span><span class="n">subplots</span><span class="p">(</span><span class="n">figsize</span><span class="o">=</span><span class="p">(</span><span class="mi">2</span><span class="p">,</span><span class="mi">8</span><span class="p">))</span>
        <span class="n">sns</span><span class="p">.</span><span class="n">boxplot</span><span class="p">(</span><span class="n">y</span><span class="o">=</span><span class="n">df</span><span class="p">[</span><span class="n">feature</span><span class="p">])</span>
        <span class="n">plt</span><span class="p">.</span><span class="n">title</span><span class="p">(</span><span class="s">'{} distribution(Boxplot)'</span><span class="p">.</span><span class="nb">format</span><span class="p">(</span><span class="n">feature</span><span class="p">))</span>
        <span class="c1"># use the numpy arrange to populate the Y ticks starting from 0 till the max count of children with an interval of 1 as follows np.arange(start, stop, step)
</span>        <span class="n">plt</span><span class="p">.</span><span class="n">yticks</span><span class="p">(</span><span class="n">np</span><span class="p">.</span><span class="n">arange</span><span class="p">(</span><span class="mi">0</span><span class="p">,</span><span class="n">df</span><span class="p">[</span><span class="n">feature</span><span class="p">].</span><span class="nb">max</span><span class="p">(),</span><span class="mi">1</span><span class="p">))</span>
        <span class="k">return</span> <span class="n">plt</span><span class="p">.</span><span class="n">show</span><span class="p">()</span>
    <span class="k">if</span> <span class="n">feature</span> <span class="o">==</span> <span class="s">'Employment length'</span><span class="p">:</span>
        <span class="n">fig</span><span class="p">,</span> <span class="n">ax</span> <span class="o">=</span> <span class="n">plt</span><span class="p">.</span><span class="n">subplots</span><span class="p">(</span><span class="n">figsize</span><span class="o">=</span><span class="p">(</span><span class="mi">2</span><span class="p">,</span><span class="mi">8</span><span class="p">))</span>
        <span class="n">employment_len_no_ret</span> <span class="o">=</span> <span class="n">cc_train_copy</span><span class="p">[</span><span class="s">'Employment length'</span><span class="p">][</span><span class="n">cc_train_copy</span><span class="p">[</span><span class="s">'Employment length'</span><span class="p">]</span> <span class="o">&lt;</span> <span class="mi">0</span><span class="p">]</span>
        <span class="c1"># employment length in days is a negative number, so we need to change it to positive and change it to years
</span>        <span class="n">employment_len_no_ret_yrs</span> <span class="o">=</span> <span class="n">np</span><span class="p">.</span><span class="nb">abs</span><span class="p">(</span><span class="n">employment_len_no_ret</span><span class="p">)</span><span class="o">/</span><span class="mf">365.25</span>
        <span class="c1"># create a boxplot with seaborn
</span>        <span class="n">sns</span><span class="p">.</span><span class="n">boxplot</span><span class="p">(</span><span class="n">y</span><span class="o">=</span><span class="n">employment_len_no_ret_yrs</span><span class="p">)</span>
        <span class="n">plt</span><span class="p">.</span><span class="n">title</span><span class="p">(</span><span class="s">'{} distribution(Boxplot)'</span><span class="p">.</span><span class="nb">format</span><span class="p">(</span><span class="n">feature</span><span class="p">))</span>
        <span class="n">plt</span><span class="p">.</span><span class="n">yticks</span><span class="p">(</span><span class="n">np</span><span class="p">.</span><span class="n">arange</span><span class="p">(</span><span class="mi">0</span><span class="p">,</span><span class="n">employment_len_no_ret_yrs</span><span class="p">.</span><span class="nb">max</span><span class="p">(),</span><span class="mi">2</span><span class="p">))</span>
        <span class="k">return</span> <span class="n">plt</span><span class="p">.</span><span class="n">show</span><span class="p">()</span>
    <span class="k">if</span> <span class="n">feature</span> <span class="o">==</span> <span class="s">'Income'</span><span class="p">:</span>
        <span class="n">fig</span><span class="p">,</span> <span class="n">ax</span> <span class="o">=</span> <span class="n">plt</span><span class="p">.</span><span class="n">subplots</span><span class="p">(</span><span class="n">figsize</span><span class="o">=</span><span class="p">(</span><span class="mi">2</span><span class="p">,</span><span class="mi">8</span><span class="p">))</span>
        <span class="n">sns</span><span class="p">.</span><span class="n">boxplot</span><span class="p">(</span><span class="n">y</span><span class="o">=</span><span class="n">df</span><span class="p">[</span><span class="n">feature</span><span class="p">])</span>
        <span class="n">plt</span><span class="p">.</span><span class="n">title</span><span class="p">(</span><span class="s">'{} distribution(Boxplot)'</span><span class="p">.</span><span class="nb">format</span><span class="p">(</span><span class="n">feature</span><span class="p">))</span>
        <span class="c1"># suppress the scientific notation
</span>        <span class="n">ax</span><span class="p">.</span><span class="n">get_yaxis</span><span class="p">().</span><span class="n">set_major_formatter</span><span class="p">(</span>
            <span class="n">matplotlib</span><span class="p">.</span><span class="n">ticker</span><span class="p">.</span><span class="n">FuncFormatter</span><span class="p">(</span><span class="k">lambda</span> <span class="n">x</span><span class="p">,</span> <span class="n">p</span><span class="p">:</span> <span class="nb">format</span><span class="p">(</span><span class="nb">int</span><span class="p">(</span><span class="n">x</span><span class="p">),</span> <span class="s">','</span><span class="p">)))</span>
        <span class="k">return</span> <span class="n">plt</span><span class="p">.</span><span class="n">show</span><span class="p">()</span>
    <span class="k">if</span> <span class="n">feature</span> <span class="o">==</span> <span class="s">'Account age'</span><span class="p">:</span>
        <span class="n">fig</span><span class="p">,</span> <span class="n">ax</span> <span class="o">=</span> <span class="n">plt</span><span class="p">.</span><span class="n">subplots</span><span class="p">(</span><span class="n">figsize</span><span class="o">=</span><span class="p">(</span><span class="mi">2</span><span class="p">,</span><span class="mi">8</span><span class="p">))</span>
        <span class="n">sns</span><span class="p">.</span><span class="n">boxplot</span><span class="p">(</span><span class="n">y</span><span class="o">=</span><span class="n">np</span><span class="p">.</span><span class="nb">abs</span><span class="p">(</span><span class="n">df</span><span class="p">[</span><span class="n">feature</span><span class="p">]))</span>
        <span class="n">plt</span><span class="p">.</span><span class="n">title</span><span class="p">(</span><span class="s">'{} distribution(Boxplot)'</span><span class="p">.</span><span class="nb">format</span><span class="p">(</span><span class="n">feature</span><span class="p">))</span>
        <span class="k">return</span> <span class="n">plt</span><span class="p">.</span><span class="n">show</span><span class="p">()</span>
    <span class="k">else</span><span class="p">:</span>
        <span class="n">fig</span><span class="p">,</span> <span class="n">ax</span> <span class="o">=</span> <span class="n">plt</span><span class="p">.</span><span class="n">subplots</span><span class="p">(</span><span class="n">figsize</span><span class="o">=</span><span class="p">(</span><span class="mi">2</span><span class="p">,</span><span class="mi">8</span><span class="p">))</span>
        <span class="n">sns</span><span class="p">.</span><span class="n">boxplot</span><span class="p">(</span><span class="n">y</span><span class="o">=</span><span class="n">df</span><span class="p">[</span><span class="n">feature</span><span class="p">])</span>
        <span class="n">plt</span><span class="p">.</span><span class="n">title</span><span class="p">(</span><span class="s">'{} distribution(Boxplot)'</span><span class="p">.</span><span class="nb">format</span><span class="p">(</span><span class="n">feature</span><span class="p">))</span>
        <span class="k">return</span> <span class="n">plt</span><span class="p">.</span><span class="n">show</span><span class="p">()</span>
</code></pre></div></div>

<p>This function will plot a histogram.</p>

<div class="language-python highlighter-rouge"><div class="highlight"><pre class="highlight"><code><span class="k">def</span> <span class="nf">create_hist_plot</span><span class="p">(</span><span class="n">df</span><span class="p">,</span><span class="n">feature</span><span class="p">,</span> <span class="n">the_bins</span><span class="o">=</span><span class="mi">50</span><span class="p">):</span>
    <span class="s">'''function to create a histogram plot'''</span>
    <span class="k">if</span> <span class="n">feature</span> <span class="o">==</span> <span class="s">'Age'</span><span class="p">:</span>
        <span class="n">fig</span><span class="p">,</span> <span class="n">ax</span> <span class="o">=</span> <span class="n">plt</span><span class="p">.</span><span class="n">subplots</span><span class="p">(</span><span class="n">figsize</span><span class="o">=</span><span class="p">(</span><span class="mi">18</span><span class="p">,</span><span class="mi">10</span><span class="p">))</span>
        <span class="c1"># change the feature to be expressed in positive numbers days
</span>        <span class="n">sns</span><span class="p">.</span><span class="n">histplot</span><span class="p">(</span><span class="n">np</span><span class="p">.</span><span class="nb">abs</span><span class="p">(</span><span class="n">df</span><span class="p">[</span><span class="n">feature</span><span class="p">])</span><span class="o">/</span><span class="mf">365.25</span><span class="p">,</span><span class="n">bins</span><span class="o">=</span><span class="n">the_bins</span><span class="p">,</span><span class="n">kde</span><span class="o">=</span><span class="bp">True</span><span class="p">)</span>
        <span class="n">plt</span><span class="p">.</span><span class="n">title</span><span class="p">(</span><span class="s">'{} distribution'</span><span class="p">.</span><span class="nb">format</span><span class="p">(</span><span class="n">feature</span><span class="p">))</span>
        <span class="k">return</span> <span class="n">plt</span><span class="p">.</span><span class="n">show</span><span class="p">()</span>
    <span class="k">if</span> <span class="n">feature</span> <span class="o">==</span> <span class="s">'Income'</span><span class="p">:</span>
        <span class="n">fig</span><span class="p">,</span> <span class="n">ax</span> <span class="o">=</span> <span class="n">plt</span><span class="p">.</span><span class="n">subplots</span><span class="p">(</span><span class="n">figsize</span><span class="o">=</span><span class="p">(</span><span class="mi">18</span><span class="p">,</span><span class="mi">10</span><span class="p">))</span>
        <span class="n">sns</span><span class="p">.</span><span class="n">histplot</span><span class="p">(</span><span class="n">df</span><span class="p">[</span><span class="n">feature</span><span class="p">],</span><span class="n">bins</span><span class="o">=</span><span class="n">the_bins</span><span class="p">,</span><span class="n">kde</span><span class="o">=</span><span class="bp">True</span><span class="p">)</span>
        <span class="c1"># suppress scientific notation
</span>        <span class="n">ax</span><span class="p">.</span><span class="n">get_xaxis</span><span class="p">().</span><span class="n">set_major_formatter</span><span class="p">(</span>
            <span class="n">matplotlib</span><span class="p">.</span><span class="n">ticker</span><span class="p">.</span><span class="n">FuncFormatter</span><span class="p">(</span><span class="k">lambda</span> <span class="n">x</span><span class="p">,</span> <span class="n">p</span><span class="p">:</span> <span class="nb">format</span><span class="p">(</span><span class="nb">int</span><span class="p">(</span><span class="n">x</span><span class="p">),</span> <span class="s">','</span><span class="p">)))</span>
        <span class="n">plt</span><span class="p">.</span><span class="n">title</span><span class="p">(</span><span class="s">'{} distribution'</span><span class="p">.</span><span class="nb">format</span><span class="p">(</span><span class="n">feature</span><span class="p">))</span>
        <span class="k">return</span> <span class="n">plt</span><span class="p">.</span><span class="n">show</span><span class="p">()</span>
    <span class="k">if</span> <span class="n">feature</span> <span class="o">==</span> <span class="s">'Employment length'</span><span class="p">:</span>
        <span class="n">employment_len_no_ret</span> <span class="o">=</span> <span class="n">cc_train_copy</span><span class="p">[</span><span class="s">'Employment length'</span><span class="p">][</span><span class="n">cc_train_copy</span><span class="p">[</span><span class="s">'Employment length'</span><span class="p">]</span> <span class="o">&lt;</span> <span class="mi">0</span><span class="p">]</span>
        <span class="c1"># change the feature to be expressed in positive numbers days
</span>        <span class="n">employment_len_no_ret_yrs</span> <span class="o">=</span> <span class="n">np</span><span class="p">.</span><span class="nb">abs</span><span class="p">(</span><span class="n">employment_len_no_ret</span><span class="p">)</span><span class="o">/</span><span class="mf">365.25</span>
        <span class="n">fig</span><span class="p">,</span> <span class="n">ax</span> <span class="o">=</span> <span class="n">plt</span><span class="p">.</span><span class="n">subplots</span><span class="p">(</span><span class="n">figsize</span><span class="o">=</span><span class="p">(</span><span class="mi">18</span><span class="p">,</span><span class="mi">10</span><span class="p">))</span>
        <span class="n">sns</span><span class="p">.</span><span class="n">histplot</span><span class="p">(</span><span class="n">employment_len_no_ret_yrs</span><span class="p">,</span><span class="n">bins</span><span class="o">=</span><span class="n">the_bins</span><span class="p">,</span><span class="n">kde</span><span class="o">=</span><span class="bp">True</span><span class="p">)</span>
        <span class="n">plt</span><span class="p">.</span><span class="n">title</span><span class="p">(</span><span class="s">'{} distribution'</span><span class="p">.</span><span class="nb">format</span><span class="p">(</span><span class="n">feature</span><span class="p">))</span>
        <span class="k">return</span> <span class="n">plt</span><span class="p">.</span><span class="n">show</span><span class="p">()</span>
    <span class="k">if</span> <span class="n">feature</span> <span class="o">==</span> <span class="s">'Account age'</span><span class="p">:</span>
        <span class="n">fig</span><span class="p">,</span> <span class="n">ax</span> <span class="o">=</span> <span class="n">plt</span><span class="p">.</span><span class="n">subplots</span><span class="p">(</span><span class="n">figsize</span><span class="o">=</span><span class="p">(</span><span class="mi">18</span><span class="p">,</span><span class="mi">10</span><span class="p">))</span>
        <span class="n">sns</span><span class="p">.</span><span class="n">histplot</span><span class="p">(</span><span class="n">np</span><span class="p">.</span><span class="nb">abs</span><span class="p">(</span><span class="n">df</span><span class="p">[</span><span class="n">feature</span><span class="p">]),</span><span class="n">bins</span><span class="o">=</span><span class="n">the_bins</span><span class="p">,</span><span class="n">kde</span><span class="o">=</span><span class="bp">True</span><span class="p">)</span>
        <span class="n">plt</span><span class="p">.</span><span class="n">title</span><span class="p">(</span><span class="s">'{} distribution'</span><span class="p">.</span><span class="nb">format</span><span class="p">(</span><span class="n">feature</span><span class="p">))</span>
        <span class="k">return</span> <span class="n">plt</span><span class="p">.</span><span class="n">show</span><span class="p">()</span>
    <span class="k">else</span><span class="p">:</span>
        <span class="n">fig</span><span class="p">,</span> <span class="n">ax</span> <span class="o">=</span> <span class="n">plt</span><span class="p">.</span><span class="n">subplots</span><span class="p">(</span><span class="n">figsize</span><span class="o">=</span><span class="p">(</span><span class="mi">18</span><span class="p">,</span><span class="mi">10</span><span class="p">))</span>
        <span class="n">sns</span><span class="p">.</span><span class="n">histplot</span><span class="p">(</span><span class="n">df</span><span class="p">[</span><span class="n">feature</span><span class="p">],</span><span class="n">bins</span><span class="o">=</span><span class="n">the_bins</span><span class="p">,</span><span class="n">kde</span><span class="o">=</span><span class="bp">True</span><span class="p">)</span>
        <span class="n">plt</span><span class="p">.</span><span class="n">title</span><span class="p">(</span><span class="s">'{} distribution'</span><span class="p">.</span><span class="nb">format</span><span class="p">(</span><span class="n">feature</span><span class="p">))</span>
        <span class="k">return</span> <span class="n">plt</span><span class="p">.</span><span class="n">show</span><span class="p">()</span>
</code></pre></div></div>

<p>This function will plot two box plots, one is for low-risk (good client), and the other is for high-risk (bad client) applicants. On the Y axis, we have the continuous features we are studying. Again don’t worry too much, as we will see these functions in action in the sections below.</p>

<div class="language-python highlighter-rouge"><div class="highlight"><pre class="highlight"><code><span class="k">def</span> <span class="nf">low_high_risk_box_plot</span><span class="p">(</span><span class="n">df</span><span class="p">,</span><span class="n">feature</span><span class="p">):</span>
    <span class="s">'''High risk vs low risk applicants compared on a box plot'''</span>
    <span class="k">if</span> <span class="n">feature</span> <span class="o">==</span> <span class="s">'Age'</span><span class="p">:</span>
        <span class="k">print</span><span class="p">(</span><span class="n">np</span><span class="p">.</span><span class="nb">abs</span><span class="p">(</span><span class="n">df</span><span class="p">.</span><span class="n">groupby</span><span class="p">(</span><span class="s">'Is high risk'</span><span class="p">)[</span><span class="n">feature</span><span class="p">].</span><span class="n">mean</span><span class="p">()</span><span class="o">/</span><span class="mf">365.25</span><span class="p">))</span>
        <span class="n">fig</span><span class="p">,</span> <span class="n">ax</span> <span class="o">=</span> <span class="n">plt</span><span class="p">.</span><span class="n">subplots</span><span class="p">(</span><span class="n">figsize</span><span class="o">=</span><span class="p">(</span><span class="mi">5</span><span class="p">,</span><span class="mi">8</span><span class="p">))</span>
        <span class="c1"># Place on the Y-axis age and X-axis the two box plot (is high risk: No and Yes)
</span>        <span class="n">sns</span><span class="p">.</span><span class="n">boxplot</span><span class="p">(</span><span class="n">y</span><span class="o">=</span><span class="n">np</span><span class="p">.</span><span class="nb">abs</span><span class="p">(</span><span class="n">df</span><span class="p">[</span><span class="n">feature</span><span class="p">])</span><span class="o">/</span><span class="mf">365.25</span><span class="p">,</span><span class="n">x</span><span class="o">=</span><span class="n">df</span><span class="p">[</span><span class="s">'Is high risk'</span><span class="p">])</span>
        <span class="c1"># add ticks to the X axis
</span>        <span class="n">plt</span><span class="p">.</span><span class="n">xticks</span><span class="p">(</span><span class="n">ticks</span><span class="o">=</span><span class="p">[</span><span class="mi">0</span><span class="p">,</span><span class="mi">1</span><span class="p">],</span><span class="n">labels</span><span class="o">=</span><span class="p">[</span><span class="s">'no'</span><span class="p">,</span><span class="s">'yes'</span><span class="p">])</span>
        <span class="n">plt</span><span class="p">.</span><span class="n">title</span><span class="p">(</span><span class="s">'High risk individuals grouped by age'</span><span class="p">)</span>
        <span class="k">return</span> <span class="n">plt</span><span class="p">.</span><span class="n">show</span><span class="p">()</span>
    <span class="k">if</span> <span class="n">feature</span> <span class="o">==</span> <span class="s">'Income'</span><span class="p">:</span>
        <span class="k">print</span><span class="p">(</span><span class="n">np</span><span class="p">.</span><span class="nb">abs</span><span class="p">(</span><span class="n">df</span><span class="p">.</span><span class="n">groupby</span><span class="p">(</span><span class="s">'Is high risk'</span><span class="p">)[</span><span class="n">feature</span><span class="p">].</span><span class="n">mean</span><span class="p">()))</span>
        <span class="n">fig</span><span class="p">,</span> <span class="n">ax</span> <span class="o">=</span> <span class="n">plt</span><span class="p">.</span><span class="n">subplots</span><span class="p">(</span><span class="n">figsize</span><span class="o">=</span><span class="p">(</span><span class="mi">5</span><span class="p">,</span><span class="mi">8</span><span class="p">))</span>
        <span class="n">sns</span><span class="p">.</span><span class="n">boxplot</span><span class="p">(</span><span class="n">y</span><span class="o">=</span><span class="n">np</span><span class="p">.</span><span class="nb">abs</span><span class="p">(</span><span class="n">df</span><span class="p">[</span><span class="n">feature</span><span class="p">]),</span><span class="n">x</span><span class="o">=</span><span class="n">df</span><span class="p">[</span><span class="s">'Is high risk'</span><span class="p">])</span>
        <span class="n">plt</span><span class="p">.</span><span class="n">xticks</span><span class="p">(</span><span class="n">ticks</span><span class="o">=</span><span class="p">[</span><span class="mi">0</span><span class="p">,</span><span class="mi">1</span><span class="p">],</span><span class="n">labels</span><span class="o">=</span><span class="p">[</span><span class="s">'no'</span><span class="p">,</span><span class="s">'yes'</span><span class="p">])</span>
        <span class="c1"># suppress the scientific notation
</span>        <span class="n">ax</span><span class="p">.</span><span class="n">get_yaxis</span><span class="p">().</span><span class="n">set_major_formatter</span><span class="p">(</span>
            <span class="n">matplotlib</span><span class="p">.</span><span class="n">ticker</span><span class="p">.</span><span class="n">FuncFormatter</span><span class="p">(</span><span class="k">lambda</span> <span class="n">x</span><span class="p">,</span> <span class="n">p</span><span class="p">:</span> <span class="nb">format</span><span class="p">(</span><span class="nb">int</span><span class="p">(</span><span class="n">x</span><span class="p">),</span> <span class="s">','</span><span class="p">)))</span>
        <span class="n">plt</span><span class="p">.</span><span class="n">title</span><span class="p">(</span><span class="s">'High risk individuals grouped by {}'</span><span class="p">.</span><span class="nb">format</span><span class="p">(</span><span class="n">feature</span><span class="p">))</span>
        <span class="k">return</span> <span class="n">plt</span><span class="p">.</span><span class="n">show</span><span class="p">()</span>
    <span class="k">if</span> <span class="n">feature</span> <span class="o">==</span> <span class="s">'Employment length'</span><span class="p">:</span>
        <span class="c1"># checking is an applicant is high risk or not (for those who have negative employment length mean only those who are employed)
</span>        <span class="n">employment_no_ret</span> <span class="o">=</span> <span class="n">cc_train_copy</span><span class="p">[</span><span class="s">'Employment length'</span><span class="p">][</span><span class="n">cc_train_copy</span><span class="p">[</span><span class="s">'Employment length'</span><span class="p">]</span> <span class="o">&lt;</span><span class="mi">0</span><span class="p">]</span>
        <span class="n">employment_no_ret_idx</span> <span class="o">=</span> <span class="n">employment_no_ret</span><span class="p">.</span><span class="n">index</span>
        <span class="n">employment_len_no_ret_yrs</span> <span class="o">=</span> <span class="n">np</span><span class="p">.</span><span class="nb">abs</span><span class="p">(</span><span class="n">employment_no_ret</span><span class="p">)</span><span class="o">/</span><span class="mf">365.25</span>
        <span class="c1"># extract those who are employed from the original dataframe and return only the employment length and Is high risk columns
</span>        <span class="n">employment_no_ret_df</span> <span class="o">=</span> <span class="n">cc_train_copy</span><span class="p">.</span><span class="n">iloc</span><span class="p">[</span><span class="n">employment_no_ret_idx</span><span class="p">][[</span><span class="s">'Employment length'</span><span class="p">,</span><span class="s">'Is high risk'</span><span class="p">]]</span>
        <span class="c1"># return the mean employment length group by how risky is the applicant
</span>        <span class="n">employment_no_ret_is_high_risk</span> <span class="o">=</span> <span class="n">employment_no_ret_df</span><span class="p">.</span><span class="n">groupby</span><span class="p">(</span><span class="s">'Is high risk'</span><span class="p">)[</span><span class="s">'Employment length'</span><span class="p">].</span><span class="n">mean</span><span class="p">()</span>
        <span class="k">print</span><span class="p">(</span><span class="n">np</span><span class="p">.</span><span class="nb">abs</span><span class="p">(</span><span class="n">employment_no_ret_is_high_risk</span><span class="p">)</span><span class="o">/</span><span class="mf">365.25</span><span class="p">)</span>
        <span class="n">fig</span><span class="p">,</span> <span class="n">ax</span> <span class="o">=</span> <span class="n">plt</span><span class="p">.</span><span class="n">subplots</span><span class="p">(</span><span class="n">figsize</span><span class="o">=</span><span class="p">(</span><span class="mi">5</span><span class="p">,</span><span class="mi">8</span><span class="p">))</span>
        <span class="n">sns</span><span class="p">.</span><span class="n">boxplot</span><span class="p">(</span><span class="n">y</span><span class="o">=</span><span class="n">employment_len_no_ret_yrs</span><span class="p">,</span><span class="n">x</span><span class="o">=</span><span class="n">df</span><span class="p">[</span><span class="s">'Is high risk'</span><span class="p">])</span>
        <span class="n">plt</span><span class="p">.</span><span class="n">xticks</span><span class="p">(</span><span class="n">ticks</span><span class="o">=</span><span class="p">[</span><span class="mi">0</span><span class="p">,</span><span class="mi">1</span><span class="p">],</span><span class="n">labels</span><span class="o">=</span><span class="p">[</span><span class="s">'no'</span><span class="p">,</span><span class="s">'yes'</span><span class="p">])</span>
        <span class="n">plt</span><span class="p">.</span><span class="n">title</span><span class="p">(</span><span class="s">'High vs low risk individuals grouped by {}'</span><span class="p">.</span><span class="nb">format</span><span class="p">(</span><span class="n">feature</span><span class="p">))</span>
        <span class="k">return</span> <span class="n">plt</span><span class="p">.</span><span class="n">show</span><span class="p">()</span>
    <span class="k">else</span><span class="p">:</span>
        <span class="k">print</span><span class="p">(</span><span class="n">np</span><span class="p">.</span><span class="nb">abs</span><span class="p">(</span><span class="n">df</span><span class="p">.</span><span class="n">groupby</span><span class="p">(</span><span class="s">'Is high risk'</span><span class="p">)[</span><span class="n">feature</span><span class="p">].</span><span class="n">mean</span><span class="p">()))</span>
        <span class="n">fig</span><span class="p">,</span> <span class="n">ax</span> <span class="o">=</span> <span class="n">plt</span><span class="p">.</span><span class="n">subplots</span><span class="p">(</span><span class="n">figsize</span><span class="o">=</span><span class="p">(</span><span class="mi">5</span><span class="p">,</span><span class="mi">8</span><span class="p">))</span>
        <span class="n">sns</span><span class="p">.</span><span class="n">boxplot</span><span class="p">(</span><span class="n">y</span><span class="o">=</span><span class="n">np</span><span class="p">.</span><span class="nb">abs</span><span class="p">(</span><span class="n">df</span><span class="p">[</span><span class="n">feature</span><span class="p">]),</span><span class="n">x</span><span class="o">=</span><span class="n">df</span><span class="p">[</span><span class="s">'Is high risk'</span><span class="p">])</span>
        <span class="n">plt</span><span class="p">.</span><span class="n">xticks</span><span class="p">(</span><span class="n">ticks</span><span class="o">=</span><span class="p">[</span><span class="mi">0</span><span class="p">,</span><span class="mi">1</span><span class="p">],</span><span class="n">labels</span><span class="o">=</span><span class="p">[</span><span class="s">'no'</span><span class="p">,</span><span class="s">'yes'</span><span class="p">])</span>
        <span class="n">plt</span><span class="p">.</span><span class="n">title</span><span class="p">(</span><span class="s">'High risk individuals grouped by {}'</span><span class="p">.</span><span class="nb">format</span><span class="p">(</span><span class="n">feature</span><span class="p">))</span>
        <span class="k">return</span> <span class="n">plt</span><span class="p">.</span><span class="n">show</span><span class="p">()</span>
</code></pre></div></div>

<p>This function is similar to the previous one; the only difference is that it uses a bar plot which is a count of classes for comparison purposes between high risk and low risk.</p>

<div class="language-python highlighter-rouge"><div class="highlight"><pre class="highlight"><code><span class="k">def</span> <span class="nf">low_high_risk_bar_plot</span><span class="p">(</span><span class="n">df</span><span class="p">,</span><span class="n">feature</span><span class="p">):</span>
    <span class="s">'''High risk vs low risk applicants compared on a bar plot'''</span>
    <span class="c1"># get the sum of high-risk clients grouped by a specific feature
</span>    <span class="n">is_high_risk_grp</span> <span class="o">=</span> <span class="n">df</span><span class="p">.</span><span class="n">groupby</span><span class="p">(</span><span class="n">feature</span><span class="p">)[</span><span class="s">'Is high risk'</span><span class="p">].</span><span class="nb">sum</span><span class="p">()</span>
    <span class="c1"># sort is a descending order
</span>    <span class="n">is_high_risk_grp_srt</span> <span class="o">=</span> <span class="n">is_high_risk_grp</span><span class="p">.</span><span class="n">sort_values</span><span class="p">(</span><span class="n">ascending</span><span class="o">=</span><span class="bp">False</span><span class="p">)</span>
    <span class="k">print</span><span class="p">(</span><span class="nb">dict</span><span class="p">(</span><span class="n">is_high_risk_grp_srt</span><span class="p">))</span>
    <span class="n">fig</span><span class="p">,</span> <span class="n">ax</span> <span class="o">=</span> <span class="n">plt</span><span class="p">.</span><span class="n">subplots</span><span class="p">(</span><span class="n">figsize</span><span class="o">=</span><span class="p">(</span><span class="mi">6</span><span class="p">,</span><span class="mi">10</span><span class="p">))</span>
    <span class="c1"># plot on the X axis the indexes which correspond to classes, and on the Y axis, the count
</span>    <span class="n">sns</span><span class="p">.</span><span class="n">barplot</span><span class="p">(</span><span class="n">x</span><span class="o">=</span><span class="n">is_high_risk_grp_srt</span><span class="p">.</span><span class="n">index</span><span class="p">,</span><span class="n">y</span><span class="o">=</span><span class="n">is_high_risk_grp_srt</span><span class="p">.</span><span class="n">values</span><span class="p">)</span>
    <span class="c1"># add the labels to the plot
</span>    <span class="n">ax</span><span class="p">.</span><span class="n">set_xticklabels</span><span class="p">(</span><span class="n">labels</span><span class="o">=</span><span class="n">is_high_risk_grp_srt</span><span class="p">.</span><span class="n">index</span><span class="p">,</span><span class="n">rotation</span><span class="o">=</span><span class="mi">45</span><span class="p">,</span> <span class="n">ha</span><span class="o">=</span><span class="s">'right'</span><span class="p">)</span>
    <span class="n">plt</span><span class="p">.</span><span class="n">ylabel</span><span class="p">(</span><span class="s">'Count'</span><span class="p">)</span>
    <span class="n">plt</span><span class="p">.</span><span class="n">title</span><span class="p">(</span><span class="s">'High risk applicants count grouped by {}'</span><span class="p">.</span><span class="nb">format</span><span class="p">(</span><span class="n">feature</span><span class="p">))</span>
    <span class="k">return</span> <span class="n">plt</span><span class="p">.</span><span class="n">show</span><span class="p">()</span>
</code></pre></div></div>

<p>Now let’s properly start our exploratory data analysis with a univariate analysis. Univariate analysis is an analysis of each feature individually in the dataset.</p>

<h3>Univariate analysis</h3>

<h3>Gender</h3>

<p>We start with <code class="language-plaintext highlighter-rouge">Gender</code>. We call <code class="language-plaintext highlighter-rouge">gen_info_feat</code> and see that we have two unique classes <code class="language-plaintext highlighter-rouge">F</code> (for female) and <code class="language-plaintext highlighter-rouge">M</code> (for male), with 19549 and 9616 occurrences, respectively. Percentage-wise we have 67.02% females and 32.97% males.</p>

<div class="language-python highlighter-rouge"><div class="highlight"><pre class="highlight"><code><span class="n">gen_info_feat</span><span class="p">(</span><span class="n">cc_train_copy</span><span class="p">,</span><span class="s">'Gender'</span><span class="p">)</span>
</code></pre></div></div>

<div class="language-plaintext highlighter-rouge"><div class="highlight"><pre class="highlight"><code>Description:
count     29165
unique        2
top           F
freq      19549
Name: Gender, dtype: object
**************************************************
Object type:
object
**************************************************
Value count:
   Count  Frequency (%)
F  19549      67.028973
M   9616      32.971027
</code></pre></div></div>

<div class="language-python highlighter-rouge"><div class="highlight"><pre class="highlight"><code><span class="n">create_bar_plot</span><span class="p">(</span><span class="n">cc_train_copy</span><span class="p">,</span><span class="s">'Gender'</span><span class="p">)</span>
</code></pre></div></div>

<p><img src="/blog/assets/post_cont_image/output_78_0.png" alt="png" /></p>

<div class="language-python highlighter-rouge"><div class="highlight"><pre class="highlight"><code><span class="n">create_pie_plot</span><span class="p">(</span><span class="n">cc_train_copy</span><span class="p">,</span><span class="s">'Gender'</span><span class="p">)</span>
</code></pre></div></div>

<p><img src="/blog/assets/post_cont_image/output_79_0.png" alt="png" /></p>

<h3>Age</h3>

<p>Now let’s look at <code class="language-plaintext highlighter-rouge">Age</code>; since age is a continuous variable, we will process it differently than <code class="language-plaintext highlighter-rouge">Gender</code>. Using the <code class="language-plaintext highlighter-rouge">gen_info_feat</code> function, we look at the mean, standard deviation, minimum, maximum and interquartile range. Then we plot that information on a box plot by calling the <code class="language-plaintext highlighter-rouge">create_box_plot</code> function. With that, we can see that the youngest applicant(s) is 21 years old while the oldest is 68. With an average of 43.7 and a median of 42.6 (outliers insensitive)</p>

<div class="language-python highlighter-rouge"><div class="highlight"><pre class="highlight"><code><span class="n">gen_info_feat</span><span class="p">(</span><span class="n">cc_train_copy</span><span class="p">,</span><span class="s">'Age'</span><span class="p">)</span>
</code></pre></div></div>

<div class="language-plaintext highlighter-rouge"><div class="highlight"><pre class="highlight"><code>Description:
count    29165.000000
mean        43.749425
std         11.507180
min         21.095140
25%         34.154689
50%         42.614648
75%         53.234771
max         68.862423
Name: Age, dtype: float64
**************************************************
Object type:int64
Description:
count    29165.000000
mean    -15979.477490
std       4202.997485
min     -25152.000000
25%     -19444.000000
50%     -15565.000000
75%     -12475.000000
max      -7705.000000
Name: Age, dtype: float64
**************************************************
Object type:
int64
**************************************************
Value count:
        Count  Frequency (%)
-12676     44       0.150866
-15519     44       0.150866
-16896     33       0.113149
-16053     26       0.089148
-16768     26       0.089148
...       ...            ...
-18253      1       0.003429
-23429      1       0.003429
-15478      1       0.003429
-21648      1       0.003429
-19564      1       0.003429

[6794 rows x 2 columns]
</code></pre></div></div>

<div class="language-python highlighter-rouge"><div class="highlight"><pre class="highlight"><code><span class="n">create_box_plot</span><span class="p">(</span><span class="n">cc_train_copy</span><span class="p">,</span><span class="s">'Age'</span><span class="p">)</span>
</code></pre></div></div>

<p><img src="/blog/assets/post_cont_image/output_83_0.png" alt="png" /></p>

<p>After that, we plot its histogram with the kernel density estimator. ``` Age `` is not normally distributed; it is slightly positively skewed.</p>

<div class="language-python highlighter-rouge"><div class="highlight"><pre class="highlight"><code><span class="n">create_hist_plot</span><span class="p">(</span><span class="n">cc_train_copy</span><span class="p">,</span><span class="s">'Age'</span><span class="p">)</span>
</code></pre></div></div>

<p><img src="/blog/assets/post_cont_image/output_85_0.png" alt="png" /></p>

<p>Now we perform a quick bivariate analysis (comparison of two features) of <code class="language-plaintext highlighter-rouge">Age</code> and the target variable <code class="language-plaintext highlighter-rouge">Is high risk</code>. The blue box plot represents a good client (is high risk = No), and the green box plot represents a bad client (is high risk = Yes). We can see no significant difference between the age of those who are high risk and those who are not. The mean age for both groups is around 43 years old, and there is no correlation between the age and risk factors of the applicant.</p>

<div class="language-python highlighter-rouge"><div class="highlight"><pre class="highlight"><code><span class="n">low_high_risk_box_plot</span><span class="p">(</span><span class="n">cc_train_copy</span><span class="p">,</span><span class="s">'Age'</span><span class="p">)</span>
</code></pre></div></div>

<div class="language-plaintext highlighter-rouge"><div class="highlight"><pre class="highlight"><code>Is high risk
0    43.753103
1    43.538148
Name: Age, dtype: float64
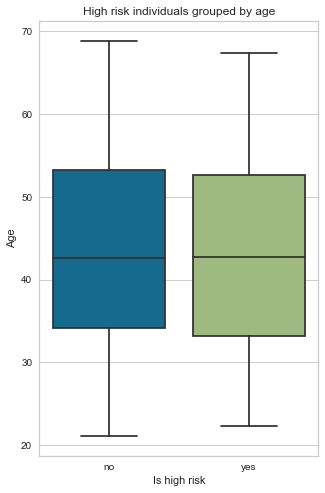
</code></pre></div></div>

<p><img src="/blog/assets/post_cont_image/output_87_1.png" alt="png" /></p>

<h3>Marital status</h3>

<p>There are 5 unique classes for this feature. Married constitutes the most significant proportion of marital status, with 68% far ahead of single, as seen on the pie chart and bar charts. Another interesting observation is that even though we have a higher number of applicants who are separated than widows, it seems that widow applicants are bad clients than those who are separated by a small margin.</p>

<div class="language-python highlighter-rouge"><div class="highlight"><pre class="highlight"><code><span class="n">gen_info_feat</span><span class="p">(</span><span class="n">cc_train_copy</span><span class="p">,</span><span class="s">'Marital status'</span><span class="p">)</span>
</code></pre></div></div>

<div class="language-plaintext highlighter-rouge"><div class="highlight"><pre class="highlight"><code>Description:
count       29165
unique          5
top       Married
freq        20044
Name: Marital status, dtype: object
**************************************************
Object type:
object
**************************************************
Value count:
                      Count  Frequency (%)
Married               20044      68.726213
Single / not married   3864      13.248757
Civil marriage         2312       7.927310
Separated              1712       5.870050
Widow                  1233       4.227670
</code></pre></div></div>

<div class="language-python highlighter-rouge"><div class="highlight"><pre class="highlight"><code><span class="n">create_pie_plot</span><span class="p">(</span><span class="n">cc_train_copy</span><span class="p">,</span><span class="s">'Marital status'</span><span class="p">)</span>
</code></pre></div></div>

<p><img src="/blog/assets/post_cont_image/output_91_0.png" alt="png" /></p>

<div class="language-python highlighter-rouge"><div class="highlight"><pre class="highlight"><code><span class="n">create_bar_plot</span><span class="p">(</span><span class="n">cc_train_copy</span><span class="p">,</span><span class="s">'Marital status'</span><span class="p">)</span>
</code></pre></div></div>

<p><img src="/blog/assets/post_cont_image/output_92_0.png" alt="png" /></p>

<div class="language-python highlighter-rouge"><div class="highlight"><pre class="highlight"><code><span class="n">low_high_risk_bar_plot</span><span class="p">(</span><span class="n">cc_train_copy</span><span class="p">,</span><span class="s">'Marital status'</span><span class="p">)</span>
</code></pre></div></div>

<div class="language-plaintext highlighter-rouge"><div class="highlight"><pre class="highlight"><code>{'Married': 320, 'Single / not married': 87, 'Civil marriage': 34, 'Widow': 34, 'Separated': 24}
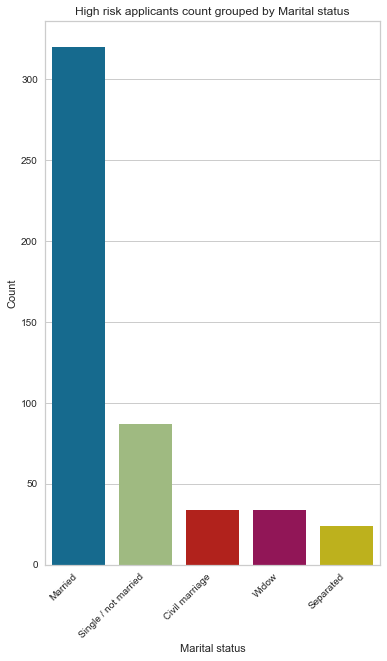
</code></pre></div></div>

<p><img src="/blog/assets/post_cont_image/output_93_1.png" alt="png" /></p>

<h3>Family member count</h3>

<p>Family member count is a numerical feature, with the median of 2 family members representing 53% (count = 15552) of all the counts, followed by a single family member with 19% (count = 5613). Looking at the box plot, we have 6 outliers; 2 are extreme, with 20 and 15 members in their household.</p>

<div class="language-python highlighter-rouge"><div class="highlight"><pre class="highlight"><code><span class="n">gen_info_feat</span><span class="p">(</span><span class="n">cc_train_copy</span><span class="p">,</span><span class="s">'Family member count'</span><span class="p">)</span>
</code></pre></div></div>

<div class="language-plaintext highlighter-rouge"><div class="highlight"><pre class="highlight"><code>Description:
count    29165.000000
mean         2.197531
std          0.912189
min          1.000000
25%          2.000000
50%          2.000000
75%          3.000000
max         20.000000
Name: Family member count, dtype: float64
**************************************************
Object type:
float64
**************************************************
Value count:
      Count  Frequency (%)
2.0   15552      53.324190
1.0    5613      19.245671
3.0    5121      17.558718
4.0    2503       8.582205
5.0     309       1.059489
6.0      48       0.164581
7.0      14       0.048003
9.0       2       0.006858
15.0      2       0.006858
20.0      1       0.003429
</code></pre></div></div>

<div class="language-python highlighter-rouge"><div class="highlight"><pre class="highlight"><code><span class="n">create_box_plot</span><span class="p">(</span><span class="n">cc_train_copy</span><span class="p">,</span><span class="s">'Family member count'</span><span class="p">)</span>
</code></pre></div></div>

<p><img src="/blog/assets/post_cont_image/output_97_0.png" alt="png" /></p>

<div class="language-python highlighter-rouge"><div class="highlight"><pre class="highlight"><code><span class="n">create_bar_plot</span><span class="p">(</span><span class="n">cc_train_copy</span><span class="p">,</span><span class="s">'Family member count'</span><span class="p">)</span>
</code></pre></div></div>

<p><img src="/blog/assets/post_cont_image/output_98_0.png" alt="png" /></p>

<h3>Children count</h3>

<p>From the chart below, we can see that most applicants don’t have any children. Again, we have 6 outliers, most probably the same seen from the family member count.</p>

<div class="language-python highlighter-rouge"><div class="highlight"><pre class="highlight"><code><span class="n">gen_info_feat</span><span class="p">(</span><span class="n">cc_train_copy</span><span class="p">,</span><span class="s">'Children count'</span><span class="p">)</span>
</code></pre></div></div>

<div class="language-plaintext highlighter-rouge"><div class="highlight"><pre class="highlight"><code>Description:
count    29165.000000
mean         0.430790
std          0.741882
min          0.000000
25%          0.000000
50%          0.000000
75%          1.000000
max         19.000000
Name: Children count, dtype: float64
**************************************************
Object type:
int64
**************************************************
Value count:
    Count  Frequency (%)
0   20143      69.065661
1    6003      20.582890
2    2624       8.997086
3     323       1.107492
4      52       0.178296
5      15       0.051432
7       2       0.006858
14      2       0.006858
19      1       0.003429
</code></pre></div></div>

<div class="language-python highlighter-rouge"><div class="highlight"><pre class="highlight"><code><span class="n">create_box_plot</span><span class="p">(</span><span class="n">cc_train_copy</span><span class="p">,</span><span class="s">'Children count'</span><span class="p">)</span>
</code></pre></div></div>

<p><img src="/blog/assets/post_cont_image/output_102_0.png" alt="png" /></p>

<div class="language-python highlighter-rouge"><div class="highlight"><pre class="highlight"><code><span class="n">create_bar_plot</span><span class="p">(</span><span class="n">cc_train_copy</span><span class="p">,</span><span class="s">'Children count'</span><span class="p">)</span>
</code></pre></div></div>

<p><img src="/blog/assets/post_cont_image/output_103_0.png" alt="png" /></p>

<h3>Dwelling type</h3>

<p>89% of applicants live in houses/apartments by a substantial margin.</p>

<div class="language-python highlighter-rouge"><div class="highlight"><pre class="highlight"><code><span class="n">gen_info_feat</span><span class="p">(</span><span class="n">cc_train_copy</span><span class="p">,</span><span class="s">'Dwelling'</span><span class="p">)</span>
</code></pre></div></div>

<div class="language-plaintext highlighter-rouge"><div class="highlight"><pre class="highlight"><code>Description:
count                 29165
unique                    6
top       House / apartment
freq                  26059
Name: Dwelling, dtype: object
**************************************************
Object type:
object
**************************************************
Value count:
                     Count  Frequency (%)
House / apartment    26059      89.350249
With parents          1406       4.820847
Municipal apartment    912       3.127036
Rented apartment       453       1.553232
Office apartment       208       0.713184
Co-op apartment        127       0.435453
</code></pre></div></div>

<div class="language-python highlighter-rouge"><div class="highlight"><pre class="highlight"><code><span class="n">create_pie_plot</span><span class="p">(</span><span class="n">cc_train_copy</span><span class="p">,</span><span class="s">'Dwelling'</span><span class="p">)</span>
</code></pre></div></div>

<p><img src="/blog/assets/post_cont_image/output_107_0.png" alt="png" /></p>

<div class="language-python highlighter-rouge"><div class="highlight"><pre class="highlight"><code><span class="n">create_bar_plot</span><span class="p">(</span><span class="n">cc_train_copy</span><span class="p">,</span><span class="s">'Dwelling'</span><span class="p">)</span>
</code></pre></div></div>

<p><img src="/blog/assets/post_cont_image/output_108_0.png" alt="png" /></p>

<h3>Income</h3>

<p>Looking at the results from the <code class="language-plaintext highlighter-rouge">gen_info_feat</code> function, we can see that the average mean income is 186890, but this amount factors in outliers. Most people make 157500 (median income) if we ignore the outliers. We have 3 applicants who make more than 1000000.</p>

<p>This feature is also positively skewed. Focusing on the income box plot of good and bad clients, they all have roughly similar incomes.</p>

<div class="language-python highlighter-rouge"><div class="highlight"><pre class="highlight"><code><span class="n">pd</span><span class="p">.</span><span class="n">set_option</span><span class="p">(</span><span class="s">'display.float_format'</span><span class="p">,</span> <span class="k">lambda</span> <span class="n">x</span><span class="p">:</span> <span class="s">'%.2f'</span> <span class="o">%</span> <span class="n">x</span><span class="p">)</span>
<span class="n">gen_info_feat</span><span class="p">(</span><span class="n">cc_train_copy</span><span class="p">,</span><span class="s">'Income'</span><span class="p">)</span>
</code></pre></div></div>

<div class="language-plaintext highlighter-rouge"><div class="highlight"><pre class="highlight"><code>Description:
count     29165.00
mean     186890.39
std      101409.64
min       27000.00
25%      121500.00
50%      157500.00
75%      225000.00
max     1575000.00
Name: Income, dtype: float64
**************************************************
Object type:float64
</code></pre></div></div>

<div class="language-python highlighter-rouge"><div class="highlight"><pre class="highlight"><code><span class="n">create_box_plot</span><span class="p">(</span><span class="n">cc_train_copy</span><span class="p">,</span><span class="s">'Income'</span><span class="p">)</span>
</code></pre></div></div>

<p><img src="/blog/assets/post_cont_image/output_112_0.png" alt="png" /></p>

<div class="language-python highlighter-rouge"><div class="highlight"><pre class="highlight"><code><span class="n">create_hist_plot</span><span class="p">(</span><span class="n">cc_train_copy</span><span class="p">,</span><span class="s">'Income'</span><span class="p">)</span>
</code></pre></div></div>

<p><img src="/blog/assets/post_cont_image/output_113_0.png" alt="png" /></p>

<ul>
  <li>bivariate analysis with target variable</li>
</ul>

<div class="language-python highlighter-rouge"><div class="highlight"><pre class="highlight"><code><span class="n">low_high_risk_box_plot</span><span class="p">(</span><span class="n">cc_train_copy</span><span class="p">,</span><span class="s">'Income'</span><span class="p">)</span>
</code></pre></div></div>

<div class="language-plaintext highlighter-rouge"><div class="highlight"><pre class="highlight"><code>Is high risk
0   186913.94
1   185537.26
Name: Income, dtype: float64
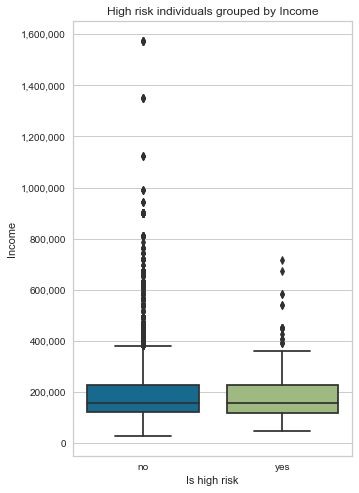
</code></pre></div></div>

<p><img src="/blog/assets/post_cont_image/output_115_1.png" alt="png" /></p>

<h3>Job title</h3>

<p>The most common Job title is laborers by a large margin (24.85%), followed by core staff (14.23%), sales staff (13.77%) and managers (12.03%). We also have 30.95% of missing data.</p>

<div class="language-python highlighter-rouge"><div class="highlight"><pre class="highlight"><code><span class="n">gen_info_feat</span><span class="p">(</span><span class="n">cc_train_copy</span><span class="p">,</span><span class="s">'Job title'</span><span class="p">)</span>
</code></pre></div></div>

<div class="language-plaintext highlighter-rouge"><div class="highlight"><pre class="highlight"><code>Description:
count        20138
unique          18
top       Laborers
freq          5004
Name: Job title, dtype: object
**************************************************
Object type:
object
**************************************************
Value count:
                       Count  Frequency (%)
Laborers                5004          24.85
Core staff              2866          14.23
Sales staff             2773          13.77
Managers                2422          12.03
Drivers                 1722           8.55
High skill tech staff   1133           5.63
Accountants              998           4.96
Medicine staff           956           4.75
Cooking staff            521           2.59
Security staff           464           2.30
Cleaning staff           425           2.11
Private service staff    287           1.43
Low-skill Laborers       138           0.69
Waiters/barmen staff     127           0.63
Secretaries              122           0.61
HR staff                  72           0.36
Realty agents             60           0.30
IT staff                  48           0.24
</code></pre></div></div>

<div class="language-python highlighter-rouge"><div class="highlight"><pre class="highlight"><code><span class="n">job_title_nan_count</span> <span class="o">=</span> <span class="n">cc_train_copy</span><span class="p">[</span><span class="s">'Job title'</span><span class="p">].</span><span class="n">isna</span><span class="p">().</span><span class="nb">sum</span><span class="p">()</span>
<span class="n">job_title_nan_count</span>
</code></pre></div></div>

<div class="language-plaintext highlighter-rouge"><div class="highlight"><pre class="highlight"><code>9027
</code></pre></div></div>

<div class="language-python highlighter-rouge"><div class="highlight"><pre class="highlight"><code><span class="n">rows_total_count</span> <span class="o">=</span> <span class="n">cc_train_copy</span><span class="p">.</span><span class="n">shape</span><span class="p">[</span><span class="mi">0</span><span class="p">]</span>
</code></pre></div></div>

<div class="language-python highlighter-rouge"><div class="highlight"><pre class="highlight"><code><span class="k">print</span><span class="p">(</span><span class="s">'The percentage of missing rows is {:.2f} %'</span><span class="p">.</span><span class="nb">format</span><span class="p">(</span><span class="n">job_title_nan_count</span> <span class="o">*</span> <span class="mi">100</span> <span class="o">/</span> <span class="n">rows_total_count</span><span class="p">))</span>
</code></pre></div></div>

<div class="language-plaintext highlighter-rouge"><div class="highlight"><pre class="highlight"><code>The percentage of missing rows is 30.95 %
</code></pre></div></div>

<div class="language-python highlighter-rouge"><div class="highlight"><pre class="highlight"><code><span class="n">create_bar_plot</span><span class="p">(</span><span class="n">cc_train_copy</span><span class="p">,</span><span class="s">'Job title'</span><span class="p">)</span>
</code></pre></div></div>

<p><img src="/blog/assets/post_cont_image/output_122_0.png" alt="png" /></p>

<h3>Employment status</h3>

<p>Most applicants are working (51.62%); the next most represented status is commercial associate, followed by the pensioner.</p>

<div class="language-python highlighter-rouge"><div class="highlight"><pre class="highlight"><code><span class="n">gen_info_feat</span><span class="p">(</span><span class="n">cc_train_copy</span><span class="p">,</span><span class="s">'Employment status'</span><span class="p">)</span>
</code></pre></div></div>

<div class="language-plaintext highlighter-rouge"><div class="highlight"><pre class="highlight"><code>Description:
count       29165
unique          5
top       Working
freq        15056
Name: Employment status, dtype: object
**************************************************
Object type:
object
**************************************************
Value count:
                      Count  Frequency (%)
Working               15056          51.62
Commercial associate   6801          23.32
Pensioner              4920          16.87
State servant          2381           8.16
Student                   7           0.02
</code></pre></div></div>

<div class="language-python highlighter-rouge"><div class="highlight"><pre class="highlight"><code><span class="n">create_bar_plot</span><span class="p">(</span><span class="n">cc_train_copy</span><span class="p">,</span><span class="s">'Employment status'</span><span class="p">)</span>
</code></pre></div></div>

<p><img src="/blog/assets/post_cont_image/output_126_0.png" alt="png" /></p>

<div class="language-python highlighter-rouge"><div class="highlight"><pre class="highlight"><code><span class="n">create_pie_plot</span><span class="p">(</span><span class="n">cc_train_copy</span><span class="p">,</span><span class="s">'Employment status'</span><span class="p">)</span>
</code></pre></div></div>

<p><img src="/blog/assets/post_cont_image/output_127_0.png" alt="png" /></p>

<h3>Education level</h3>

<p>Most applicants have completed their secondary degree (67.90%) ¼ completed their higher education.</p>

<div class="language-python highlighter-rouge"><div class="highlight"><pre class="highlight"><code><span class="n">gen_info_feat</span><span class="p">(</span><span class="n">cc_train_copy</span><span class="p">,</span><span class="s">'Education level'</span><span class="p">)</span>
</code></pre></div></div>

<div class="language-plaintext highlighter-rouge"><div class="highlight"><pre class="highlight"><code>Description:
count                             29165
unique                                5
top       Secondary / secondary special
freq                              19803
Name: Education level, dtype: object
**************************************************
Object type:
object
**************************************************
Value count:
                               Count  Frequency (%)
Secondary / secondary special  19803          67.90
Higher education                7910          27.12
Incomplete higher               1129           3.87
Lower secondary                  298           1.02
Academic degree                   25           0.09
</code></pre></div></div>

<div class="language-python highlighter-rouge"><div class="highlight"><pre class="highlight"><code><span class="n">create_pie_plot</span><span class="p">(</span><span class="n">cc_train_copy</span><span class="p">,</span><span class="s">'Education level'</span><span class="p">)</span>
</code></pre></div></div>

<p><img src="/blog/assets/post_cont_image/output_131_0.png" alt="png" /></p>

<div class="language-python highlighter-rouge"><div class="highlight"><pre class="highlight"><code><span class="n">create_bar_plot</span><span class="p">(</span><span class="n">cc_train_copy</span><span class="p">,</span><span class="s">'Education level'</span><span class="p">)</span>
</code></pre></div></div>

<p><img src="/blog/assets/post_cont_image/output_132_0.png" alt="png" /></p>

<h3>Employment length</h3>

<p>Most applicants have been working between 5 to 7 years on average, and we also have many outliers who have been working for more than 20 years+. The employment length histogram is positively skewed. Finally, bad clients have a low employment length of 5 versus 7 years for good clients.</p>

<div class="language-python highlighter-rouge"><div class="highlight"><pre class="highlight"><code><span class="n">gen_info_feat</span><span class="p">(</span><span class="n">cc_train_copy</span><span class="p">,</span><span class="s">'Employment length'</span><span class="p">)</span>
</code></pre></div></div>

<div class="language-plaintext highlighter-rouge"><div class="highlight"><pre class="highlight"><code>Description:
count   24257.00
mean        7.26
std         6.46
min         0.05
25%         2.68
50%         5.45
75%         9.60
max        43.02
Name: Employment length, dtype: float64
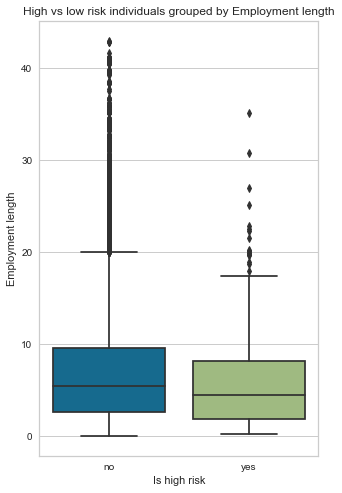
**************************************************
Object type:int64
Description:
count    29165.00
mean     59257.76
std     137655.88
min     -15713.00
25%      -3153.00
50%      -1557.00
75%       -412.00
max     365243.00
Name: Employment length, dtype: float64
**************************************************
Object type:
int64
**************************************************
Value count:
         Count  Frequency (%)
 365243   4908          16.83
-401        61           0.21
-200        55           0.19
-2087       53           0.18
-1539       51           0.17
...        ...            ...
-8369        1           0.00
-6288        1           0.00
-6303        1           0.00
-3065        1           0.00
-8256        1           0.00

[3483 rows x 2 columns]
</code></pre></div></div>

<div class="language-python highlighter-rouge"><div class="highlight"><pre class="highlight"><code><span class="n">create_box_plot</span><span class="p">(</span><span class="n">cc_train_copy</span><span class="p">,</span><span class="s">'Employment length'</span><span class="p">)</span>
</code></pre></div></div>

<p><img src="/blog/assets/post_cont_image/output_136_0.png" alt="png" /></p>

<div class="language-python highlighter-rouge"><div class="highlight"><pre class="highlight"><code><span class="n">create_hist_plot</span><span class="p">(</span><span class="n">cc_train_copy</span><span class="p">,</span><span class="s">'Employment length'</span><span class="p">)</span>
</code></pre></div></div>

<p><img src="/blog/assets/post_cont_image/output_137_0.png" alt="png" /></p>

<ul>
  <li>bivariate analysis with target variable</li>
</ul>

<div class="language-python highlighter-rouge"><div class="highlight"><pre class="highlight"><code><span class="c1"># distribution of employment length for good vs bad client
# Here 0 means No and 1 means Yes
</span><span class="n">low_high_risk_box_plot</span><span class="p">(</span><span class="n">cc_train_copy</span><span class="p">,</span><span class="s">'Employment length'</span><span class="p">)</span>
</code></pre></div></div>

<div class="language-plaintext highlighter-rouge"><div class="highlight"><pre class="highlight"><code>Is high risk
0   7.29
1   5.75
Name: Employment length, dtype: float64
</code></pre></div></div>

<p><img src="/blog/assets/post_cont_image/output_139_1.png" alt="png" /></p>

<h3>Has a car</h3>

<p>Most applicants don’t own a car (62% of applicants).</p>

<div class="language-python highlighter-rouge"><div class="highlight"><pre class="highlight"><code><span class="n">gen_info_feat</span><span class="p">(</span><span class="n">cc_train_copy</span><span class="p">,</span><span class="s">'Has a car'</span><span class="p">)</span>
</code></pre></div></div>

<div class="language-plaintext highlighter-rouge"><div class="highlight"><pre class="highlight"><code>Description:
count     29165
unique        2
top           N
freq      18128
Name: Has a car, dtype: object
**************************************************
Object type:
object
**************************************************
Value count:
   Count  Frequency (%)
N  18128          62.16
Y  11037          37.84
</code></pre></div></div>

<div class="language-python highlighter-rouge"><div class="highlight"><pre class="highlight"><code><span class="n">create_bar_plot</span><span class="p">(</span><span class="n">cc_train_copy</span><span class="p">,</span><span class="s">'Has a car'</span><span class="p">)</span>
</code></pre></div></div>

<p><img src="/blog/assets/post_cont_image/output_143_0.png" alt="png" /></p>

<div class="language-python highlighter-rouge"><div class="highlight"><pre class="highlight"><code><span class="n">create_pie_plot</span><span class="p">(</span><span class="n">cc_train_copy</span><span class="p">,</span><span class="s">'Has a car'</span><span class="p">)</span>
</code></pre></div></div>

<p><img src="/blog/assets/post_cont_image/output_144_0.png" alt="png" /></p>

<h3>Has a property</h3>

<p>Most applicants own a property (67% of applicants)</p>

<div class="language-python highlighter-rouge"><div class="highlight"><pre class="highlight"><code><span class="n">gen_info_feat</span><span class="p">(</span><span class="n">cc_train_copy</span><span class="p">,</span><span class="s">'Has a property'</span><span class="p">)</span>
</code></pre></div></div>

<div class="language-plaintext highlighter-rouge"><div class="highlight"><pre class="highlight"><code>Description:
count     29165
unique        2
top           Y
freq      19557
Name: Has a property, dtype: object
**************************************************
Object type:
object
**************************************************
Value count:
   Count  Frequency (%)
Y  19557          67.06
N   9608          32.94
</code></pre></div></div>

<div class="language-python highlighter-rouge"><div class="highlight"><pre class="highlight"><code><span class="n">create_bar_plot</span><span class="p">(</span><span class="n">cc_train_copy</span><span class="p">,</span><span class="s">'Has a property'</span><span class="p">)</span>
</code></pre></div></div>

<p><img src="/blog/assets/post_cont_image/output_148_0.png" alt="png" /></p>

<div class="language-python highlighter-rouge"><div class="highlight"><pre class="highlight"><code><span class="n">create_pie_plot</span><span class="p">(</span><span class="n">cc_train_copy</span><span class="p">,</span><span class="s">'Has a property'</span><span class="p">)</span>
</code></pre></div></div>

<p><img src="/blog/assets/post_cont_image/output_149_0.png" alt="png" /></p>

<h3>Has a work phone</h3>

<p>More than ¾ of applicants don’t have a work phone</p>

<p>Note: Here, 0 represent no and 1 represents yes</p>

<div class="language-python highlighter-rouge"><div class="highlight"><pre class="highlight"><code><span class="n">gen_info_feat</span><span class="p">(</span><span class="n">cc_train_copy</span><span class="p">,</span><span class="s">'Has a work phone'</span><span class="p">)</span>
</code></pre></div></div>

<div class="language-plaintext highlighter-rouge"><div class="highlight"><pre class="highlight"><code>Description:
count   29165.00
mean        0.22
std         0.42
min         0.00
25%         0.00
50%         0.00
75%         0.00
max         1.00
Name: Has a work phone, dtype: float64
**************************************************
Object type:
int64
**************************************************
Value count:
   Count  Frequency (%)
0  22623          77.57
1   6542          22.43
</code></pre></div></div>

<div class="language-python highlighter-rouge"><div class="highlight"><pre class="highlight"><code><span class="n">create_bar_plot</span><span class="p">(</span><span class="n">cc_train_copy</span><span class="p">,</span><span class="s">'Has a work phone'</span><span class="p">)</span>
</code></pre></div></div>

<p><img src="/blog/assets/post_cont_image/output_153_0.png" alt="png" /></p>

<div class="language-python highlighter-rouge"><div class="highlight"><pre class="highlight"><code><span class="n">create_pie_plot</span><span class="p">(</span><span class="n">cc_train_copy</span><span class="p">,</span><span class="s">'Has a work phone'</span><span class="p">)</span>
</code></pre></div></div>

<p><img src="/blog/assets/post_cont_image/output_154_0.png" alt="png" /></p>

<h3>Has a mobile phone</h3>

<p>All the applicants, without exception, have a mobile phone.</p>

<p>Note: Here, 0 is no and 1 is yes</p>

<div class="language-python highlighter-rouge"><div class="highlight"><pre class="highlight"><code><span class="n">gen_info_feat</span><span class="p">(</span><span class="n">cc_train_copy</span><span class="p">,</span><span class="s">'Has a mobile phone'</span><span class="p">)</span>
</code></pre></div></div>

<div class="language-plaintext highlighter-rouge"><div class="highlight"><pre class="highlight"><code>Description:
count   29165.00
mean        1.00
std         0.00
min         1.00
25%         1.00
50%         1.00
75%         1.00
max         1.00
Name: Has a mobile phone, dtype: float64
**************************************************
Object type:
int64
**************************************************
Value count:
   Count  Frequency (%)
1  29165         100.00
</code></pre></div></div>

<div class="language-python highlighter-rouge"><div class="highlight"><pre class="highlight"><code><span class="n">create_pie_plot</span><span class="p">(</span><span class="n">cc_train_copy</span><span class="p">,</span><span class="s">'Has a mobile phone'</span><span class="p">)</span>
</code></pre></div></div>

<p><img src="/blog/assets/post_cont_image/output_158_0.png" alt="png" /></p>

<h3>Has a phone</h3>

<p>70% of applicants don’t have a phone (probably a home phone)</p>

<p>Note: Here, 0 is no and 1 is yes</p>

<div class="language-python highlighter-rouge"><div class="highlight"><pre class="highlight"><code><span class="n">gen_info_feat</span><span class="p">(</span><span class="n">cc_train_copy</span><span class="p">,</span><span class="s">'Has a phone'</span><span class="p">)</span>
</code></pre></div></div>

<div class="language-plaintext highlighter-rouge"><div class="highlight"><pre class="highlight"><code>Description:
count   29165.00
mean        0.29
std         0.46
min         0.00
25%         0.00
50%         0.00
75%         1.00
max         1.00
Name: Has a phone, dtype: float64
**************************************************
Object type:
int64
**************************************************
Value count:
   Count  Frequency (%)
0  20562          70.50
1   8603          29.50
</code></pre></div></div>

<div class="language-python highlighter-rouge"><div class="highlight"><pre class="highlight"><code><span class="n">create_bar_plot</span><span class="p">(</span><span class="n">cc_train_copy</span><span class="p">,</span><span class="s">'Has a phone'</span><span class="p">)</span>
</code></pre></div></div>

<p><img src="/blog/assets/post_cont_image/output_162_0.png" alt="png" /></p>

<div class="language-python highlighter-rouge"><div class="highlight"><pre class="highlight"><code><span class="n">create_pie_plot</span><span class="p">(</span><span class="n">cc_train_copy</span><span class="p">,</span><span class="s">'Has a phone'</span><span class="p">)</span>
</code></pre></div></div>

<p><img src="/blog/assets/post_cont_image/output_163_0.png" alt="png" /></p>

<h3>Has an email</h3>

<p>Interestingly, more than 90 % of applicants don’t have an email</p>

<p>Note: Here, 0 is no and 1 is yes</p>

<div class="language-python highlighter-rouge"><div class="highlight"><pre class="highlight"><code><span class="n">gen_info_feat</span><span class="p">(</span><span class="n">cc_train_copy</span><span class="p">,</span><span class="s">'Has an email'</span><span class="p">)</span>
</code></pre></div></div>

<div class="language-plaintext highlighter-rouge"><div class="highlight"><pre class="highlight"><code>Description:
count   29165.00
mean        0.09
std         0.29
min         0.00
25%         0.00
50%         0.00
75%         0.00
max         1.00
Name: Has an email, dtype: float64
**************************************************
Object type:
int64
**************************************************
Value count:
   Count  Frequency (%)
0  26532          90.97
1   2633           9.03
</code></pre></div></div>

<div class="language-python highlighter-rouge"><div class="highlight"><pre class="highlight"><code><span class="n">create_bar_plot</span><span class="p">(</span><span class="n">cc_train_copy</span><span class="p">,</span><span class="s">'Has an email'</span><span class="p">)</span>
</code></pre></div></div>

<p><img src="/blog/assets/post_cont_image/output_167_0.png" alt="png" /></p>

<div class="language-python highlighter-rouge"><div class="highlight"><pre class="highlight"><code><span class="n">create_pie_plot</span><span class="p">(</span><span class="n">cc_train_copy</span><span class="p">,</span><span class="s">'Has an email'</span><span class="p">)</span>
</code></pre></div></div>

<p><img src="/blog/assets/post_cont_image/output_168_0.png" alt="png" /></p>

<h3>Account age</h3>

<p>Most accounts are 26 months old. The account age feature is not normally distributed; it is positively skewed. Another observation is that, on average, bad clients’ accounts are 34 months old vs 26 months old for good clients’ accounts.</p>

<div class="language-python highlighter-rouge"><div class="highlight"><pre class="highlight"><code><span class="n">gen_info_feat</span><span class="p">(</span><span class="n">cc_train_copy</span><span class="p">,</span><span class="s">'Account age'</span><span class="p">)</span>
</code></pre></div></div>

<div class="language-plaintext highlighter-rouge"><div class="highlight"><pre class="highlight"><code>Description:
count   29165.00
mean       26.14
std        16.49
min         0.00
25%        12.00
50%        24.00
75%        39.00
max        60.00
Name: Account age, dtype: float64
**************************************************
Object type:float64
</code></pre></div></div>

<div class="language-python highlighter-rouge"><div class="highlight"><pre class="highlight"><code><span class="n">create_box_plot</span><span class="p">(</span><span class="n">cc_train_copy</span><span class="p">,</span><span class="s">'Account age'</span><span class="p">)</span>
</code></pre></div></div>

<p><img src="/blog/assets/post_cont_image/output_172_0.png" alt="png" /></p>

<div class="language-python highlighter-rouge"><div class="highlight"><pre class="highlight"><code><span class="n">create_hist_plot</span><span class="p">(</span><span class="n">cc_train_copy</span><span class="p">,</span><span class="s">'Account age'</span><span class="p">,</span> <span class="n">the_bins</span><span class="o">=</span><span class="mi">30</span><span class="p">)</span>
</code></pre></div></div>

<p><img src="/blog/assets/post_cont_image/output_173_0.png" alt="png" /></p>

<ul>
  <li>bivariate analysis with target variable</li>
</ul>

<div class="language-python highlighter-rouge"><div class="highlight"><pre class="highlight"><code><span class="n">low_high_risk_box_plot</span><span class="p">(</span><span class="n">cc_train_copy</span><span class="p">,</span><span class="s">'Account age'</span><span class="p">)</span>
</code></pre></div></div>

<div class="language-plaintext highlighter-rouge"><div class="highlight"><pre class="highlight"><code>Is high risk
0   26.00
1   34.04
Name: Account age, dtype: float64
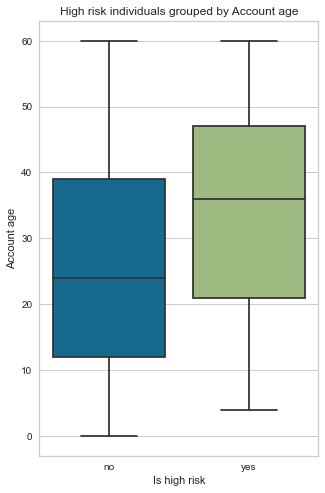
</code></pre></div></div>

<p><img src="/blog/assets/post_cont_image/output_175_1.png" alt="png" /></p>

<h3>Is high risk (target variable)</h3>

<p>Most applicants are good clients (98% of applicants). We have imbalanced data that needs to be balanced using SMOTE before training on a model.</p>

<p>Note: Here, 0 is no and 1 is yes</p>

<div class="language-python highlighter-rouge"><div class="highlight"><pre class="highlight"><code><span class="n">gen_info_feat</span><span class="p">(</span><span class="n">cc_train_copy</span><span class="p">,</span><span class="s">'Is high risk'</span><span class="p">)</span>
</code></pre></div></div>

<div class="language-plaintext highlighter-rouge"><div class="highlight"><pre class="highlight"><code>Description:
count     29165
unique        2
top           0
freq      28666
Name: Is high risk, dtype: int64
**************************************************
Object type:
object
**************************************************
Value count:
   Count  Frequency (%)
0  28666          98.29
1    499           1.71
</code></pre></div></div>

<div class="language-python highlighter-rouge"><div class="highlight"><pre class="highlight"><code><span class="n">create_bar_plot</span><span class="p">(</span><span class="n">cc_train_copy</span><span class="p">,</span><span class="s">'Is high risk'</span><span class="p">)</span>
</code></pre></div></div>

<p><img src="/blog/assets/post_cont_image/output_179_0.png" alt="png" /></p>

<div class="language-python highlighter-rouge"><div class="highlight"><pre class="highlight"><code><span class="n">create_pie_plot</span><span class="p">(</span><span class="n">cc_train_copy</span><span class="p">,</span><span class="s">'Is high risk'</span><span class="p">)</span>
</code></pre></div></div>

<p><img src="/blog/assets/post_cont_image/output_180_0.png" alt="png" /></p>

<h3>Bivariate analysis</h3>

<p>Now that we have finished our univariate analysis let’s look into the bivariate analysis. Bivariate analysis, as the name implies, is the analysis of two features compared with each other. First, we will do a bivariate analysis of numerical features.</p>

<p>Looking at the pairplot (scatter plots of pairwise relationships in a dataset), we can see a positive linear correlation between the family member and the children’s count. It makes sense; the more children someone has, the larger the family member count. It is a multicollinearity problem (two highly correlated features) which is not ideal for training a model. We will need to drop one of them.</p>

<p>Another trend is the Employment length and age. It also makes sense; the longer the employment length, the older someone is.</p>

<div class="language-python highlighter-rouge"><div class="highlight"><pre class="highlight"><code><span class="c1"># drop categorical features, do a pairplot of the remaining feature numerical feature
</span><span class="n">sns</span><span class="p">.</span><span class="n">pairplot</span><span class="p">(</span><span class="n">cc_train_copy</span><span class="p">[</span><span class="n">cc_train_copy</span><span class="p">[</span><span class="s">'Employment length'</span><span class="p">]</span> <span class="o">&lt;</span> <span class="mi">0</span><span class="p">].</span><span class="n">drop</span><span class="p">([</span><span class="s">'ID'</span><span class="p">,</span><span class="s">'Has a mobile phone'</span><span class="p">,</span> <span class="s">'Has a work phone'</span><span class="p">,</span> <span class="s">'Has a phone'</span><span class="p">,</span> <span class="s">'Has an email'</span><span class="p">,</span><span class="s">'Is high risk'</span><span class="p">],</span><span class="n">axis</span><span class="o">=</span><span class="mi">1</span><span class="p">),</span><span class="n">corner</span><span class="o">=</span><span class="bp">True</span><span class="p">)</span>
<span class="n">plt</span><span class="p">.</span><span class="n">show</span><span class="p">()</span>
</code></pre></div></div>

<p><img src="/blog/assets/post_cont_image/output_184_0.png" alt="png" /></p>

<p>Now let’s look at the two interesting scatter plots.</p>

<p>We will start with the family member count vs children count. Of course, the more children a person has, the larger the family count. We added a line of best fit, also called the regression line, and you can read more about it in this blog post <a href="https://semasuka.github.io/blog/2021/04/04/demystify-machine-learning.html">here</a>.</p>

<div class="language-python highlighter-rouge"><div class="highlight"><pre class="highlight"><code><span class="n">sns</span><span class="p">.</span><span class="n">regplot</span><span class="p">(</span><span class="n">x</span><span class="o">=</span><span class="s">'Children count'</span><span class="p">,</span><span class="n">y</span><span class="o">=</span><span class="s">'Family member count'</span><span class="p">,</span><span class="n">data</span><span class="o">=</span><span class="n">cc_train_copy</span><span class="p">,</span><span class="n">line_kws</span><span class="o">=</span><span class="p">{</span><span class="s">'color'</span><span class="p">:</span> <span class="s">'red'</span><span class="p">})</span>
<span class="n">plt</span><span class="p">.</span><span class="n">show</span><span class="p">()</span>
</code></pre></div></div>

<p><img src="/blog/assets/post_cont_image/output_186_0.png" alt="png" /></p>

<p>When we compare the employment length and age, the scatterplot shows a trend between the age and the length of employment.</p>

<p>It is shaped like a reversed triangle because the applicants’ age increases with the employment length. You can’t have an employment length that is superior to the age. Right?</p>

<div class="language-python highlighter-rouge"><div class="highlight"><pre class="highlight"><code><span class="n">y_age</span> <span class="o">=</span> <span class="n">np</span><span class="p">.</span><span class="nb">abs</span><span class="p">(</span><span class="n">cc_train_copy</span><span class="p">[</span><span class="s">'Age'</span><span class="p">])</span><span class="o">/</span><span class="mf">365.25</span>
<span class="n">x_employ_length</span> <span class="o">=</span> <span class="n">np</span><span class="p">.</span><span class="nb">abs</span><span class="p">(</span>
    <span class="n">cc_train_copy</span><span class="p">[</span><span class="n">cc_train_copy</span><span class="p">[</span><span class="s">'Employment length'</span><span class="p">]</span> <span class="o">&lt;</span> <span class="mi">0</span><span class="p">][</span><span class="s">'Employment length'</span><span class="p">])</span><span class="o">/</span><span class="mf">365.25</span>
<span class="n">fig</span><span class="p">,</span> <span class="n">ax</span> <span class="o">=</span> <span class="n">plt</span><span class="p">.</span><span class="n">subplots</span><span class="p">(</span><span class="n">figsize</span><span class="o">=</span><span class="p">(</span><span class="mi">12</span><span class="p">,</span> <span class="mi">8</span><span class="p">))</span>
<span class="n">sns</span><span class="p">.</span><span class="n">scatterplot</span><span class="p">(</span><span class="n">x_employ_length</span><span class="p">,</span> <span class="n">y_age</span><span class="p">,</span> <span class="n">alpha</span><span class="o">=</span><span class="p">.</span><span class="mi">05</span><span class="p">)</span>
<span class="c1"># change the frequency of the x-axis and y-axis labels
</span><span class="n">plt</span><span class="p">.</span><span class="n">xticks</span><span class="p">(</span><span class="n">np</span><span class="p">.</span><span class="n">arange</span><span class="p">(</span><span class="mi">0</span><span class="p">,</span> <span class="n">x_employ_length</span><span class="p">.</span><span class="nb">max</span><span class="p">(),</span> <span class="mf">2.5</span><span class="p">))</span>
<span class="n">plt</span><span class="p">.</span><span class="n">yticks</span><span class="p">(</span><span class="n">np</span><span class="p">.</span><span class="n">arange</span><span class="p">(</span><span class="mi">20</span><span class="p">,</span> <span class="n">y_age</span><span class="p">.</span><span class="nb">max</span><span class="p">(),</span> <span class="mi">5</span><span class="p">))</span>
<span class="n">plt</span><span class="p">.</span><span class="n">show</span><span class="p">()</span>

</code></pre></div></div>

<div class="language-plaintext highlighter-rouge"><div class="highlight"><pre class="highlight"><code>/Users/sternsemasuka/opt/anaconda3/lib/python3.9/site-packages/seaborn/_decorators.py:36: FutureWarning: Pass the following variables as keyword args: x, y. From version 0.12, the only valid positional argument will be `data`, and passing other arguments without an explicit keyword will result in an error or misinterpretation.
  warnings.warn(
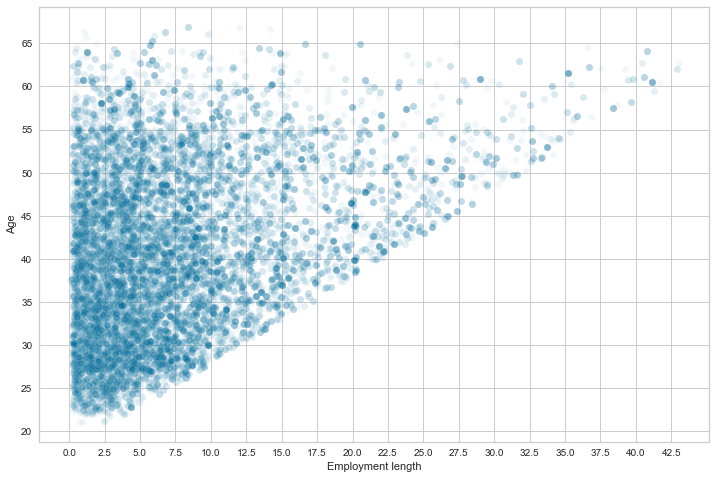
</code></pre></div></div>

<p><img src="/blog/assets/post_cont_image/output_188_1.png" alt="png" /></p>

<p>Now comparing account age and applicant age, we can see that most applicants are between 20 and 45 years old and have an account less than 25 months old. This information is deduced from darker blue hexagons (high-density area) between 22 and 43 on the Y axis and between 3 and 28 on the X axis.</p>

<div class="language-python highlighter-rouge"><div class="highlight"><pre class="highlight"><code><span class="n">sns</span><span class="p">.</span><span class="n">jointplot</span><span class="p">(</span><span class="n">np</span><span class="p">.</span><span class="nb">abs</span><span class="p">(</span><span class="n">cc_train_copy</span><span class="p">[</span><span class="s">'Account age'</span><span class="p">]),</span><span class="n">y_age</span><span class="p">,</span> <span class="n">kind</span><span class="o">=</span><span class="s">"hex"</span><span class="p">,</span> <span class="n">height</span><span class="o">=</span><span class="mi">12</span><span class="p">)</span>
<span class="n">plt</span><span class="p">.</span><span class="n">yticks</span><span class="p">(</span><span class="n">np</span><span class="p">.</span><span class="n">arange</span><span class="p">(</span><span class="mi">20</span><span class="p">,</span> <span class="n">y_age</span><span class="p">.</span><span class="nb">max</span><span class="p">(),</span> <span class="mi">5</span><span class="p">))</span>
<span class="n">plt</span><span class="p">.</span><span class="n">xticks</span><span class="p">(</span><span class="n">np</span><span class="p">.</span><span class="n">arange</span><span class="p">(</span><span class="mi">0</span><span class="p">,</span> <span class="mi">65</span><span class="p">,</span> <span class="mi">5</span><span class="p">))</span>
<span class="n">plt</span><span class="p">.</span><span class="n">ylabel</span><span class="p">(</span><span class="s">'Age'</span><span class="p">)</span>
<span class="n">plt</span><span class="p">.</span><span class="n">show</span><span class="p">()</span>
</code></pre></div></div>

<div class="language-plaintext highlighter-rouge"><div class="highlight"><pre class="highlight"><code>/Users/sternsemasuka/opt/anaconda3/lib/python3.9/site-packages/seaborn/_decorators.py:36: FutureWarning: Pass the following variables as keyword args: x, y. From version 0.12, the only valid positional argument will be `data`, and passing other arguments without an explicit keyword will result in an error or misinterpretation.
  warnings.warn(
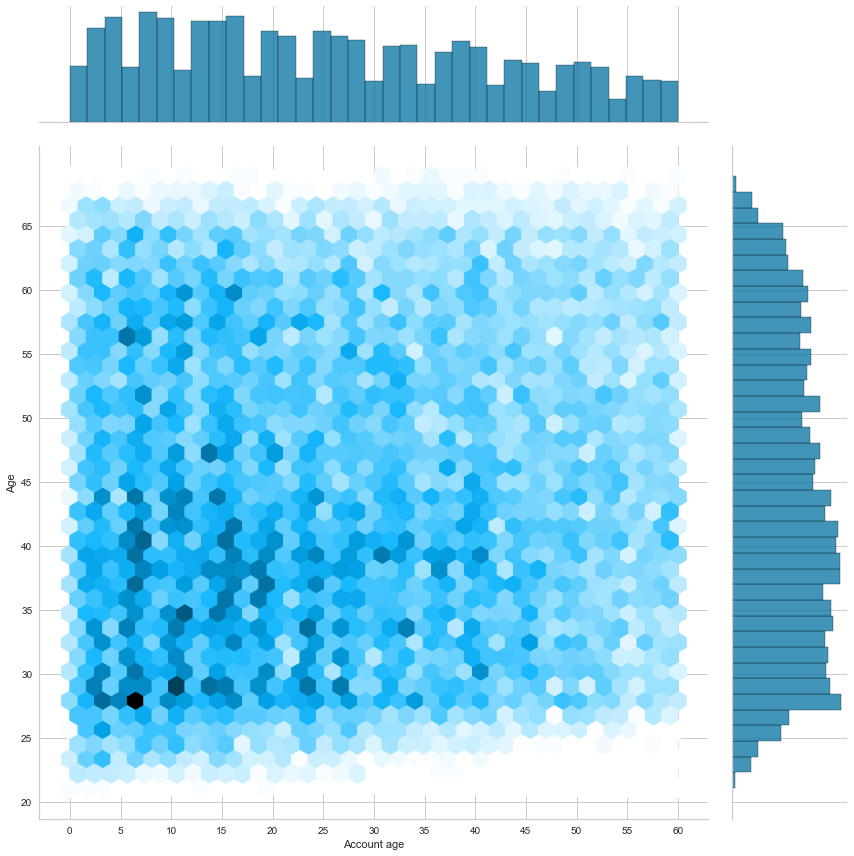
</code></pre></div></div>

<p><img src="/blog/assets/post_cont_image/output_190_1.png" alt="png" /></p>

<h3>Heatmap</h3>

<p>Time to do a correlation between all the numerical features using a heatmap. This heatmap shows the correlation between all the numerical features; the darker the cell, the more correlated the two features are, and the lighter the color, the less correlated the two features.</p>

<p>No feature is correlated with the target feature (Which is high risk). We see a strong correlation (0.89) between family member count and children count, as previously seen with the pairplot (The more children a person has, the larger the family count). Age has some positive correlation (0.30) with the family member count and children count. The older a person is, the most likely they will have a larger family and consequently more children.</p>

<p>Another positive correlation (0.31) is having a phone and having a work phone. We have a slightly positive correlation between age and work phone(0.18); younger people will be less likely to own a work phone. As previously discussed, we also have a negative  (-0.62) between employment length and age.</p>

<div class="language-python highlighter-rouge"><div class="highlight"><pre class="highlight"><code><span class="c1"># change the datatype of the target feature to int
</span><span class="n">is_high_risk_int</span> <span class="o">=</span> <span class="n">cc_train_copy</span><span class="p">[</span><span class="s">'Is high risk'</span><span class="p">].</span><span class="n">astype</span><span class="p">(</span><span class="s">'int32'</span><span class="p">)</span>
</code></pre></div></div>

<div class="language-python highlighter-rouge"><div class="highlight"><pre class="highlight"><code><span class="c1"># correlation analysis with heatmap, after dropping the has a mobile phone with the target feature as int
</span><span class="n">cc_train_copy_corr_no_mobile</span> <span class="o">=</span> <span class="n">pd</span><span class="p">.</span><span class="n">concat</span><span class="p">([</span><span class="n">cc_train_copy</span><span class="p">.</span><span class="n">drop</span><span class="p">([</span><span class="s">'Has a mobile phone'</span><span class="p">,</span><span class="s">'Is high risk'</span><span class="p">],</span> <span class="n">axis</span><span class="o">=</span><span class="mi">1</span><span class="p">),</span><span class="n">is_high_risk_int</span><span class="p">],</span><span class="n">axis</span><span class="o">=</span><span class="mi">1</span><span class="p">).</span><span class="n">corr</span><span class="p">()</span>
<span class="c1"># Get the lower triangle of the correlation matrix
# Generate a mask for the upper triangle
</span><span class="n">mask</span> <span class="o">=</span> <span class="n">np</span><span class="p">.</span><span class="n">zeros_like</span><span class="p">(</span><span class="n">cc_train_copy_corr_no_mobile</span><span class="p">,</span> <span class="n">dtype</span><span class="o">=</span><span class="s">'bool'</span><span class="p">)</span>
<span class="n">mask</span><span class="p">[</span><span class="n">np</span><span class="p">.</span><span class="n">triu_indices_from</span><span class="p">(</span><span class="n">mask</span><span class="p">)]</span> <span class="o">=</span> <span class="bp">True</span>
<span class="c1"># Set up the matplotlib figure
</span><span class="n">fig</span><span class="p">,</span> <span class="n">ax</span> <span class="o">=</span> <span class="n">plt</span><span class="p">.</span><span class="n">subplots</span><span class="p">(</span><span class="n">figsize</span><span class="o">=</span><span class="p">(</span><span class="mi">18</span><span class="p">,</span><span class="mi">10</span><span class="p">))</span>
<span class="c1"># seaborn heatmap
</span><span class="n">sns</span><span class="p">.</span><span class="n">heatmap</span><span class="p">(</span><span class="n">cc_train_copy_corr_no_mobile</span><span class="p">,</span> <span class="n">annot</span><span class="o">=</span><span class="bp">True</span><span class="p">,</span> <span class="n">cmap</span><span class="o">=</span><span class="s">'flare'</span><span class="p">,</span><span class="n">mask</span><span class="o">=</span><span class="n">mask</span><span class="p">,</span> <span class="n">linewidths</span><span class="o">=</span><span class="p">.</span><span class="mi">5</span><span class="p">)</span>
<span class="c1"># plot the heatmap
</span><span class="n">plt</span><span class="p">.</span><span class="n">show</span><span class="p">()</span>
</code></pre></div></div>

<p><img src="/blog/assets/post_cont_image/output_194_0.png" alt="png" /></p>

<h3>ANOVA</h3>

<p>Now, let’s do an ANOVA (analysis of variance) between age and other categorical features.</p>

<p>But before we proceed, what is an ANOVA? ANOVA tells you if there are any statistical differences between the means of two or more independent features (categorical features).</p>

<p>Now, let’s use box plots to compare age’s mean and different categorical features. Female applicants are older than their male counterparts, and those who don’t own a car with property owners tend to be older. Of course, the pensioners are older than those working (We also see that some have pensioned at a young age, those are outliers).</p>

<p>It is also interesting to see that those with an academic degree are generally younger than the other groups. The widows tend to be much older, with some young outliers in their 30s. Unsurprisingly, those who live with their parents tend to be younger, and we also see some outliers here. Lastly, those who work as cleaning staff tend to be older, while those who work in IT tend to be younger.</p>

<div class="language-python highlighter-rouge"><div class="highlight"><pre class="highlight"><code><span class="n">fig</span><span class="p">,</span> <span class="n">axes</span> <span class="o">=</span> <span class="n">plt</span><span class="p">.</span><span class="n">subplots</span><span class="p">(</span><span class="mi">4</span><span class="p">,</span><span class="mi">2</span><span class="p">,</span><span class="n">figsize</span><span class="o">=</span><span class="p">(</span><span class="mi">15</span><span class="p">,</span><span class="mi">20</span><span class="p">),</span><span class="n">dpi</span><span class="o">=</span><span class="mi">180</span><span class="p">)</span>
<span class="n">fig</span><span class="p">.</span><span class="n">tight_layout</span><span class="p">(</span><span class="n">pad</span><span class="o">=</span><span class="mf">5.0</span><span class="p">)</span>
<span class="n">cat_features</span> <span class="o">=</span> <span class="p">[</span><span class="s">'Gender'</span><span class="p">,</span> <span class="s">'Has a car'</span><span class="p">,</span> <span class="s">'Has a property'</span><span class="p">,</span> <span class="s">'Employment status'</span><span class="p">,</span> <span class="s">'Education level'</span><span class="p">,</span> <span class="s">'Marital status'</span><span class="p">,</span> <span class="s">'Dwelling'</span><span class="p">,</span> <span class="s">'Job title'</span><span class="p">]</span>
<span class="k">for</span> <span class="n">cat_ft_count</span><span class="p">,</span> <span class="n">ax</span> <span class="ow">in</span> <span class="nb">enumerate</span><span class="p">(</span><span class="n">axes</span><span class="p">):</span>
    <span class="k">for</span> <span class="n">row_count</span> <span class="ow">in</span> <span class="nb">range</span><span class="p">(</span><span class="mi">4</span><span class="p">):</span>
        <span class="k">for</span> <span class="n">feat_count</span> <span class="ow">in</span> <span class="nb">range</span><span class="p">(</span><span class="mi">2</span><span class="p">):</span>
            <span class="n">sns</span><span class="p">.</span><span class="n">boxplot</span><span class="p">(</span><span class="n">ax</span><span class="o">=</span><span class="n">axes</span><span class="p">[</span><span class="n">row_count</span><span class="p">,</span><span class="n">feat_count</span><span class="p">],</span><span class="n">x</span><span class="o">=</span><span class="n">cc_train_copy</span><span class="p">[</span><span class="n">cat_features</span><span class="p">[</span><span class="n">cat_ft_count</span><span class="p">]],</span><span class="n">y</span><span class="o">=</span><span class="n">np</span><span class="p">.</span><span class="nb">abs</span><span class="p">(</span><span class="n">cc_train_copy</span><span class="p">[</span><span class="s">'Age'</span><span class="p">])</span><span class="o">/</span><span class="mf">365.25</span><span class="p">)</span>
            <span class="n">axes</span><span class="p">[</span><span class="n">row_count</span><span class="p">,</span><span class="n">feat_count</span><span class="p">].</span><span class="n">set_title</span><span class="p">(</span><span class="n">cat_features</span><span class="p">[</span><span class="n">cat_ft_count</span><span class="p">]</span> <span class="o">+</span> <span class="s">" vs age"</span><span class="p">)</span>
            <span class="n">plt</span><span class="p">.</span><span class="n">sca</span><span class="p">(</span><span class="n">axes</span><span class="p">[</span><span class="n">row_count</span><span class="p">,</span><span class="n">feat_count</span><span class="p">])</span>
            <span class="n">plt</span><span class="p">.</span><span class="n">xticks</span><span class="p">(</span><span class="n">rotation</span><span class="o">=</span><span class="mi">45</span><span class="p">,</span><span class="n">ha</span><span class="o">=</span><span class="s">'right'</span><span class="p">)</span>
            <span class="n">plt</span><span class="p">.</span><span class="n">ylabel</span><span class="p">(</span><span class="s">'Age'</span><span class="p">)</span>
            <span class="n">cat_ft_count</span> <span class="o">+=</span> <span class="mi">1</span>
    <span class="k">break</span>
</code></pre></div></div>

<p><img src="/blog/assets/post_cont_image/output_197_0.png" alt="png" /></p>

<p>Now let’s turn our attention to employment length versus categorical features. The only interesting observation is that state-employed and medical staff applicants tend to have been employed longer than the rest.</p>

<div class="language-python highlighter-rouge"><div class="highlight"><pre class="highlight"><code><span class="n">fig</span><span class="p">,</span> <span class="n">axes</span> <span class="o">=</span> <span class="n">plt</span><span class="p">.</span><span class="n">subplots</span><span class="p">(</span><span class="mi">4</span><span class="p">,</span><span class="mi">2</span><span class="p">,</span><span class="n">figsize</span><span class="o">=</span><span class="p">(</span><span class="mi">15</span><span class="p">,</span><span class="mi">20</span><span class="p">),</span><span class="n">dpi</span><span class="o">=</span><span class="mi">180</span><span class="p">)</span>
<span class="n">fig</span><span class="p">.</span><span class="n">tight_layout</span><span class="p">(</span><span class="n">pad</span><span class="o">=</span><span class="mf">5.0</span><span class="p">)</span>

<span class="k">for</span> <span class="n">cat_ft_count</span><span class="p">,</span> <span class="n">ax</span> <span class="ow">in</span> <span class="nb">enumerate</span><span class="p">(</span><span class="n">axes</span><span class="p">):</span>
    <span class="k">for</span> <span class="n">row_count</span> <span class="ow">in</span> <span class="nb">range</span><span class="p">(</span><span class="mi">4</span><span class="p">):</span>
        <span class="k">for</span> <span class="n">feat_count</span> <span class="ow">in</span> <span class="nb">range</span><span class="p">(</span><span class="mi">2</span><span class="p">):</span>
            <span class="n">sns</span><span class="p">.</span><span class="n">boxplot</span><span class="p">(</span><span class="n">ax</span><span class="o">=</span><span class="n">axes</span><span class="p">[</span><span class="n">row_count</span><span class="p">,</span><span class="n">feat_count</span><span class="p">],</span><span class="n">x</span><span class="o">=</span><span class="n">cc_train_copy</span><span class="p">[</span><span class="n">cat_features</span><span class="p">[</span><span class="n">cat_ft_count</span><span class="p">]],</span><span class="n">y</span><span class="o">=</span><span class="n">np</span><span class="p">.</span><span class="nb">abs</span><span class="p">(</span><span class="n">cc_train_copy</span><span class="p">[</span><span class="n">cc_train_copy</span><span class="p">[</span><span class="s">'Employment length'</span><span class="p">]</span> <span class="o">&lt;</span> <span class="mi">0</span><span class="p">][</span><span class="s">'Employment length'</span><span class="p">])</span><span class="o">/</span><span class="mf">365.25</span><span class="p">)</span>
            <span class="n">axes</span><span class="p">[</span><span class="n">row_count</span><span class="p">,</span><span class="n">feat_count</span><span class="p">].</span><span class="n">set_title</span><span class="p">(</span><span class="n">cat_features</span><span class="p">[</span><span class="n">cat_ft_count</span><span class="p">]</span> <span class="o">+</span> <span class="s">" vs employment length"</span><span class="p">)</span>
            <span class="n">plt</span><span class="p">.</span><span class="n">sca</span><span class="p">(</span><span class="n">axes</span><span class="p">[</span><span class="n">row_count</span><span class="p">,</span><span class="n">feat_count</span><span class="p">])</span>
            <span class="n">plt</span><span class="p">.</span><span class="n">ylabel</span><span class="p">(</span><span class="s">'Employment length'</span><span class="p">)</span>
            <span class="n">plt</span><span class="p">.</span><span class="n">xticks</span><span class="p">(</span><span class="n">rotation</span><span class="o">=</span><span class="mi">45</span><span class="p">,</span><span class="n">ha</span><span class="o">=</span><span class="s">'right'</span><span class="p">)</span>
            <span class="n">cat_ft_count</span> <span class="o">+=</span> <span class="mi">1</span>
    <span class="k">break</span>
</code></pre></div></div>

<p><img src="/blog/assets/post_cont_image/output_199_0.png" alt="png" /></p>

<h3>Applicant general profile</h3>

<p>After analyzing each feature, we can create a typical credit card applicant profile. Here is the profile:</p>

<ul>
  <li><strong><em>Typical profile of an applicant is a Female in her early 40’s, married with a partner and no child. She has been employed for five years with a salary of 157500. She has completed her secondary education. She does not own a car but owns a property (a house/ apartment). Her account is 26 months old.</em></strong></li>
  <li><strong><em>Age and income do not have any effects on the target variable</em></strong></li>
  <li><strong><em>Those flagged as bad clients tend to have a shorter employment length and older accounts. They also constitute less than 2% of total applicants.</em></strong></li>
  <li><strong><em>Most applicants are 20 to 45 years old and have an account that is 30 months old or less.</em></strong></li>
</ul>

<h3>3. Prepare the data</h3>

<p>Using EDA, here is a list of all the transformations that need to be done on each feature:</p>

<p>ID:</p>
<ul>
  <li>Drop the feature</li>
</ul>

<p>Gender:</p>
<ul>
  <li>One hot encoding</li>
</ul>

<p>Age:</p>
<ul>
  <li>Min-max scaling</li>
  <li>Fix skewness</li>
  <li>Absolute values and divide by 365.25</li>
</ul>

<p>Marital status:</p>
<ul>
  <li>One hot encoding</li>
</ul>

<p>Family member count</p>
<ul>
  <li>Fix outliers</li>
</ul>

<p>Children count</p>
<ul>
  <li>Fix outliers</li>
  <li>Drop feature</li>
</ul>

<p>Dwelling type</p>
<ul>
  <li>One hot encoding</li>
</ul>

<p>Income</p>
<ul>
  <li>Remove outliers</li>
  <li>Fix skewness</li>
  <li>Min-max scaling</li>
</ul>

<p>Job title</p>
<ul>
  <li>One hot encoding</li>
  <li>Impute missing values</li>
</ul>

<p>Employment status:</p>
<ul>
  <li>One hot encoding</li>
</ul>

<p>Education level:</p>
<ul>
  <li>Ordinal encoding</li>
</ul>

<p>Employment length:</p>
<ul>
  <li>Remove outliers</li>
  <li>Min-max scaling</li>
  <li>Absolute values and divide by 365.25</li>
  <li>change days of employment of retirees to 0</li>
</ul>

<p>Has a car:</p>
<ul>
  <li>Change it to numerical</li>
  <li>One-hot encoding</li>
</ul>

<p>Has a property:</p>
<ul>
  <li>Change it to numerical</li>
  <li>One-hot encoding</li>
</ul>

<p>Has a mobile phone:</p>
<ul>
  <li>Drop feature</li>
</ul>

<p>Has a work phone:</p>
<ul>
  <li>One-hot encoding</li>
</ul>

<p>Has a phone:</p>
<ul>
  <li>One-hot encoding</li>
</ul>

<p>Has an email:</p>
<ul>
  <li>One-hot encoding</li>
</ul>

<p>Account age:</p>
<ul>
  <li>Drop feature</li>
</ul>

<p>Is high risk(Target):</p>
<ul>
  <li>Change the data type to numerical</li>
  <li>balance the data with SMOTE</li>
</ul>

<h3>Data Cleaning</h3>

<p>Here we are creating a class to handle outliers. But why do we have to remove the outliers?</p>

<p>Outliers are data points that differ significantly from other observations in the dataset. Outliers can spoil and mislead the training process resulting in longer training times, less accurate models and ultimately poorer results, which means that outliers must remove from the dataset.</p>

<p>This class will remove outliers more or less than 3 inter-quantile ranges away from the mean. This class will be the first class in the scikit-learn <code class="language-plaintext highlighter-rouge">Pipeline</code> to call.</p>

<p>Note: Refer to this picture below to understand IQR. In the image below, 1.5 IQR is used; in our case, we use 3 IQR, which is more sensitive to extreme outliers than 1.5 IQR.</p>

<p><img src="/blog/assets/post_cont_image/iqr.png" alt="iqr" /></p>

<p>Image credit: <a href="https://www.researchgate.net/figure/Interquartile-range-IQR-projection-on-a-normally-distributed-density-The-median-of-IQR_fig2_340969321">Research gate</a></p>

<div class="language-python highlighter-rouge"><div class="highlight"><pre class="highlight"><code><span class="k">class</span> <span class="nc">OutlierRemover</span><span class="p">(</span><span class="n">BaseEstimator</span><span class="p">,</span> <span class="n">TransformerMixin</span><span class="p">):</span>
    <span class="k">def</span> <span class="nf">__init__</span><span class="p">(</span><span class="bp">self</span><span class="p">,</span><span class="n">feat_with_outliers</span> <span class="o">=</span> <span class="p">[</span><span class="s">'Family member count'</span><span class="p">,</span><span class="s">'Income'</span><span class="p">,</span> <span class="s">'Employment length'</span><span class="p">]):</span>
        <span class="c1"># initializing the instance of the object
</span>        <span class="bp">self</span><span class="p">.</span><span class="n">feat_with_outliers</span> <span class="o">=</span> <span class="n">feat_with_outliers</span>
    <span class="k">def</span> <span class="nf">fit</span><span class="p">(</span><span class="bp">self</span><span class="p">,</span><span class="n">df</span><span class="p">):</span>
        <span class="k">return</span> <span class="bp">self</span>
    <span class="k">def</span> <span class="nf">transform</span><span class="p">(</span><span class="bp">self</span><span class="p">,</span><span class="n">df</span><span class="p">):</span>
        <span class="c1"># check if the feature in part of the dataset's features
</span>        <span class="k">if</span> <span class="p">(</span><span class="nb">set</span><span class="p">(</span><span class="bp">self</span><span class="p">.</span><span class="n">feat_with_outliers</span><span class="p">).</span><span class="n">issubset</span><span class="p">(</span><span class="n">df</span><span class="p">.</span><span class="n">columns</span><span class="p">)):</span>
            <span class="c1"># 25% quantile
</span>            <span class="n">Q1</span> <span class="o">=</span> <span class="n">df</span><span class="p">[</span><span class="bp">self</span><span class="p">.</span><span class="n">feat_with_outliers</span><span class="p">].</span><span class="n">quantile</span><span class="p">(.</span><span class="mi">25</span><span class="p">)</span>
            <span class="c1"># 75% quantile
</span>            <span class="n">Q3</span> <span class="o">=</span> <span class="n">df</span><span class="p">[</span><span class="bp">self</span><span class="p">.</span><span class="n">feat_with_outliers</span><span class="p">].</span><span class="n">quantile</span><span class="p">(.</span><span class="mi">75</span><span class="p">)</span>
            <span class="n">IQR</span> <span class="o">=</span> <span class="n">Q3</span> <span class="o">-</span> <span class="n">Q1</span>
            <span class="c1"># keep the data within 3 IQR only and discard the rest
</span>            <span class="n">df</span> <span class="o">=</span> <span class="n">df</span><span class="p">[</span><span class="o">~</span><span class="p">((</span><span class="n">df</span><span class="p">[</span><span class="bp">self</span><span class="p">.</span><span class="n">feat_with_outliers</span><span class="p">]</span> <span class="o">&lt;</span> <span class="p">(</span><span class="n">Q1</span> <span class="o">-</span> <span class="mi">3</span> <span class="o">*</span> <span class="n">IQR</span><span class="p">))</span> <span class="o">|</span><span class="p">(</span><span class="n">df</span><span class="p">[</span><span class="bp">self</span><span class="p">.</span><span class="n">feat_with_outliers</span><span class="p">]</span> <span class="o">&gt;</span> <span class="p">(</span><span class="n">Q3</span> <span class="o">+</span> <span class="mi">3</span> <span class="o">*</span> <span class="n">IQR</span><span class="p">))).</span><span class="nb">any</span><span class="p">(</span><span class="n">axis</span><span class="o">=</span><span class="mi">1</span><span class="p">)]</span>
            <span class="k">return</span> <span class="n">df</span>
        <span class="k">else</span><span class="p">:</span>
            <span class="k">print</span><span class="p">(</span><span class="s">"One or more features are not in the dataframe"</span><span class="p">)</span>
            <span class="k">return</span> <span class="n">df</span>
</code></pre></div></div>

<h3>Feature selection</h3>

<p>Next is feature selection; here, we will drop the features that we judge are not useful in our prediction. Note this is not a feature selection based on the model coefficients or feature importance; it is purely based on logic.</p>

<p>The features to be dropped are <code class="language-plaintext highlighter-rouge">ID</code>, <code class="language-plaintext highlighter-rouge">has a mobile phone</code>, <code class="language-plaintext highlighter-rouge">children count</code>, <code class="language-plaintext highlighter-rouge">job title</code>, <code class="language-plaintext highlighter-rouge">account age</code>.</p>

<p>Now the next question is, why are we dropping these features?</p>

<ul>
  <li>ID: ID is not helpful for prediction, it helped us when we were merging the two datasets, but after that, there is no need to keep it.</li>
  <li>Has a mobile phone: Since everyone has a mobile phone, this feature does not inform us about anything and is useless for the model.</li>
  <li>Children count: is highly correlated with Family member count, and to avoid multicollinearity, we will drop it.</li>
  <li>Job title: Has some missing values and the count of each category is not very different to justify using the mode to fill the missing values. So we drop it.</li>
  <li>Account age: Because Account age is used to create the target, reusing it will make our model overfit. Plus, this information is unknown while applying for a credit card and is not a predictor feature.</li>
</ul>

<div class="language-python highlighter-rouge"><div class="highlight"><pre class="highlight"><code><span class="k">class</span> <span class="nc">DropFeatures</span><span class="p">(</span><span class="n">BaseEstimator</span><span class="p">,</span><span class="n">TransformerMixin</span><span class="p">):</span>
    <span class="k">def</span> <span class="nf">__init__</span><span class="p">(</span><span class="bp">self</span><span class="p">,</span><span class="n">feature_to_drop</span> <span class="o">=</span> <span class="p">[</span><span class="s">'ID'</span><span class="p">,</span><span class="s">'Has a mobile phone'</span><span class="p">,</span><span class="s">'Children count'</span><span class="p">,</span><span class="s">'Job title'</span><span class="p">,</span><span class="s">'Account age'</span><span class="p">]):</span>
        <span class="bp">self</span><span class="p">.</span><span class="n">feature_to_drop</span> <span class="o">=</span> <span class="n">feature_to_drop</span>
    <span class="k">def</span> <span class="nf">fit</span><span class="p">(</span><span class="bp">self</span><span class="p">,</span><span class="n">df</span><span class="p">):</span>
        <span class="k">return</span> <span class="bp">self</span>
    <span class="k">def</span> <span class="nf">transform</span><span class="p">(</span><span class="bp">self</span><span class="p">,</span><span class="n">df</span><span class="p">):</span>
        <span class="k">if</span> <span class="p">(</span><span class="nb">set</span><span class="p">(</span><span class="bp">self</span><span class="p">.</span><span class="n">feature_to_drop</span><span class="p">).</span><span class="n">issubset</span><span class="p">(</span><span class="n">df</span><span class="p">.</span><span class="n">columns</span><span class="p">)):</span>
            <span class="c1"># drop the list of features
</span>            <span class="n">df</span><span class="p">.</span><span class="n">drop</span><span class="p">(</span><span class="bp">self</span><span class="p">.</span><span class="n">feature_to_drop</span><span class="p">,</span><span class="n">axis</span><span class="o">=</span><span class="mi">1</span><span class="p">,</span><span class="n">inplace</span><span class="o">=</span><span class="bp">True</span><span class="p">)</span>
            <span class="k">return</span> <span class="n">df</span>
        <span class="k">else</span><span class="p">:</span>
            <span class="k">print</span><span class="p">(</span><span class="s">"One or more features are not in the dataframe"</span><span class="p">)</span>
            <span class="k">return</span> <span class="n">df</span>
</code></pre></div></div>

<h3>Feature engineering</h3>

<p>This class will convert the features that use days (<code class="language-plaintext highlighter-rouge">Employment length</code>, <code class="language-plaintext highlighter-rouge">Age</code>) to absolute value because we can’t have negative days of employment.</p>

<div class="language-python highlighter-rouge"><div class="highlight"><pre class="highlight"><code><span class="k">class</span> <span class="nc">TimeConversionHandler</span><span class="p">(</span><span class="n">BaseEstimator</span><span class="p">,</span> <span class="n">TransformerMixin</span><span class="p">):</span>
    <span class="k">def</span> <span class="nf">__init__</span><span class="p">(</span><span class="bp">self</span><span class="p">,</span> <span class="n">feat_with_days</span> <span class="o">=</span> <span class="p">[</span><span class="s">'Employment length'</span><span class="p">,</span> <span class="s">'Age'</span><span class="p">]):</span>
        <span class="bp">self</span><span class="p">.</span><span class="n">feat_with_days</span> <span class="o">=</span> <span class="n">feat_with_days</span>
    <span class="k">def</span> <span class="nf">fit</span><span class="p">(</span><span class="bp">self</span><span class="p">,</span> <span class="n">X</span><span class="p">,</span> <span class="n">y</span><span class="o">=</span><span class="bp">None</span><span class="p">):</span>
        <span class="k">return</span> <span class="bp">self</span>
    <span class="k">def</span> <span class="nf">transform</span><span class="p">(</span><span class="bp">self</span><span class="p">,</span> <span class="n">X</span><span class="p">,</span> <span class="n">y</span><span class="o">=</span><span class="bp">None</span><span class="p">):</span>
        <span class="k">if</span> <span class="p">(</span><span class="nb">set</span><span class="p">(</span><span class="bp">self</span><span class="p">.</span><span class="n">feat_with_days</span><span class="p">).</span><span class="n">issubset</span><span class="p">(</span><span class="n">X</span><span class="p">.</span><span class="n">columns</span><span class="p">)):</span>
            <span class="c1"># convert days to absolute value using NumPy
</span>            <span class="n">X</span><span class="p">[[</span><span class="s">'Employment length'</span><span class="p">,</span><span class="s">'Age'</span><span class="p">]]</span> <span class="o">=</span> <span class="n">np</span><span class="p">.</span><span class="nb">abs</span><span class="p">(</span><span class="n">X</span><span class="p">[[</span><span class="s">'Employment length'</span><span class="p">,</span><span class="s">'Age'</span><span class="p">]])</span>
            <span class="k">return</span> <span class="n">X</span>
        <span class="k">else</span><span class="p">:</span>
            <span class="k">print</span><span class="p">(</span><span class="s">"One or more features are not in the dataframe"</span><span class="p">)</span>
            <span class="k">return</span> <span class="n">X</span>
</code></pre></div></div>

<p>The following class will convert the employment length of retirees (set to 365243) to 0 so that it is not considered an outlier.</p>

<div class="language-python highlighter-rouge"><div class="highlight"><pre class="highlight"><code><span class="k">class</span> <span class="nc">RetireeHandler</span><span class="p">(</span><span class="n">BaseEstimator</span><span class="p">,</span> <span class="n">TransformerMixin</span><span class="p">):</span>
    <span class="k">def</span> <span class="nf">__init__</span><span class="p">(</span><span class="bp">self</span><span class="p">):</span>
        <span class="k">pass</span>
    <span class="k">def</span> <span class="nf">fit</span><span class="p">(</span><span class="bp">self</span><span class="p">,</span> <span class="n">df</span><span class="p">):</span>
        <span class="k">return</span> <span class="bp">self</span>
    <span class="k">def</span> <span class="nf">transform</span><span class="p">(</span><span class="bp">self</span><span class="p">,</span> <span class="n">df</span><span class="p">):</span>
        <span class="k">if</span> <span class="s">'Employment length'</span> <span class="ow">in</span> <span class="n">df</span><span class="p">.</span><span class="n">columns</span><span class="p">:</span>
            <span class="c1"># select rows with an employment length is 365243, which corresponds to retirees
</span>            <span class="n">df_ret_idx</span> <span class="o">=</span> <span class="n">df</span><span class="p">[</span><span class="s">'Employment length'</span><span class="p">][</span><span class="n">df</span><span class="p">[</span><span class="s">'Employment length'</span><span class="p">]</span> <span class="o">==</span> <span class="mi">365243</span><span class="p">].</span><span class="n">index</span>
            <span class="c1"># set those rows with value 365243 to 0
</span>            <span class="n">df</span><span class="p">.</span><span class="n">loc</span><span class="p">[</span><span class="n">df_ret_idx</span><span class="p">,</span><span class="s">'Employment length'</span><span class="p">]</span> <span class="o">=</span> <span class="mi">0</span>
            <span class="k">return</span> <span class="n">df</span>
        <span class="k">else</span><span class="p">:</span>
            <span class="k">print</span><span class="p">(</span><span class="s">"Employment length is not in the dataframe"</span><span class="p">)</span>
            <span class="k">return</span> <span class="n">df</span>
</code></pre></div></div>

<p>Using the cubic root transformation, this class will reduce income and age distribution skewness. Skewed features negatively affect our predictive model’s performance, and machine learning models perform better with normally distributed data.</p>

<div class="language-python highlighter-rouge"><div class="highlight"><pre class="highlight"><code><span class="k">class</span> <span class="nc">SkewnessHandler</span><span class="p">(</span><span class="n">BaseEstimator</span><span class="p">,</span> <span class="n">TransformerMixin</span><span class="p">):</span>
    <span class="k">def</span> <span class="nf">__init__</span><span class="p">(</span><span class="bp">self</span><span class="p">,</span><span class="n">feat_with_skewness</span><span class="o">=</span><span class="p">[</span><span class="s">'Income'</span><span class="p">,</span><span class="s">'Age'</span><span class="p">]):</span>
        <span class="bp">self</span><span class="p">.</span><span class="n">feat_with_skewness</span> <span class="o">=</span> <span class="n">feat_with_skewness</span>
    <span class="k">def</span> <span class="nf">fit</span><span class="p">(</span><span class="bp">self</span><span class="p">,</span><span class="n">df</span><span class="p">):</span>
        <span class="k">return</span> <span class="bp">self</span>
    <span class="k">def</span> <span class="nf">transform</span><span class="p">(</span><span class="bp">self</span><span class="p">,</span><span class="n">df</span><span class="p">):</span>
        <span class="k">if</span> <span class="p">(</span><span class="nb">set</span><span class="p">(</span><span class="bp">self</span><span class="p">.</span><span class="n">feat_with_skewness</span><span class="p">).</span><span class="n">issubset</span><span class="p">(</span><span class="n">df</span><span class="p">.</span><span class="n">columns</span><span class="p">)):</span>
            <span class="c1"># Handle skewness with cubic root transformation
</span>            <span class="n">df</span><span class="p">[</span><span class="bp">self</span><span class="p">.</span><span class="n">feat_with_skewness</span><span class="p">]</span> <span class="o">=</span> <span class="n">np</span><span class="p">.</span><span class="n">cbrt</span><span class="p">(</span><span class="n">df</span><span class="p">[</span><span class="bp">self</span><span class="p">.</span><span class="n">feat_with_skewness</span><span class="p">])</span>
            <span class="k">return</span> <span class="n">df</span>
        <span class="k">else</span><span class="p">:</span>
            <span class="k">print</span><span class="p">(</span><span class="s">"One or more features are not in the dataframe"</span><span class="p">)</span>
            <span class="k">return</span> <span class="n">df</span>
</code></pre></div></div>

<p>This class will change 1 to the character “Y” and 0 to “N,” which will be more comprehensive when we do a one-hot encoding for these features <code class="language-plaintext highlighter-rouge">Has a work phone</code>, <code class="language-plaintext highlighter-rouge">Has a phone</code>, <code class="language-plaintext highlighter-rouge">Has an email</code>.</p>

<div class="language-python highlighter-rouge"><div class="highlight"><pre class="highlight"><code><span class="k">class</span> <span class="nc">BinningNumToYN</span><span class="p">(</span><span class="n">BaseEstimator</span><span class="p">,</span> <span class="n">TransformerMixin</span><span class="p">):</span>
    <span class="k">def</span> <span class="nf">__init__</span><span class="p">(</span><span class="bp">self</span><span class="p">,</span><span class="n">feat_with_num_enc</span><span class="o">=</span><span class="p">[</span><span class="s">'Has a work phone'</span><span class="p">,</span><span class="s">'Has a phone'</span><span class="p">,</span><span class="s">'Has an email'</span><span class="p">]):</span>
        <span class="bp">self</span><span class="p">.</span><span class="n">feat_with_num_enc</span> <span class="o">=</span> <span class="n">feat_with_num_enc</span>
    <span class="k">def</span> <span class="nf">fit</span><span class="p">(</span><span class="bp">self</span><span class="p">,</span><span class="n">df</span><span class="p">):</span>
        <span class="k">return</span> <span class="bp">self</span>
    <span class="k">def</span> <span class="nf">transform</span><span class="p">(</span><span class="bp">self</span><span class="p">,</span><span class="n">df</span><span class="p">):</span>
        <span class="k">if</span> <span class="p">(</span><span class="nb">set</span><span class="p">(</span><span class="bp">self</span><span class="p">.</span><span class="n">feat_with_num_enc</span><span class="p">).</span><span class="n">issubset</span><span class="p">(</span><span class="n">df</span><span class="p">.</span><span class="n">columns</span><span class="p">)):</span>
            <span class="c1"># Change 0 to N and 1 to Y for all the features in feat_with_num_enc
</span>            <span class="k">for</span> <span class="n">ft</span> <span class="ow">in</span> <span class="bp">self</span><span class="p">.</span><span class="n">feat_with_num_enc</span><span class="p">:</span>
                <span class="n">df</span><span class="p">[</span><span class="n">ft</span><span class="p">]</span> <span class="o">=</span> <span class="n">df</span><span class="p">[</span><span class="n">ft</span><span class="p">].</span><span class="nb">map</span><span class="p">({</span><span class="mi">1</span><span class="p">:</span><span class="s">'Y'</span><span class="p">,</span><span class="mi">0</span><span class="p">:</span><span class="s">'N'</span><span class="p">})</span>
            <span class="k">return</span> <span class="n">df</span>
        <span class="k">else</span><span class="p">:</span>
            <span class="k">print</span><span class="p">(</span><span class="s">"One or more features are not in the dataframe"</span><span class="p">)</span>
            <span class="k">return</span> <span class="n">df</span>
</code></pre></div></div>

<p>This class will do one-hot encoding on the categorical features, but also this class will keep the names of the features. We want to keep the feature names instead of an array without names (default) because the feature names will be used for feature importance.</p>

<div class="language-python highlighter-rouge"><div class="highlight"><pre class="highlight"><code><span class="k">class</span> <span class="nc">OneHotWithFeatNames</span><span class="p">(</span><span class="n">BaseEstimator</span><span class="p">,</span><span class="n">TransformerMixin</span><span class="p">):</span>
    <span class="k">def</span> <span class="nf">__init__</span><span class="p">(</span><span class="bp">self</span><span class="p">,</span><span class="n">one_hot_enc_ft</span> <span class="o">=</span> <span class="p">[</span><span class="s">'Gender'</span><span class="p">,</span> <span class="s">'Marital status'</span><span class="p">,</span> <span class="s">'Dwelling'</span><span class="p">,</span> <span class="s">'Employment status'</span><span class="p">,</span> <span class="s">'Has a car'</span><span class="p">,</span> <span class="s">'Has a property'</span><span class="p">,</span> <span class="s">'Has a work phone'</span><span class="p">,</span> <span class="s">'Has a phone'</span><span class="p">,</span> <span class="s">'Has an email'</span><span class="p">]):</span>
        <span class="bp">self</span><span class="p">.</span><span class="n">one_hot_enc_ft</span> <span class="o">=</span> <span class="n">one_hot_enc_ft</span>
    <span class="k">def</span> <span class="nf">fit</span><span class="p">(</span><span class="bp">self</span><span class="p">,</span><span class="n">df</span><span class="p">):</span>
        <span class="k">return</span> <span class="bp">self</span>
    <span class="k">def</span> <span class="nf">transform</span><span class="p">(</span><span class="bp">self</span><span class="p">,</span><span class="n">df</span><span class="p">):</span>
        <span class="k">if</span> <span class="p">(</span><span class="nb">set</span><span class="p">(</span><span class="bp">self</span><span class="p">.</span><span class="n">one_hot_enc_ft</span><span class="p">).</span><span class="n">issubset</span><span class="p">(</span><span class="n">df</span><span class="p">.</span><span class="n">columns</span><span class="p">)):</span>
            <span class="c1"># function to one-hot encode the features
</span>            <span class="k">def</span> <span class="nf">one_hot_enc</span><span class="p">(</span><span class="n">df</span><span class="p">,</span><span class="n">one_hot_enc_ft</span><span class="p">):</span>
                <span class="c1"># instantiate the OneHotEncoder object
</span>                <span class="n">one_hot_enc</span> <span class="o">=</span> <span class="n">OneHotEncoder</span><span class="p">()</span>
                <span class="c1"># fit the dataframe with the features we want to one-hot encode
</span>                <span class="n">one_hot_enc</span><span class="p">.</span><span class="n">fit</span><span class="p">(</span><span class="n">df</span><span class="p">[</span><span class="n">one_hot_enc_ft</span><span class="p">])</span>
                <span class="c1"># get output feature names for transformation.
</span>                <span class="n">feat_names_one_hot_enc</span> <span class="o">=</span> <span class="n">one_hot_enc</span><span class="p">.</span><span class="n">get_feature_names_out</span><span class="p">(</span><span class="n">one_hot_enc_ft</span><span class="p">)</span>
                <span class="c1"># change the one hot encoding array to a dataframe with the column names
</span>                <span class="n">df</span> <span class="o">=</span> <span class="n">pd</span><span class="p">.</span><span class="n">DataFrame</span><span class="p">(</span><span class="n">one_hot_enc</span><span class="p">.</span><span class="n">transform</span><span class="p">(</span><span class="n">df</span><span class="p">[</span><span class="bp">self</span><span class="p">.</span><span class="n">one_hot_enc_ft</span><span class="p">]).</span><span class="n">toarray</span><span class="p">(),</span><span class="n">columns</span><span class="o">=</span><span class="n">feat_names_one_hot_enc</span><span class="p">,</span><span class="n">index</span><span class="o">=</span><span class="n">df</span><span class="p">.</span><span class="n">index</span><span class="p">)</span>
                <span class="k">return</span> <span class="n">df</span>
            <span class="c1"># function to concatenate the one hot encoded features with the rest of the features that were not encoded
</span>            <span class="k">def</span> <span class="nf">concat_with_rest</span><span class="p">(</span><span class="n">df</span><span class="p">,</span><span class="n">one_hot_enc_df</span><span class="p">,</span><span class="n">one_hot_enc_ft</span><span class="p">):</span>
                <span class="c1"># get the rest of the features that are not encoded
</span>                <span class="n">rest_of_features</span> <span class="o">=</span> <span class="p">[</span><span class="n">ft</span> <span class="k">for</span> <span class="n">ft</span> <span class="ow">in</span> <span class="n">df</span><span class="p">.</span><span class="n">columns</span> <span class="k">if</span> <span class="n">ft</span> <span class="ow">not</span> <span class="ow">in</span> <span class="n">one_hot_enc_ft</span><span class="p">]</span>
                <span class="c1"># concatenate the rest of the features with the one hot encoded features
</span>                <span class="n">df_concat</span> <span class="o">=</span> <span class="n">pd</span><span class="p">.</span><span class="n">concat</span><span class="p">([</span><span class="n">one_hot_enc_df</span><span class="p">,</span> <span class="n">df</span><span class="p">[</span><span class="n">rest_of_features</span><span class="p">]],</span><span class="n">axis</span><span class="o">=</span><span class="mi">1</span><span class="p">)</span>
                <span class="k">return</span> <span class="n">df_concat</span>
            <span class="c1"># call the one_hot_enc function and stores the dataframe in the one_hot_enc_df variable
</span>            <span class="n">one_hot_enc_df</span> <span class="o">=</span> <span class="n">one_hot_enc</span><span class="p">(</span><span class="n">df</span><span class="p">,</span><span class="bp">self</span><span class="p">.</span><span class="n">one_hot_enc_ft</span><span class="p">)</span>
            <span class="c1"># returns the concatenated dataframe and stores it in the full_df_one_hot_enc variable
</span>            <span class="n">full_df_one_hot_enc</span> <span class="o">=</span> <span class="n">concat_with_rest</span><span class="p">(</span><span class="n">df</span><span class="p">,</span><span class="n">one_hot_enc_df</span><span class="p">,</span><span class="bp">self</span><span class="p">.</span><span class="n">one_hot_enc_ft</span><span class="p">)</span>
            <span class="k">return</span> <span class="n">full_df_one_hot_enc</span>
        <span class="k">else</span><span class="p">:</span>
            <span class="k">print</span><span class="p">(</span><span class="s">"One or more features are not in the dataframe"</span><span class="p">)</span>
            <span class="k">return</span> <span class="n">df</span>
</code></pre></div></div>

<p>This class will convert the education level to an ordinal encoding. Here we use ordinal encoding instead of one-hot encoding because we know that the education level is ranked (University is higher than primary school).</p>

<div class="language-python highlighter-rouge"><div class="highlight"><pre class="highlight"><code><span class="k">class</span> <span class="nc">OrdinalFeatNames</span><span class="p">(</span><span class="n">BaseEstimator</span><span class="p">,</span><span class="n">TransformerMixin</span><span class="p">):</span>
    <span class="k">def</span> <span class="nf">__init__</span><span class="p">(</span><span class="bp">self</span><span class="p">,</span><span class="n">ordinal_enc_ft</span> <span class="o">=</span> <span class="p">[</span><span class="s">'Education level'</span><span class="p">]):</span>
        <span class="bp">self</span><span class="p">.</span><span class="n">ordinal_enc_ft</span> <span class="o">=</span> <span class="n">ordinal_enc_ft</span>
    <span class="k">def</span> <span class="nf">fit</span><span class="p">(</span><span class="bp">self</span><span class="p">,</span><span class="n">df</span><span class="p">):</span>
        <span class="k">return</span> <span class="bp">self</span>
    <span class="k">def</span> <span class="nf">transform</span><span class="p">(</span><span class="bp">self</span><span class="p">,</span><span class="n">df</span><span class="p">):</span>
        <span class="k">if</span> <span class="s">'Education level'</span> <span class="ow">in</span> <span class="n">df</span><span class="p">.</span><span class="n">columns</span><span class="p">:</span>
            <span class="c1"># instantiate the OrdinalEncoder object
</span>            <span class="n">ordinal_enc</span> <span class="o">=</span> <span class="n">OrdinalEncoder</span><span class="p">()</span>
            <span class="n">df</span><span class="p">[</span><span class="bp">self</span><span class="p">.</span><span class="n">ordinal_enc_ft</span><span class="p">]</span> <span class="o">=</span> <span class="n">ordinal_enc</span><span class="p">.</span><span class="n">fit_transform</span><span class="p">(</span><span class="n">df</span><span class="p">[</span><span class="bp">self</span><span class="p">.</span><span class="n">ordinal_enc_ft</span><span class="p">])</span>
            <span class="k">return</span> <span class="n">df</span>
        <span class="k">else</span><span class="p">:</span>
            <span class="k">print</span><span class="p">(</span><span class="s">"Education level is not in the dataframe"</span><span class="p">)</span>
            <span class="k">return</span> <span class="n">df</span>
</code></pre></div></div>

<p>This class will scale the feature using min-max scaling while keeping the feature names. You may ask why we have to scale. Well, some of the numerical features range from 0 to 20 (Family member count) while others range from 27000 to 1575000 (Income), so this means that some machine learning algorithms will weight the features with big numbers more than the feature with smaller numbers which should not be the case. So scaling all the numerical feature on the same scale (0 to 1) solve this issue.</p>

<div class="language-python highlighter-rouge"><div class="highlight"><pre class="highlight"><code><span class="k">class</span> <span class="nc">MinMaxWithFeatNames</span><span class="p">(</span><span class="n">BaseEstimator</span><span class="p">,</span><span class="n">TransformerMixin</span><span class="p">):</span>
    <span class="k">def</span> <span class="nf">__init__</span><span class="p">(</span><span class="bp">self</span><span class="p">,</span><span class="n">min_max_scaler_ft</span> <span class="o">=</span> <span class="p">[</span><span class="s">'Age'</span><span class="p">,</span> <span class="s">'Income'</span><span class="p">,</span> <span class="s">'Employment length'</span><span class="p">]):</span>
        <span class="bp">self</span><span class="p">.</span><span class="n">min_max_scaler_ft</span> <span class="o">=</span> <span class="n">min_max_scaler_ft</span>
    <span class="k">def</span> <span class="nf">fit</span><span class="p">(</span><span class="bp">self</span><span class="p">,</span><span class="n">df</span><span class="p">):</span>
        <span class="k">return</span> <span class="bp">self</span>
    <span class="k">def</span> <span class="nf">transform</span><span class="p">(</span><span class="bp">self</span><span class="p">,</span><span class="n">df</span><span class="p">):</span>
        <span class="k">if</span> <span class="p">(</span><span class="nb">set</span><span class="p">(</span><span class="bp">self</span><span class="p">.</span><span class="n">min_max_scaler_ft</span><span class="p">).</span><span class="n">issubset</span><span class="p">(</span><span class="n">df</span><span class="p">.</span><span class="n">columns</span><span class="p">)):</span>
            <span class="c1"># instantiate the MinMaxScaler object
</span>            <span class="n">min_max_enc</span> <span class="o">=</span> <span class="n">MinMaxScaler</span><span class="p">()</span>
            <span class="c1"># fit and transform on a scale 0 to 1
</span>            <span class="n">df</span><span class="p">[</span><span class="bp">self</span><span class="p">.</span><span class="n">min_max_scaler_ft</span><span class="p">]</span> <span class="o">=</span> <span class="n">min_max_enc</span><span class="p">.</span><span class="n">fit_transform</span><span class="p">(</span><span class="n">df</span><span class="p">[</span><span class="bp">self</span><span class="p">.</span><span class="n">min_max_scaler_ft</span><span class="p">])</span>
            <span class="k">return</span> <span class="n">df</span>
        <span class="k">else</span><span class="p">:</span>
            <span class="k">print</span><span class="p">(</span><span class="s">"One or more features are not in the dataframe"</span><span class="p">)</span>
            <span class="k">return</span> <span class="n">df</span>
</code></pre></div></div>

<p>This class will change the data type of the target variable to numerical as it is an object data type even though it is 0 and 1’s (0 and 1’s expressed as strings)</p>

<div class="language-python highlighter-rouge"><div class="highlight"><pre class="highlight"><code><span class="k">class</span> <span class="nc">ChangeToNumTarget</span><span class="p">(</span><span class="n">BaseEstimator</span><span class="p">,</span><span class="n">TransformerMixin</span><span class="p">):</span>
    <span class="k">def</span> <span class="nf">__init__</span><span class="p">(</span><span class="bp">self</span><span class="p">):</span>
        <span class="k">pass</span>
    <span class="k">def</span> <span class="nf">fit</span><span class="p">(</span><span class="bp">self</span><span class="p">,</span><span class="n">df</span><span class="p">):</span>
        <span class="k">return</span> <span class="bp">self</span>
    <span class="k">def</span> <span class="nf">transform</span><span class="p">(</span><span class="bp">self</span><span class="p">,</span><span class="n">df</span><span class="p">):</span>
        <span class="c1"># check if the target is part of the dataframe
</span>        <span class="k">if</span> <span class="s">'Is high risk'</span> <span class="ow">in</span> <span class="n">df</span><span class="p">.</span><span class="n">columns</span><span class="p">:</span>
            <span class="c1"># change to a numeric data type using Pandas
</span>            <span class="n">df</span><span class="p">[</span><span class="s">'Is high risk'</span><span class="p">]</span> <span class="o">=</span> <span class="n">pd</span><span class="p">.</span><span class="n">to_numeric</span><span class="p">(</span><span class="n">df</span><span class="p">[</span><span class="s">'Is high risk'</span><span class="p">])</span>
            <span class="k">return</span> <span class="n">df</span>
        <span class="k">else</span><span class="p">:</span>
            <span class="k">print</span><span class="p">(</span><span class="s">"Is high risk is not in the dataframe"</span><span class="p">)</span>
            <span class="k">return</span> <span class="n">df</span>
</code></pre></div></div>

<p>This class will oversample the target variable using SMOTE because the minority class (Is high risk = 1) is scarce in the data, as we have seen while doing EDA of the target variable (<code class="language-plaintext highlighter-rouge">1</code> only accounts for about 1.71% of the total data while <code class="language-plaintext highlighter-rouge">0</code> represent 98.29%).</p>

<div class="language-python highlighter-rouge"><div class="highlight"><pre class="highlight"><code><span class="k">class</span> <span class="nc">Oversample</span><span class="p">(</span><span class="n">BaseEstimator</span><span class="p">,</span><span class="n">TransformerMixin</span><span class="p">):</span>
    <span class="k">def</span> <span class="nf">__init__</span><span class="p">(</span><span class="bp">self</span><span class="p">):</span>
        <span class="k">pass</span>
    <span class="k">def</span> <span class="nf">fit</span><span class="p">(</span><span class="bp">self</span><span class="p">,</span><span class="n">df</span><span class="p">):</span>
        <span class="k">return</span> <span class="bp">self</span>
    <span class="k">def</span> <span class="nf">transform</span><span class="p">(</span><span class="bp">self</span><span class="p">,</span><span class="n">df</span><span class="p">):</span>
        <span class="k">if</span> <span class="s">'Is high risk'</span> <span class="ow">in</span> <span class="n">df</span><span class="p">.</span><span class="n">columns</span><span class="p">:</span>
            <span class="c1"># smote function instantiation to oversample the minority class to fix the imbalance data
</span>            <span class="n">oversample</span> <span class="o">=</span> <span class="n">SMOTE</span><span class="p">(</span><span class="n">sampling_strategy</span><span class="o">=</span><span class="s">'minority'</span><span class="p">)</span>
            <span class="c1"># fit and resample the classes and assign them to X_bal, y_bal variable
</span>            <span class="n">X_bal</span><span class="p">,</span> <span class="n">y_bal</span> <span class="o">=</span> <span class="n">oversample</span><span class="p">.</span><span class="n">fit_resample</span><span class="p">(</span><span class="n">df</span><span class="p">.</span><span class="n">loc</span><span class="p">[:,</span> <span class="n">df</span><span class="p">.</span><span class="n">columns</span> <span class="o">!=</span> <span class="s">'Is high risk'</span><span class="p">],</span><span class="n">df</span><span class="p">[</span><span class="s">'Is high risk'</span><span class="p">])</span>
            <span class="c1"># concatenate the balanced classes column-wise
</span>            <span class="n">df_bal</span> <span class="o">=</span> <span class="n">pd</span><span class="p">.</span><span class="n">concat</span><span class="p">([</span><span class="n">pd</span><span class="p">.</span><span class="n">DataFrame</span><span class="p">(</span><span class="n">X_bal</span><span class="p">),</span><span class="n">pd</span><span class="p">.</span><span class="n">DataFrame</span><span class="p">(</span><span class="n">y_bal</span><span class="p">)],</span><span class="n">axis</span><span class="o">=</span><span class="mi">1</span><span class="p">)</span>
            <span class="k">return</span> <span class="n">df_bal</span>
        <span class="k">else</span><span class="p">:</span>
            <span class="k">print</span><span class="p">(</span><span class="s">"Is high risk is not in the dataframe"</span><span class="p">)</span>
            <span class="k">return</span> <span class="n">df</span>
</code></pre></div></div>

<h3>Data Preprocessing</h3>

<p>Now we are ready to create the data preprocessing pipeline using the built sklearn function <code class="language-plaintext highlighter-rouge">Pipeline</code>. This function calls each class in the pipeline sequentially, starting from the outlier remover to the oversample class. The dataset will be transformed consecutively from the first class to the next one till the end. The pipeline will be stored in a variable called pipeline and will call <code class="language-plaintext highlighter-rouge">fit_transform</code> on that variable, pass our dataframe we want to transform and return the result.</p>

<div class="language-python highlighter-rouge"><div class="highlight"><pre class="highlight"><code><span class="k">def</span> <span class="nf">full_pipeline</span><span class="p">(</span><span class="n">df</span><span class="p">):</span>
    <span class="c1"># Create the pipeline that will call all the classes from OutlierRemoval() to Oversample() in one go
</span>    <span class="n">pipeline</span> <span class="o">=</span> <span class="n">Pipeline</span><span class="p">([</span>
        <span class="p">(</span><span class="s">'outlier_remover'</span><span class="p">,</span> <span class="n">OutlierRemover</span><span class="p">()),</span>
        <span class="p">(</span><span class="s">'feature_dropper'</span><span class="p">,</span> <span class="n">DropFeatures</span><span class="p">()),</span>
        <span class="p">(</span><span class="s">'time_conversion_handler'</span><span class="p">,</span> <span class="n">TimeConversionHandler</span><span class="p">()),</span>
        <span class="p">(</span><span class="s">'retiree_handler'</span><span class="p">,</span> <span class="n">RetireeHandler</span><span class="p">()),</span>
        <span class="p">(</span><span class="s">'skewness_handler'</span><span class="p">,</span> <span class="n">SkewnessHandler</span><span class="p">()),</span>
        <span class="p">(</span><span class="s">'binning_num_to_yn'</span><span class="p">,</span> <span class="n">BinningNumToYN</span><span class="p">()),</span>
        <span class="p">(</span><span class="s">'one_hot_with_feat_names'</span><span class="p">,</span> <span class="n">OneHotWithFeatNames</span><span class="p">()),</span>
        <span class="p">(</span><span class="s">'ordinal_feat_names'</span><span class="p">,</span> <span class="n">OrdinalFeatNames</span><span class="p">()),</span>
        <span class="p">(</span><span class="s">'min_max_with_feat_names'</span><span class="p">,</span> <span class="n">MinMaxWithFeatNames</span><span class="p">()),</span>
        <span class="p">(</span><span class="s">'change_to_num_target'</span><span class="p">,</span> <span class="n">ChangeToNumTarget</span><span class="p">()),</span>
        <span class="p">(</span><span class="s">'oversample'</span><span class="p">,</span> <span class="n">Oversample</span><span class="p">())</span>
    <span class="p">])</span>
    <span class="n">df_pipe_prep</span> <span class="o">=</span> <span class="n">pipeline</span><span class="p">.</span><span class="n">fit_transform</span><span class="p">(</span><span class="n">df</span><span class="p">)</span>
    <span class="k">return</span> <span class="n">df_pipe_prep</span>
</code></pre></div></div>

<p>Now we pass in the training dataset.</p>

<div class="language-python highlighter-rouge"><div class="highlight"><pre class="highlight"><code><span class="n">pd</span><span class="p">.</span><span class="n">options</span><span class="p">.</span><span class="n">mode</span><span class="p">.</span><span class="n">chained_assignment</span> <span class="o">=</span> <span class="bp">None</span>  <span class="c1"># Hide the warnings
</span><span class="n">cc_train_prep</span> <span class="o">=</span> <span class="n">full_pipeline</span><span class="p">(</span><span class="n">cc_train_copy</span><span class="p">)</span>
</code></pre></div></div>

<p>We check how many rows and columns we have after the transformation.</p>

<div class="language-python highlighter-rouge"><div class="highlight"><pre class="highlight"><code><span class="n">cc_train_prep</span><span class="p">.</span><span class="n">shape</span>
</code></pre></div></div>

<div class="language-plaintext highlighter-rouge"><div class="highlight"><pre class="highlight"><code>(46544, 34)
</code></pre></div></div>

<p>Let’s quickly look at the first few rows of the transformed dataframe. We can see that the columns’ names have been kept, and all the transformations have taken place.</p>

<div class="language-python highlighter-rouge"><div class="highlight"><pre class="highlight"><code><span class="n">pd</span><span class="p">.</span><span class="n">set_option</span><span class="p">(</span><span class="s">'display.max_columns'</span><span class="p">,</span> <span class="bp">None</span><span class="p">)</span>
<span class="n">cc_train_prep</span><span class="p">.</span><span class="n">head</span><span class="p">()</span>
</code></pre></div></div>

<div>
<style scoped="">
    .dataframe tbody tr th:only-of-type {
        vertical-align: middle;
    }

    .dataframe tbody tr th {
        vertical-align: top;
    }

    .dataframe thead th {
        text-align: right;
    }
</style>
<table border="1" class="dataframe">
  <thead>
    <tr style="text-align: right;">
      <th></th>
      <th>Gender_F</th>
      <th>Gender_M</th>
      <th>Marital status_Civil marriage</th>
      <th>Marital status_Married</th>
      <th>Marital status_Separated</th>
      <th>Marital status_Single / not married</th>
      <th>Marital status_Widow</th>
      <th>Dwelling_Co-op apartment</th>
      <th>Dwelling_House / apartment</th>
      <th>Dwelling_Municipal apartment</th>
      <th>Dwelling_Office apartment</th>
      <th>Dwelling_Rented apartment</th>
      <th>Dwelling_With parents</th>
      <th>Employment status_Commercial associate</th>
      <th>Employment status_Pensioner</th>
      <th>Employment status_State servant</th>
      <th>Employment status_Student</th>
      <th>Employment status_Working</th>
      <th>Has a car_N</th>
      <th>Has a car_Y</th>
      <th>Has a property_N</th>
      <th>Has a property_Y</th>
      <th>Has a work phone_N</th>
      <th>Has a work phone_Y</th>
      <th>Has a phone_N</th>
      <th>Has a phone_Y</th>
      <th>Has an email_N</th>
      <th>Has an email_Y</th>
      <th>Income</th>
      <th>Education level</th>
      <th>Age</th>
      <th>Employment length</th>
      <th>Family member count</th>
      <th>Is high risk</th>
    </tr>
  </thead>
  <tbody>
    <tr>
      <th>0</th>
      <td>0.00</td>
      <td>1.00</td>
      <td>0.00</td>
      <td>1.00</td>
      <td>0.00</td>
      <td>0.00</td>
      <td>0.00</td>
      <td>0.00</td>
      <td>0.00</td>
      <td>0.00</td>
      <td>0.00</td>
      <td>0.00</td>
      <td>1.00</td>
      <td>0.00</td>
      <td>0.00</td>
      <td>0.00</td>
      <td>0.00</td>
      <td>1.00</td>
      <td>0.00</td>
      <td>1.00</td>
      <td>0.00</td>
      <td>1.00</td>
      <td>1.00</td>
      <td>0.00</td>
      <td>1.00</td>
      <td>0.00</td>
      <td>1.00</td>
      <td>0.00</td>
      <td>0.42</td>
      <td>4.00</td>
      <td>0.60</td>
      <td>0.27</td>
      <td>2.00</td>
      <td>0</td>
    </tr>
    <tr>
      <th>1</th>
      <td>1.00</td>
      <td>0.00</td>
      <td>0.00</td>
      <td>0.00</td>
      <td>0.00</td>
      <td>1.00</td>
      <td>0.00</td>
      <td>0.00</td>
      <td>1.00</td>
      <td>0.00</td>
      <td>0.00</td>
      <td>0.00</td>
      <td>0.00</td>
      <td>1.00</td>
      <td>0.00</td>
      <td>0.00</td>
      <td>0.00</td>
      <td>0.00</td>
      <td>0.00</td>
      <td>1.00</td>
      <td>1.00</td>
      <td>0.00</td>
      <td>1.00</td>
      <td>0.00</td>
      <td>1.00</td>
      <td>0.00</td>
      <td>1.00</td>
      <td>0.00</td>
      <td>0.42</td>
      <td>1.00</td>
      <td>0.20</td>
      <td>0.14</td>
      <td>2.00</td>
      <td>0</td>
    </tr>
    <tr>
      <th>2</th>
      <td>1.00</td>
      <td>0.00</td>
      <td>0.00</td>
      <td>1.00</td>
      <td>0.00</td>
      <td>0.00</td>
      <td>0.00</td>
      <td>0.00</td>
      <td>1.00</td>
      <td>0.00</td>
      <td>0.00</td>
      <td>0.00</td>
      <td>0.00</td>
      <td>1.00</td>
      <td>0.00</td>
      <td>0.00</td>
      <td>0.00</td>
      <td>0.00</td>
      <td>1.00</td>
      <td>0.00</td>
      <td>0.00</td>
      <td>1.00</td>
      <td>1.00</td>
      <td>0.00</td>
      <td>1.00</td>
      <td>0.00</td>
      <td>1.00</td>
      <td>0.00</td>
      <td>0.52</td>
      <td>4.00</td>
      <td>0.39</td>
      <td>0.50</td>
      <td>4.00</td>
      <td>0</td>
    </tr>
    <tr>
      <th>3</th>
      <td>1.00</td>
      <td>0.00</td>
      <td>0.00</td>
      <td>0.00</td>
      <td>0.00</td>
      <td>1.00</td>
      <td>0.00</td>
      <td>0.00</td>
      <td>1.00</td>
      <td>0.00</td>
      <td>0.00</td>
      <td>0.00</td>
      <td>0.00</td>
      <td>1.00</td>
      <td>0.00</td>
      <td>0.00</td>
      <td>0.00</td>
      <td>0.00</td>
      <td>0.00</td>
      <td>1.00</td>
      <td>0.00</td>
      <td>1.00</td>
      <td>1.00</td>
      <td>0.00</td>
      <td>1.00</td>
      <td>0.00</td>
      <td>0.00</td>
      <td>1.00</td>
      <td>0.81</td>
      <td>1.00</td>
      <td>0.84</td>
      <td>0.18</td>
      <td>1.00</td>
      <td>0</td>
    </tr>
    <tr>
      <th>4</th>
      <td>1.00</td>
      <td>0.00</td>
      <td>0.00</td>
      <td>0.00</td>
      <td>1.00</td>
      <td>0.00</td>
      <td>0.00</td>
      <td>0.00</td>
      <td>1.00</td>
      <td>0.00</td>
      <td>0.00</td>
      <td>0.00</td>
      <td>0.00</td>
      <td>0.00</td>
      <td>0.00</td>
      <td>0.00</td>
      <td>0.00</td>
      <td>1.00</td>
      <td>1.00</td>
      <td>0.00</td>
      <td>1.00</td>
      <td>0.00</td>
      <td>1.00</td>
      <td>0.00</td>
      <td>0.00</td>
      <td>1.00</td>
      <td>1.00</td>
      <td>0.00</td>
      <td>0.68</td>
      <td>4.00</td>
      <td>0.60</td>
      <td>0.04</td>
      <td>1.00</td>
      <td>0</td>
    </tr>
  </tbody>
</table>
</div>

<p>Now, we extract the target variable <code class="language-plaintext highlighter-rouge">Is high risk</code> from the dataframe and create a new dataframe composed of independent features (also called predictor, aka all the features except the target variable) as <code class="language-plaintext highlighter-rouge">X_cc_train_prep</code> and the target variable as  <code class="language-plaintext highlighter-rouge">y_cc_train_prep</code>.</p>

<div class="language-python highlighter-rouge"><div class="highlight"><pre class="highlight"><code><span class="c1"># split the train data into X and y (target)
</span><span class="n">X_cc_train_prep</span><span class="p">,</span> <span class="n">y_cc_train_prep</span> <span class="o">=</span> <span class="n">cc_train_prep</span><span class="p">.</span><span class="n">loc</span><span class="p">[:,</span> <span class="n">cc_train_prep</span><span class="p">.</span><span class="n">columns</span> <span class="o">!=</span> <span class="s">'Is high risk'</span><span class="p">],</span> <span class="n">cc_train_prep</span><span class="p">[</span><span class="s">'Is high risk'</span><span class="p">].</span><span class="n">astype</span><span class="p">(</span><span class="s">'int64'</span><span class="p">)</span>
</code></pre></div></div>

<div class="language-python highlighter-rouge"><div class="highlight"><pre class="highlight"><code><span class="n">X_cc_train_prep</span><span class="p">.</span><span class="n">head</span><span class="p">()</span>
</code></pre></div></div>

<div>
<style scoped="">
    .dataframe tbody tr th:only-of-type {
        vertical-align: middle;
    }

    .dataframe tbody tr th {
        vertical-align: top;
    }

    .dataframe thead th {
        text-align: right;
    }
</style>
<table border="1" class="dataframe">
  <thead>
    <tr style="text-align: right;">
      <th></th>
      <th>Gender_F</th>
      <th>Gender_M</th>
      <th>Marital status_Civil marriage</th>
      <th>Marital status_Married</th>
      <th>Marital status_Separated</th>
      <th>Marital status_Single / not married</th>
      <th>Marital status_Widow</th>
      <th>Dwelling_Co-op apartment</th>
      <th>Dwelling_House / apartment</th>
      <th>Dwelling_Municipal apartment</th>
      <th>Dwelling_Office apartment</th>
      <th>Dwelling_Rented apartment</th>
      <th>Dwelling_With parents</th>
      <th>Employment status_Commercial associate</th>
      <th>Employment status_Pensioner</th>
      <th>Employment status_State servant</th>
      <th>Employment status_Student</th>
      <th>Employment status_Working</th>
      <th>Has a car_N</th>
      <th>Has a car_Y</th>
      <th>Has a property_N</th>
      <th>Has a property_Y</th>
      <th>Has a work phone_N</th>
      <th>Has a work phone_Y</th>
      <th>Has a phone_N</th>
      <th>Has a phone_Y</th>
      <th>Has an email_N</th>
      <th>Has an email_Y</th>
      <th>Income</th>
      <th>Education level</th>
      <th>Age</th>
      <th>Employment length</th>
      <th>Family member count</th>
    </tr>
  </thead>
  <tbody>
    <tr>
      <th>0</th>
      <td>0.00</td>
      <td>1.00</td>
      <td>0.00</td>
      <td>1.00</td>
      <td>0.00</td>
      <td>0.00</td>
      <td>0.00</td>
      <td>0.00</td>
      <td>0.00</td>
      <td>0.00</td>
      <td>0.00</td>
      <td>0.00</td>
      <td>1.00</td>
      <td>0.00</td>
      <td>0.00</td>
      <td>0.00</td>
      <td>0.00</td>
      <td>1.00</td>
      <td>0.00</td>
      <td>1.00</td>
      <td>0.00</td>
      <td>1.00</td>
      <td>1.00</td>
      <td>0.00</td>
      <td>1.00</td>
      <td>0.00</td>
      <td>1.00</td>
      <td>0.00</td>
      <td>0.42</td>
      <td>4.00</td>
      <td>0.60</td>
      <td>0.27</td>
      <td>2.00</td>
    </tr>
    <tr>
      <th>1</th>
      <td>1.00</td>
      <td>0.00</td>
      <td>0.00</td>
      <td>0.00</td>
      <td>0.00</td>
      <td>1.00</td>
      <td>0.00</td>
      <td>0.00</td>
      <td>1.00</td>
      <td>0.00</td>
      <td>0.00</td>
      <td>0.00</td>
      <td>0.00</td>
      <td>1.00</td>
      <td>0.00</td>
      <td>0.00</td>
      <td>0.00</td>
      <td>0.00</td>
      <td>0.00</td>
      <td>1.00</td>
      <td>1.00</td>
      <td>0.00</td>
      <td>1.00</td>
      <td>0.00</td>
      <td>1.00</td>
      <td>0.00</td>
      <td>1.00</td>
      <td>0.00</td>
      <td>0.42</td>
      <td>1.00</td>
      <td>0.20</td>
      <td>0.14</td>
      <td>2.00</td>
    </tr>
    <tr>
      <th>2</th>
      <td>1.00</td>
      <td>0.00</td>
      <td>0.00</td>
      <td>1.00</td>
      <td>0.00</td>
      <td>0.00</td>
      <td>0.00</td>
      <td>0.00</td>
      <td>1.00</td>
      <td>0.00</td>
      <td>0.00</td>
      <td>0.00</td>
      <td>0.00</td>
      <td>1.00</td>
      <td>0.00</td>
      <td>0.00</td>
      <td>0.00</td>
      <td>0.00</td>
      <td>1.00</td>
      <td>0.00</td>
      <td>0.00</td>
      <td>1.00</td>
      <td>1.00</td>
      <td>0.00</td>
      <td>1.00</td>
      <td>0.00</td>
      <td>1.00</td>
      <td>0.00</td>
      <td>0.52</td>
      <td>4.00</td>
      <td>0.39</td>
      <td>0.50</td>
      <td>4.00</td>
    </tr>
    <tr>
      <th>3</th>
      <td>1.00</td>
      <td>0.00</td>
      <td>0.00</td>
      <td>0.00</td>
      <td>0.00</td>
      <td>1.00</td>
      <td>0.00</td>
      <td>0.00</td>
      <td>1.00</td>
      <td>0.00</td>
      <td>0.00</td>
      <td>0.00</td>
      <td>0.00</td>
      <td>1.00</td>
      <td>0.00</td>
      <td>0.00</td>
      <td>0.00</td>
      <td>0.00</td>
      <td>0.00</td>
      <td>1.00</td>
      <td>0.00</td>
      <td>1.00</td>
      <td>1.00</td>
      <td>0.00</td>
      <td>1.00</td>
      <td>0.00</td>
      <td>0.00</td>
      <td>1.00</td>
      <td>0.81</td>
      <td>1.00</td>
      <td>0.84</td>
      <td>0.18</td>
      <td>1.00</td>
    </tr>
    <tr>
      <th>4</th>
      <td>1.00</td>
      <td>0.00</td>
      <td>0.00</td>
      <td>0.00</td>
      <td>1.00</td>
      <td>0.00</td>
      <td>0.00</td>
      <td>0.00</td>
      <td>1.00</td>
      <td>0.00</td>
      <td>0.00</td>
      <td>0.00</td>
      <td>0.00</td>
      <td>0.00</td>
      <td>0.00</td>
      <td>0.00</td>
      <td>0.00</td>
      <td>1.00</td>
      <td>1.00</td>
      <td>0.00</td>
      <td>1.00</td>
      <td>0.00</td>
      <td>1.00</td>
      <td>0.00</td>
      <td>0.00</td>
      <td>1.00</td>
      <td>1.00</td>
      <td>0.00</td>
      <td>0.68</td>
      <td>4.00</td>
      <td>0.60</td>
      <td>0.04</td>
      <td>1.00</td>
    </tr>
  </tbody>
</table>
</div>

<div class="language-python highlighter-rouge"><div class="highlight"><pre class="highlight"><code><span class="n">y_cc_train_prep</span><span class="p">.</span><span class="n">head</span><span class="p">()</span>
</code></pre></div></div>

<div class="language-plaintext highlighter-rouge"><div class="highlight"><pre class="highlight"><code>0    0
1    0
2    0
3    0
4    0
Name: Is high risk, dtype: int64
</code></pre></div></div>

<h3>Short-list promising models</h3>

<p>Alright! the moment we have been all waiting for has finally arrived; time to train our models. We first create a dictionary of models and their corresponding names. This dictionary will be used to loop through all the models and train them without having to write them over and over again.</p>

<div class="language-python highlighter-rouge"><div class="highlight"><pre class="highlight"><code><span class="n">classifiers</span> <span class="o">=</span> <span class="p">{</span>
    <span class="s">'sgd'</span><span class="p">:</span><span class="n">SGDClassifier</span><span class="p">(</span><span class="n">random_state</span><span class="o">=</span><span class="mi">42</span><span class="p">,</span><span class="n">loss</span><span class="o">=</span><span class="s">'perceptron'</span><span class="p">),</span>
    <span class="s">'logistic_regression'</span><span class="p">:</span><span class="n">LogisticRegression</span><span class="p">(</span><span class="n">random_state</span><span class="o">=</span><span class="mi">42</span><span class="p">,</span><span class="n">max_iter</span><span class="o">=</span><span class="mi">1000</span><span class="p">),</span>
    <span class="s">'support_vector_machine'</span><span class="p">:</span><span class="n">SVC</span><span class="p">(</span><span class="n">random_state</span><span class="o">=</span><span class="mi">42</span><span class="p">,</span><span class="n">probability</span><span class="o">=</span><span class="bp">True</span><span class="p">),</span>
    <span class="s">'decision_tree'</span><span class="p">:</span><span class="n">DecisionTreeClassifier</span><span class="p">(</span><span class="n">random_state</span><span class="o">=</span><span class="mi">42</span><span class="p">),</span>
    <span class="s">'random_forest'</span><span class="p">:</span><span class="n">RandomForestClassifier</span><span class="p">(</span><span class="n">random_state</span><span class="o">=</span><span class="mi">42</span><span class="p">),</span>
    <span class="s">'gaussian_naive_bayes'</span><span class="p">:</span><span class="n">GaussianNB</span><span class="p">(),</span>
    <span class="s">'k_nearest_neighbors'</span><span class="p">:</span><span class="n">KNeighborsClassifier</span><span class="p">(),</span>
    <span class="s">'gradient_boosting'</span><span class="p">:</span><span class="n">GradientBoostingClassifier</span><span class="p">(</span><span class="n">random_state</span><span class="o">=</span><span class="mi">42</span><span class="p">),</span>
    <span class="s">'linear_discriminant_analysis'</span><span class="p">:</span><span class="n">LinearDiscriminantAnalysis</span><span class="p">(),</span>
    <span class="s">'bagging'</span><span class="p">:</span><span class="n">BaggingClassifier</span><span class="p">(</span><span class="n">random_state</span><span class="o">=</span><span class="mi">42</span><span class="p">),</span>
    <span class="s">'neural_network'</span><span class="p">:</span><span class="n">MLPClassifier</span><span class="p">(</span><span class="n">random_state</span><span class="o">=</span><span class="mi">42</span><span class="p">,</span><span class="n">max_iter</span><span class="o">=</span><span class="mi">1000</span><span class="p">),</span>
    <span class="s">'adaboost'</span><span class="p">:</span><span class="n">AdaBoostClassifier</span><span class="p">(</span><span class="n">random_state</span><span class="o">=</span><span class="mi">42</span><span class="p">),</span>
    <span class="s">'extra_trees'</span><span class="p">:</span><span class="n">ExtraTreesClassifier</span><span class="p">(</span><span class="n">random_state</span><span class="o">=</span><span class="mi">42</span><span class="p">),</span>
    <span class="p">}</span>
</code></pre></div></div>

<p>Now we will write some of the functions used for our training model. The first function is a function to plot the feature importance of the model. The feature importance is ranking features that contribute more(or less) than other features to the model prediction. The feature importance varies from one model to another.</p>

<div class="language-python highlighter-rouge"><div class="highlight"><pre class="highlight"><code><span class="k">def</span> <span class="nf">feat_importance_plot</span><span class="p">(</span><span class="n">model_trn</span><span class="p">,</span> <span class="n">model_name</span><span class="p">):</span>
    <span class="s">'''
    Function to get the feature importance of the classifier and plot it
    '''</span>
    <span class="c1"># in order to get the feature importance, the model should not be 'sgd','support_vector_machine','gaussian_naive_bayes','k_nearest_neighbors','bagging','neural_network'
</span>    <span class="k">if</span> <span class="n">model_name</span> <span class="ow">not</span> <span class="ow">in</span> <span class="p">[</span><span class="s">'sgd'</span><span class="p">,</span><span class="s">'support_vector_machine'</span><span class="p">,</span><span class="s">'gaussian_naive_bayes'</span><span class="p">,</span><span class="s">'k_nearest_neighbors'</span><span class="p">,</span><span class="s">'bagging'</span><span class="p">,</span><span class="s">'neural_network'</span><span class="p">]:</span>
        <span class="c1"># change xtick font size
</span>        <span class="n">plt</span><span class="p">.</span><span class="n">rcParams</span><span class="p">[</span><span class="s">'xtick.labelsize'</span><span class="p">]</span> <span class="o">=</span> <span class="mi">12</span>
        <span class="n">plt</span><span class="p">.</span><span class="n">rcParams</span><span class="p">[</span><span class="s">'ytick.labelsize'</span><span class="p">]</span> <span class="o">=</span> <span class="mi">12</span>
        <span class="c1"># top 10 most predictive features
</span>        <span class="n">top_10_feat</span> <span class="o">=</span> <span class="n">FeatureImportances</span><span class="p">(</span><span class="n">model_trn</span><span class="p">,</span> <span class="n">relative</span><span class="o">=</span><span class="bp">False</span><span class="p">,</span> <span class="n">topn</span><span class="o">=</span><span class="mi">10</span><span class="p">)</span>
        <span class="c1"># top 10 least predictive features
</span>        <span class="n">bottom_10_feat</span> <span class="o">=</span> <span class="n">FeatureImportances</span><span class="p">(</span><span class="n">model_trn</span><span class="p">,</span> <span class="n">relative</span><span class="o">=</span><span class="bp">False</span><span class="p">,</span> <span class="n">topn</span><span class="o">=-</span><span class="mi">10</span><span class="p">)</span>
        <span class="c1"># change the figure size
</span>        <span class="n">plt</span><span class="p">.</span><span class="n">figure</span><span class="p">(</span><span class="n">figsize</span><span class="o">=</span><span class="p">(</span><span class="mi">10</span><span class="p">,</span> <span class="mi">4</span><span class="p">))</span>
        <span class="c1"># change x label font size
</span>        <span class="n">plt</span><span class="p">.</span><span class="n">xlabel</span><span class="p">(</span><span class="s">'xlabel'</span><span class="p">,</span> <span class="n">fontsize</span><span class="o">=</span><span class="mi">14</span><span class="p">)</span>
        <span class="c1"># fit to get the feature importance
</span>        <span class="n">top_10_feat</span><span class="p">.</span><span class="n">fit</span><span class="p">(</span><span class="n">X_cc_train_prep</span><span class="p">,</span> <span class="n">y_cc_train_prep</span><span class="p">)</span>
        <span class="c1"># show the plot
</span>        <span class="n">top_10_feat</span><span class="p">.</span><span class="n">show</span><span class="p">()</span>
        <span class="k">print</span><span class="p">(</span><span class="s">'</span><span class="se">\n</span><span class="s">'</span><span class="p">)</span>
        <span class="n">plt</span><span class="p">.</span><span class="n">figure</span><span class="p">(</span><span class="n">figsize</span><span class="o">=</span><span class="p">(</span><span class="mi">10</span><span class="p">,</span> <span class="mi">4</span><span class="p">))</span>
        <span class="n">plt</span><span class="p">.</span><span class="n">xlabel</span><span class="p">(</span><span class="s">'xlabel'</span><span class="p">,</span> <span class="n">fontsize</span><span class="o">=</span><span class="mi">14</span><span class="p">)</span>
        <span class="c1"># fit to get the feature importance
</span>        <span class="n">bottom_10_feat</span><span class="p">.</span><span class="n">fit</span><span class="p">(</span><span class="n">X_cc_train_prep</span><span class="p">,</span> <span class="n">y_cc_train_prep</span><span class="p">)</span>
        <span class="c1"># show the plot
</span>        <span class="n">bottom_10_feat</span><span class="p">.</span><span class="n">show</span><span class="p">()</span>
        <span class="k">print</span><span class="p">(</span><span class="s">'</span><span class="se">\n</span><span class="s">'</span><span class="p">)</span>
    <span class="k">else</span><span class="p">:</span>
        <span class="k">print</span><span class="p">(</span><span class="s">'No feature importance for {0}'</span><span class="p">.</span><span class="nb">format</span><span class="p">(</span><span class="n">model_name</span><span class="p">))</span>
        <span class="k">print</span><span class="p">(</span><span class="s">'</span><span class="se">\n</span><span class="s">'</span><span class="p">)</span>
</code></pre></div></div>

<p>On the other hand, this function is used to get the y predictions of the model using cross-validation prediction with k fold equal to 10.</p>

<div class="language-python highlighter-rouge"><div class="highlight"><pre class="highlight"><code><span class="k">def</span> <span class="nf">y_prediction_func</span><span class="p">(</span><span class="n">model_trn</span><span class="p">,</span><span class="n">model_name</span><span class="p">,</span><span class="n">final_model</span><span class="o">=</span><span class="bp">False</span><span class="p">):</span>
    <span class="s">'''
    Function to get the y prediction
    '''</span>
    <span class="k">if</span> <span class="n">final_model</span> <span class="o">==</span> <span class="bp">False</span><span class="p">:</span>
        <span class="c1"># check if y_train_copy_pred files exist; if not, create it
</span>        <span class="n">y_cc_train_pred_path</span> <span class="o">=</span> <span class="n">Path</span><span class="p">(</span><span class="s">'saved_models/{0}/y_train_copy_pred_{0}.sav'</span><span class="p">.</span><span class="nb">format</span><span class="p">(</span><span class="n">model_name</span><span class="p">))</span>
        <span class="k">try</span><span class="p">:</span>
            <span class="n">y_cc_train_pred_path</span><span class="p">.</span><span class="n">resolve</span><span class="p">(</span><span class="n">strict</span><span class="o">=</span><span class="bp">True</span><span class="p">)</span>
        <span class="c1"># if FileNotFoundError is raised
</span>        <span class="k">except</span> <span class="nb">FileNotFoundError</span><span class="p">:</span>
            <span class="c1"># cross-validation prediction with kfold = 10
</span>            <span class="n">y_cc_train_pred</span> <span class="o">=</span> <span class="n">cross_val_predict</span><span class="p">(</span><span class="n">model_trn</span><span class="p">,</span><span class="n">X_cc_train_prep</span><span class="p">,</span><span class="n">y_cc_train_prep</span><span class="p">,</span><span class="n">cv</span><span class="o">=</span><span class="mi">10</span><span class="p">,</span><span class="n">n_jobs</span><span class="o">=-</span><span class="mi">1</span><span class="p">)</span>
            <span class="c1"># save the predictions using joblib library
</span>            <span class="n">joblib</span><span class="p">.</span><span class="n">dump</span><span class="p">(</span><span class="n">y_cc_train_pred</span><span class="p">,</span><span class="n">y_cc_train_pred_path</span><span class="p">)</span>
            <span class="k">return</span> <span class="n">y_cc_train_pred</span>
        <span class="k">else</span><span class="p">:</span>
            <span class="c1"># if the file exists, load the predictions
</span>            <span class="n">y_cc_train_pred</span> <span class="o">=</span> <span class="n">joblib</span><span class="p">.</span><span class="n">load</span><span class="p">(</span><span class="n">y_cc_train_pred_path</span><span class="p">)</span>
            <span class="k">return</span> <span class="n">y_cc_train_pred</span>
    <span class="c1"># When we are dealing with the final model
</span>    <span class="k">else</span><span class="p">:</span>
        <span class="c1"># check if y_train_copy_pred files exist; if not, create it
</span>        <span class="n">y_cc_train_pred_path_final</span> <span class="o">=</span> <span class="n">Path</span><span class="p">(</span><span class="s">'saved_models_final/{0}/y_train_copy_pred_{0}_final.sav'</span><span class="p">.</span><span class="nb">format</span><span class="p">(</span><span class="n">model_name</span><span class="p">))</span>
        <span class="k">try</span><span class="p">:</span>
            <span class="n">y_cc_train_pred_path_final</span><span class="p">.</span><span class="n">resolve</span><span class="p">(</span><span class="n">strict</span><span class="o">=</span><span class="bp">True</span><span class="p">)</span>
        <span class="k">except</span> <span class="nb">FileNotFoundError</span><span class="p">:</span>
            <span class="c1"># cross validation prediction with kfold = 10
</span>            <span class="n">y_cc_train_pred_final</span> <span class="o">=</span> <span class="n">cross_val_predict</span><span class="p">(</span><span class="n">model_trn</span><span class="p">,</span><span class="n">X_cc_train_prep</span><span class="p">,</span><span class="n">y_cc_train_prep</span><span class="p">,</span><span class="n">cv</span><span class="o">=</span><span class="mi">10</span><span class="p">,</span><span class="n">n_jobs</span><span class="o">=-</span><span class="mi">1</span><span class="p">)</span>
            <span class="c1"># save the predictions
</span>            <span class="n">joblib</span><span class="p">.</span><span class="n">dump</span><span class="p">(</span><span class="n">y_cc_train_pred_final</span><span class="p">,</span><span class="n">y_cc_train_pred_path_final</span><span class="p">)</span>
            <span class="k">return</span> <span class="n">y_cc_train_pred_final</span>
        <span class="k">else</span><span class="p">:</span>
            <span class="c1"># if it exists load the predictions
</span>            <span class="n">y_cc_train_pred_final</span> <span class="o">=</span> <span class="n">joblib</span><span class="p">.</span><span class="n">load</span><span class="p">(</span><span class="n">y_cc_train_pred_path_final</span><span class="p">)</span>
            <span class="k">return</span> <span class="n">y_cc_train_pred_final</span>
</code></pre></div></div>

<p>This function will plot the confusion matrix for each of the algorithms.</p>

<div class="language-python highlighter-rouge"><div class="highlight"><pre class="highlight"><code><span class="k">def</span> <span class="nf">confusion_matrix_func</span><span class="p">(</span><span class="n">model_trn</span><span class="p">,</span><span class="n">model_name</span><span class="p">,</span><span class="n">final_model</span><span class="o">=</span><span class="bp">False</span><span class="p">):</span>
    <span class="s">'''
    Function to plot the confusion matrix
    '''</span>
    <span class="k">if</span> <span class="n">final_model</span> <span class="o">==</span> <span class="bp">False</span><span class="p">:</span>
        <span class="n">fig</span><span class="p">,</span> <span class="n">ax</span> <span class="o">=</span> <span class="n">plt</span><span class="p">.</span><span class="n">subplots</span><span class="p">(</span><span class="n">figsize</span><span class="o">=</span><span class="p">(</span><span class="mi">8</span><span class="p">,</span><span class="mi">8</span><span class="p">))</span>
        <span class="c1"># plot confusion matrix
</span>        <span class="n">conf_matrix</span> <span class="o">=</span> <span class="n">ConfusionMatrixDisplay</span><span class="p">.</span><span class="n">from_predictions</span><span class="p">(</span><span class="n">y_cc_train_prep</span><span class="p">,</span><span class="n">y_prediction_func</span><span class="p">(</span><span class="n">model_trn</span><span class="p">,</span><span class="n">model_name</span><span class="p">),</span><span class="n">ax</span><span class="o">=</span><span class="n">ax</span><span class="p">,</span> <span class="n">cmap</span><span class="o">=</span><span class="s">'Blues'</span><span class="p">,</span><span class="n">values_format</span><span class="o">=</span><span class="s">'d'</span><span class="p">)</span>
        <span class="c1"># remove the grid
</span>        <span class="n">plt</span><span class="p">.</span><span class="n">grid</span><span class="p">(</span><span class="n">visible</span><span class="o">=</span><span class="bp">None</span><span class="p">)</span>
        <span class="c1"># increase the font size of the X and Y labels
</span>        <span class="n">plt</span><span class="p">.</span><span class="n">xlabel</span><span class="p">(</span><span class="s">'Predicted label'</span><span class="p">,</span> <span class="n">fontsize</span><span class="o">=</span><span class="mi">14</span><span class="p">)</span>
        <span class="n">plt</span><span class="p">.</span><span class="n">ylabel</span><span class="p">(</span><span class="s">'True label'</span><span class="p">,</span> <span class="n">fontsize</span><span class="o">=</span><span class="mi">14</span><span class="p">)</span>
        <span class="c1"># give a title to the plot using the model name
</span>        <span class="n">plt</span><span class="p">.</span><span class="n">title</span><span class="p">(</span><span class="s">'Confusion Matrix'</span><span class="p">,</span> <span class="n">fontsize</span><span class="o">=</span><span class="mi">14</span><span class="p">)</span>
        <span class="c1"># show the plot
</span>        <span class="n">plt</span><span class="p">.</span><span class="n">show</span><span class="p">()</span>
        <span class="k">print</span><span class="p">(</span><span class="s">'</span><span class="se">\n</span><span class="s">'</span><span class="p">)</span>
    <span class="c1"># When we are dealing with the final model
</span>    <span class="k">else</span><span class="p">:</span>
        <span class="n">fig</span><span class="p">,</span> <span class="n">ax</span> <span class="o">=</span> <span class="n">plt</span><span class="p">.</span><span class="n">subplots</span><span class="p">(</span><span class="n">figsize</span><span class="o">=</span><span class="p">(</span><span class="mi">8</span><span class="p">,</span><span class="mi">8</span><span class="p">))</span>
        <span class="c1"># plot confusion matrix
</span>        <span class="n">conf_matrix_final</span> <span class="o">=</span> <span class="n">ConfusionMatrixDisplay</span><span class="p">.</span><span class="n">from_predictions</span><span class="p">(</span><span class="n">y_cc_train_prep</span><span class="p">,</span><span class="n">y_prediction_func</span><span class="p">(</span><span class="n">model_trn</span><span class="p">,</span><span class="n">model_name</span><span class="p">,</span><span class="n">final_model</span><span class="o">=</span><span class="bp">True</span><span class="p">),</span><span class="n">ax</span><span class="o">=</span><span class="n">ax</span><span class="p">,</span> <span class="n">cmap</span><span class="o">=</span><span class="s">'Blues'</span><span class="p">,</span><span class="n">values_format</span><span class="o">=</span><span class="s">'d'</span><span class="p">)</span>
        <span class="c1"># remove the grid
</span>        <span class="n">plt</span><span class="p">.</span><span class="n">grid</span><span class="p">(</span><span class="n">visible</span><span class="o">=</span><span class="bp">None</span><span class="p">)</span>
        <span class="c1"># increase the font size of the X and Y labels
</span>        <span class="n">plt</span><span class="p">.</span><span class="n">xlabel</span><span class="p">(</span><span class="s">'Predicted label'</span><span class="p">,</span> <span class="n">fontsize</span><span class="o">=</span><span class="mi">14</span><span class="p">)</span>
        <span class="n">plt</span><span class="p">.</span><span class="n">ylabel</span><span class="p">(</span><span class="s">'True label'</span><span class="p">,</span> <span class="n">fontsize</span><span class="o">=</span><span class="mi">14</span><span class="p">)</span>
        <span class="c1"># give a title to the plot using the model name
</span>        <span class="n">plt</span><span class="p">.</span><span class="n">title</span><span class="p">(</span><span class="s">'Confusion Matrix'</span><span class="p">,</span> <span class="n">fontsize</span><span class="o">=</span><span class="mi">14</span><span class="p">)</span>
        <span class="c1"># show the plot
</span>        <span class="n">plt</span><span class="p">.</span><span class="n">show</span><span class="p">()</span>
        <span class="k">print</span><span class="p">(</span><span class="s">'</span><span class="se">\n</span><span class="s">'</span><span class="p">)</span>
</code></pre></div></div>

<p>The following function will plot the ROC curve of each model.</p>

<div class="language-python highlighter-rouge"><div class="highlight"><pre class="highlight"><code><span class="k">def</span> <span class="nf">roc_curve_func</span><span class="p">(</span><span class="n">model_trn</span><span class="p">,</span><span class="n">model_name</span><span class="p">,</span><span class="n">final_model</span><span class="o">=</span><span class="bp">False</span><span class="p">):</span>
    <span class="s">'''
    Function to plot the roc curve
    '''</span>
    <span class="k">if</span> <span class="n">final_model</span> <span class="o">==</span> <span class="bp">False</span><span class="p">:</span>
        <span class="c1"># check if the y probabilities file exists; if not create it
</span>        <span class="n">y_proba_path</span> <span class="o">=</span> <span class="n">Path</span><span class="p">(</span><span class="s">'saved_models/{0}/y_cc_train_proba_{0}.sav'</span><span class="p">.</span><span class="nb">format</span><span class="p">(</span><span class="n">model_name</span><span class="p">))</span>
        <span class="k">try</span><span class="p">:</span>
            <span class="n">y_proba_path</span><span class="p">.</span><span class="n">resolve</span><span class="p">(</span><span class="n">strict</span><span class="o">=</span><span class="bp">True</span><span class="p">)</span>
        <span class="c1"># if the FileNotFoundError is raised
</span>        <span class="k">except</span> <span class="nb">FileNotFoundError</span><span class="p">:</span>
            <span class="c1"># calculate the y probability
</span>            <span class="n">y_cc_train_proba</span> <span class="o">=</span> <span class="n">model_trn</span><span class="p">.</span><span class="n">predict_proba</span><span class="p">(</span><span class="n">X_cc_train_prep</span><span class="p">)</span>
            <span class="c1"># save y_cc_train_proba file at y_proba_path
</span>            <span class="n">joblib</span><span class="p">.</span><span class="n">dump</span><span class="p">(</span><span class="n">y_cc_train_proba</span><span class="p">,</span><span class="n">y_proba_path</span><span class="p">)</span>
        <span class="k">else</span><span class="p">:</span>
            <span class="c1"># if path exist load the y probabilities file
</span>            <span class="n">y_cc_train_proba</span> <span class="o">=</span> <span class="n">joblib</span><span class="p">.</span><span class="n">load</span><span class="p">(</span><span class="n">y_proba_path</span><span class="p">)</span>
        <span class="c1"># plot the roc curve
</span>        <span class="n">skplt</span><span class="p">.</span><span class="n">metrics</span><span class="p">.</span><span class="n">plot_roc</span><span class="p">(</span><span class="n">y_cc_train_prep</span><span class="p">,</span> <span class="n">y_cc_train_proba</span><span class="p">,</span> <span class="n">title</span> <span class="o">=</span> <span class="s">'ROC curve for {0}'</span><span class="p">.</span><span class="nb">format</span><span class="p">(</span><span class="n">model_name</span><span class="p">),</span> <span class="n">cmap</span><span class="o">=</span><span class="s">'cool'</span><span class="p">,</span><span class="n">figsize</span><span class="o">=</span><span class="p">(</span><span class="mi">8</span><span class="p">,</span><span class="mi">6</span><span class="p">),</span> <span class="n">text_fontsize</span><span class="o">=</span><span class="s">'large'</span><span class="p">)</span>
        <span class="c1"># remove the grid
</span>        <span class="n">plt</span><span class="p">.</span><span class="n">grid</span><span class="p">(</span><span class="n">visible</span><span class="o">=</span><span class="bp">None</span><span class="p">)</span>
        <span class="n">plt</span><span class="p">.</span><span class="n">show</span><span class="p">()</span>
        <span class="k">print</span><span class="p">(</span><span class="s">'</span><span class="se">\n</span><span class="s">'</span><span class="p">)</span>
    <span class="c1"># When we are dealing with the final model
</span>    <span class="k">else</span><span class="p">:</span>
        <span class="c1"># check if y probabilities file exists, if not create it
</span>        <span class="n">y_proba_path_final</span> <span class="o">=</span> <span class="n">Path</span><span class="p">(</span><span class="s">'saved_models_final/{0}/y_cc_train_proba_{0}_final.sav'</span><span class="p">.</span><span class="nb">format</span><span class="p">(</span><span class="n">model_name</span><span class="p">))</span>
        <span class="k">try</span><span class="p">:</span>
            <span class="n">y_proba_path_final</span><span class="p">.</span><span class="n">resolve</span><span class="p">(</span><span class="n">strict</span><span class="o">=</span><span class="bp">True</span><span class="p">)</span>
        <span class="k">except</span> <span class="nb">FileNotFoundError</span><span class="p">:</span>
            <span class="n">y_cc_train_proba_final</span> <span class="o">=</span> <span class="n">model_trn</span><span class="p">.</span><span class="n">predict_proba</span><span class="p">(</span><span class="n">X_cc_train_prep</span><span class="p">)</span>
            <span class="n">joblib</span><span class="p">.</span><span class="n">dump</span><span class="p">(</span><span class="n">y_cc_train_proba_final</span><span class="p">,</span><span class="n">y_proba_path_final</span><span class="p">)</span>
        <span class="k">else</span><span class="p">:</span>
            <span class="c1"># if path exist load the y probabilities file
</span>            <span class="n">y_cc_train_proba_final</span> <span class="o">=</span> <span class="n">joblib</span><span class="p">.</span><span class="n">load</span><span class="p">(</span><span class="n">y_proba_path_final</span><span class="p">)</span>
        <span class="c1"># plot the roc curve
</span>        <span class="n">skplt</span><span class="p">.</span><span class="n">metrics</span><span class="p">.</span><span class="n">plot_roc</span><span class="p">(</span><span class="n">y_cc_train_prep</span><span class="p">,</span> <span class="n">y_cc_train_proba_final</span><span class="p">,</span> <span class="n">title</span> <span class="o">=</span> <span class="s">'ROC curve for {0}'</span><span class="p">.</span><span class="nb">format</span><span class="p">(</span><span class="n">model_name</span><span class="p">),</span> <span class="n">cmap</span><span class="o">=</span><span class="s">'cool'</span><span class="p">,</span><span class="n">figsize</span><span class="o">=</span><span class="p">(</span><span class="mi">8</span><span class="p">,</span><span class="mi">6</span><span class="p">),</span> <span class="n">text_fontsize</span><span class="o">=</span><span class="s">'large'</span><span class="p">)</span>
        <span class="c1"># remove the grid
</span>        <span class="n">plt</span><span class="p">.</span><span class="n">grid</span><span class="p">(</span><span class="n">visible</span><span class="o">=</span><span class="bp">None</span><span class="p">)</span>
        <span class="n">plt</span><span class="p">.</span><span class="n">show</span><span class="p">()</span>
        <span class="k">print</span><span class="p">(</span><span class="s">'</span><span class="se">\n</span><span class="s">'</span><span class="p">)</span>
</code></pre></div></div>

<p>This other function will print the classification report. A classification report is a table that describes the performance of a classification model and has information like precision, recall, f1-score, support, accuracy.</p>

<div class="language-python highlighter-rouge"><div class="highlight"><pre class="highlight"><code><span class="k">def</span> <span class="nf">score_func</span><span class="p">(</span><span class="n">model_trn</span><span class="p">,</span> <span class="n">model_name</span><span class="p">,</span> <span class="n">final_model</span><span class="o">=</span><span class="bp">False</span><span class="p">):</span>
    <span class="s">'''
    Function to display the classification report
    '''</span>
    <span class="k">if</span> <span class="n">final_model</span> <span class="o">==</span> <span class="bp">False</span><span class="p">:</span>
        <span class="n">class_report</span> <span class="o">=</span> <span class="n">classification_report</span><span class="p">(</span><span class="n">y_cc_train_prep</span><span class="p">,</span><span class="n">y_prediction_func</span><span class="p">(</span><span class="n">model_trn</span><span class="p">,</span><span class="n">model_name</span><span class="p">))</span>
        <span class="k">print</span><span class="p">(</span><span class="n">class_report</span><span class="p">)</span>
    <span class="c1"># When we are dealing with the final model
</span>    <span class="k">else</span><span class="p">:</span>
        <span class="n">class_report_final</span> <span class="o">=</span> <span class="n">classification_report</span><span class="p">(</span><span class="n">y_cc_train_prep</span><span class="p">,</span><span class="n">y_prediction_func</span><span class="p">(</span><span class="n">model_trn</span><span class="p">,</span><span class="n">model_name</span><span class="p">,</span><span class="n">final_model</span><span class="o">=</span><span class="bp">True</span><span class="p">))</span>
        <span class="k">print</span><span class="p">(</span><span class="n">class_report_final</span><span class="p">)</span>
</code></pre></div></div>

<p>This function will train the models and save them in the <code class="language-plaintext highlighter-rouge">saved_models</code> and <code class="language-plaintext highlighter-rouge">saved_models_final</code> folders.</p>

<div class="language-python highlighter-rouge"><div class="highlight"><pre class="highlight"><code><span class="k">def</span> <span class="nf">train_model</span><span class="p">(</span><span class="n">model</span><span class="p">,</span><span class="n">model_name</span><span class="p">,</span><span class="n">final_model</span><span class="o">=</span><span class="bp">False</span><span class="p">):</span>
    <span class="s">'''
    Function to train and save the model
    '''</span>
    <span class="c1"># If we are not training the final model
</span>    <span class="k">if</span> <span class="n">final_model</span> <span class="o">==</span> <span class="bp">False</span><span class="p">:</span>
        <span class="c1"># Check if the model file exists and if not, create, train and save it
</span>        <span class="n">model_file_path</span> <span class="o">=</span> <span class="n">Path</span><span class="p">(</span><span class="s">'saved_models/{0}/{0}_model.sav'</span><span class="p">.</span><span class="nb">format</span><span class="p">(</span><span class="n">model_name</span><span class="p">))</span>
        <span class="k">try</span><span class="p">:</span>
            <span class="n">model_file_path</span><span class="p">.</span><span class="n">resolve</span><span class="p">(</span><span class="n">strict</span><span class="o">=</span><span class="bp">True</span><span class="p">)</span>
        <span class="k">except</span> <span class="nb">FileNotFoundError</span><span class="p">:</span>
            <span class="k">if</span> <span class="n">model_name</span> <span class="o">==</span> <span class="s">'sgd'</span><span class="p">:</span>
                <span class="c1"># for sgd, loss = 'hinge' does not have a predict_proba method. Therefore, we use a calibrated model
</span>                <span class="n">calibrated_model</span> <span class="o">=</span> <span class="n">CalibratedClassifierCV</span><span class="p">(</span><span class="n">model</span><span class="p">,</span> <span class="n">cv</span><span class="o">=</span><span class="mi">10</span><span class="p">,</span> <span class="n">method</span><span class="o">=</span><span class="s">'sigmoid'</span><span class="p">)</span>
                <span class="c1"># train the model
</span>                <span class="n">model_trn</span> <span class="o">=</span> <span class="n">calibrated_model</span><span class="p">.</span><span class="n">fit</span><span class="p">(</span><span class="n">X_cc_train_prep</span><span class="p">,</span><span class="n">y_cc_train_prep</span><span class="p">)</span>
            <span class="c1"># For the rest of the models
</span>            <span class="k">else</span><span class="p">:</span>
                <span class="n">model_trn</span> <span class="o">=</span> <span class="n">model</span><span class="p">.</span><span class="n">fit</span><span class="p">(</span><span class="n">X_cc_train_prep</span><span class="p">,</span><span class="n">y_cc_train_prep</span><span class="p">)</span>
            <span class="c1"># save the model
</span>            <span class="n">joblib</span><span class="p">.</span><span class="n">dump</span><span class="p">(</span><span class="n">model_trn</span><span class="p">,</span><span class="n">model_file_path</span><span class="p">)</span>
            <span class="k">return</span> <span class="n">model_trn</span>
        <span class="k">else</span><span class="p">:</span>
            <span class="c1"># if path exist load the model
</span>            <span class="n">model_trn</span> <span class="o">=</span> <span class="n">joblib</span><span class="p">.</span><span class="n">load</span><span class="p">(</span><span class="n">model_file_path</span><span class="p">)</span>
            <span class="k">return</span> <span class="n">model_trn</span>
    <span class="k">else</span><span class="p">:</span>
        <span class="c1"># check if the final model file exist and if not create, train and save it
</span>        <span class="n">final_model_file_path</span> <span class="o">=</span> <span class="n">Path</span><span class="p">(</span><span class="s">'saved_models_final/{0}/{0}_model.sav'</span><span class="p">.</span><span class="nb">format</span><span class="p">(</span><span class="n">model_name</span><span class="p">))</span>
        <span class="k">try</span><span class="p">:</span>
            <span class="n">final_model_file_path</span><span class="p">.</span><span class="n">resolve</span><span class="p">(</span><span class="n">strict</span><span class="o">=</span><span class="bp">True</span><span class="p">)</span>
        <span class="k">except</span> <span class="nb">FileNotFoundError</span><span class="p">:</span>
            <span class="c1"># train the model
</span>            <span class="n">model_trn</span> <span class="o">=</span> <span class="n">model</span><span class="p">.</span><span class="n">fit</span><span class="p">(</span><span class="n">X_cc_train_prep</span><span class="p">,</span><span class="n">y_cc_train_prep</span><span class="p">)</span>
            <span class="n">joblib</span><span class="p">.</span><span class="n">dump</span><span class="p">(</span><span class="n">model_trn</span><span class="p">,</span><span class="n">final_model_file_path</span><span class="p">)</span>
            <span class="k">return</span> <span class="n">model_trn</span>
        <span class="k">else</span><span class="p">:</span>
            <span class="c1"># if path exist load the model
</span>            <span class="n">model_trn</span> <span class="o">=</span> <span class="n">joblib</span><span class="p">.</span><span class="n">load</span><span class="p">(</span><span class="n">final_model_file_path</span><span class="p">)</span>
            <span class="k">return</span> <span class="n">model_trn</span>
</code></pre></div></div>

<p>This function below will look at the <code class="language-plaintext highlighter-rouge">folder_check_model</code> which will check if <code class="language-plaintext highlighter-rouge">saved_models</code> folder exists; if not, it will create it.</p>

<div class="language-python highlighter-rouge"><div class="highlight"><pre class="highlight"><code><span class="k">def</span> <span class="nf">folder_check_model</span><span class="p">():</span>
    <span class="c1"># check if the folder for saving the model exists, if not create it
</span>    <span class="k">if</span> <span class="ow">not</span> <span class="n">os</span><span class="p">.</span><span class="n">path</span><span class="p">.</span><span class="n">exists</span><span class="p">(</span><span class="s">'saved_models/{}'</span><span class="p">.</span><span class="nb">format</span><span class="p">(</span><span class="n">model_name</span><span class="p">)):</span>
        <span class="n">os</span><span class="p">.</span><span class="n">makedirs</span><span class="p">(</span><span class="s">'saved_models/{}'</span><span class="p">.</span><span class="nb">format</span><span class="p">(</span><span class="n">model_name</span><span class="p">))</span>
</code></pre></div></div>

<div class="language-python highlighter-rouge"><div class="highlight"><pre class="highlight"><code><span class="c1"># loop over all the models
</span><span class="k">for</span> <span class="n">model_name</span><span class="p">,</span><span class="n">model</span> <span class="ow">in</span> <span class="n">classifiers</span><span class="p">.</span><span class="n">items</span><span class="p">():</span>
    <span class="c1"># title formatting
</span>    <span class="k">print</span><span class="p">(</span><span class="s">'</span><span class="se">\n</span><span class="s">'</span><span class="p">)</span>
    <span class="k">print</span><span class="p">(</span><span class="s">'</span><span class="se">\n</span><span class="s">'</span><span class="p">)</span>
    <span class="k">print</span><span class="p">(</span><span class="s">'  {}  '</span><span class="p">.</span><span class="n">center</span><span class="p">(</span><span class="mi">50</span><span class="p">,</span><span class="s">'-'</span><span class="p">).</span><span class="nb">format</span><span class="p">(</span><span class="n">model_name</span><span class="p">))</span>
    <span class="k">print</span><span class="p">(</span><span class="s">'</span><span class="se">\n</span><span class="s">'</span><span class="p">)</span>
    <span class="c1"># check if the folder for saving the model exists; if not create it
</span>    <span class="n">folder_check_model</span><span class="p">()</span>
    <span class="c1"># train the model
</span>    <span class="n">model_trn</span> <span class="o">=</span> <span class="n">train_model</span><span class="p">(</span><span class="n">model</span><span class="p">,</span><span class="n">model_name</span><span class="p">)</span>
    <span class="c1"># print the scores from the classification report
</span>    <span class="n">score_func</span><span class="p">(</span><span class="n">model_trn</span><span class="p">,</span> <span class="n">model_name</span><span class="p">)</span>
    <span class="c1"># plot the ROC curve
</span>    <span class="n">roc_curve_func</span><span class="p">(</span><span class="n">model_trn</span><span class="p">,</span><span class="n">model_name</span><span class="p">)</span>
    <span class="c1"># plot the confusion matrix
</span>    <span class="n">confusion_matrix_func</span><span class="p">(</span><span class="n">model_trn</span><span class="p">,</span><span class="n">model_name</span><span class="p">)</span>
    <span class="c1"># plot feature importance
</span>    <span class="n">feat_importance_plot</span><span class="p">(</span><span class="n">model_trn</span><span class="p">,</span> <span class="n">model_name</span><span class="p">)</span>
    <span class="n">warnings</span><span class="p">.</span><span class="n">filterwarnings</span><span class="p">(</span><span class="s">"ignore"</span><span class="p">)</span>

</code></pre></div></div>

<div class="language-plaintext highlighter-rouge"><div class="highlight"><pre class="highlight"><code>----------------------  sgd  ----------------------


              precision    recall  f1-score   support

           0       0.57      0.61      0.59     23272
           1       0.58      0.54      0.56     23272

    accuracy                           0.58     46544
   macro avg       0.58      0.58      0.58     46544
weighted avg       0.58      0.58      0.58     46544
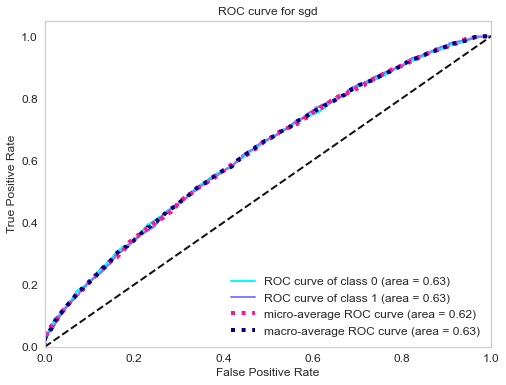
</code></pre></div></div>

<p><img src="/blog/assets/post_cont_image/output_264_1.png" alt="png" /></p>

<p><img src="/blog/assets/post_cont_image/output_264_3.png" alt="png" /></p>

<div class="language-plaintext highlighter-rouge"><div class="highlight"><pre class="highlight"><code>No feature importance for sgd


----------------------  logistic_regression  ----------------------


              precision    recall  f1-score   support

           0       0.59      0.57      0.58     23272
           1       0.59      0.61      0.60     23272

    accuracy                           0.59     46544
   macro avg       0.59      0.59      0.59     46544
weighted avg       0.59      0.59      0.59     46544
</code></pre></div></div>

<p><img src="/blog/assets/post_cont_image/output_264_5.png" alt="png" /></p>

<p><img src="/blog/assets/post_cont_image/output_264_7.png" alt="png" /></p>

<p><img src="/blog/assets/post_cont_image/output_264_9.png" alt="png" /></p>

<p><img src="/blog/assets/post_cont_image/output_264_11.png" alt="png" /></p>

<div class="language-plaintext highlighter-rouge"><div class="highlight"><pre class="highlight"><code>----------------------  support_vector_machine  ----------------------


              precision    recall  f1-score   support

           0       0.87      0.81      0.84     23272
           1       0.83      0.88      0.85     23272

    accuracy                           0.85     46544
   macro avg       0.85      0.85      0.85     46544
weighted avg       0.85      0.85      0.85     46544
</code></pre></div></div>

<p><img src="/blog/assets/post_cont_image/output_264_13.png" alt="png" /></p>

<p><img src="/blog/assets/post_cont_image/output_264_15.png" alt="png" /></p>

<div class="language-plaintext highlighter-rouge"><div class="highlight"><pre class="highlight"><code>No feature importance for support_vector_machine


----------------------  decision_tree  ----------------------


              precision    recall  f1-score   support

           0       0.98      0.98      0.98     23272
           1       0.98      0.98      0.98     23272

    accuracy                           0.98     46544
   macro avg       0.98      0.98      0.98     46544
weighted avg       0.98      0.98      0.98     46544
</code></pre></div></div>

<p><img src="/blog/assets/post_cont_image/output_264_17.png" alt="png" /></p>

<p><img src="/blog/assets/post_cont_image/output_264_19.png" alt="png" /></p>

<p><img src="/blog/assets/post_cont_image/output_264_21.png" alt="png" /></p>

<p><img src="/blog/assets/post_cont_image/output_264_23.png" alt="png" /></p>

<div class="language-plaintext highlighter-rouge"><div class="highlight"><pre class="highlight"><code>----------------------  random_forest  ----------------------


              precision    recall  f1-score   support

           0       0.99      0.99      0.99     23272
           1       0.99      0.99      0.99     23272

    accuracy                           0.99     46544
   macro avg       0.99      0.99      0.99     46544
weighted avg       0.99      0.99      0.99     46544
</code></pre></div></div>

<p><img src="/blog/assets/post_cont_image/output_264_25.png" alt="png" /></p>

<p><img src="/blog/assets/post_cont_image/output_264_27.png" alt="png" /></p>

<p><img src="/blog/assets/post_cont_image/output_264_29.png" alt="png" /></p>

<p><img src="/blog/assets/post_cont_image/output_264_31.png" alt="png" /></p>

<div class="language-plaintext highlighter-rouge"><div class="highlight"><pre class="highlight"><code>----------------------  gaussian_naive_bayes  ----------------------


              precision    recall  f1-score   support

           0       0.60      0.50      0.55     23272
           1       0.57      0.66      0.61     23272

    accuracy                           0.58     46544
   macro avg       0.58      0.58      0.58     46544
weighted avg       0.58      0.58      0.58     46544
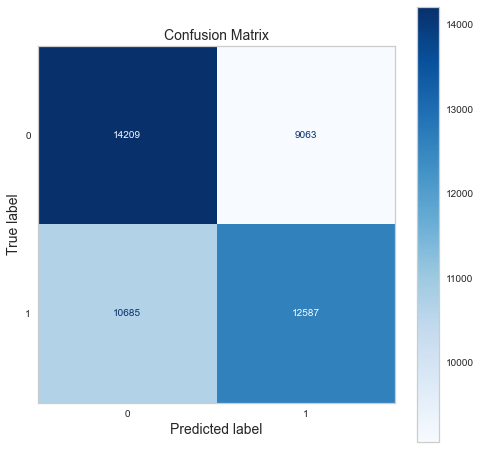
</code></pre></div></div>

<p><img src="/blog/assets/post_cont_image/output_264_33.png" alt="png" /></p>

<p><img src="/blog/assets/post_cont_image/output_264_35.png" alt="png" /></p>

<div class="language-plaintext highlighter-rouge"><div class="highlight"><pre class="highlight"><code>No feature importance for gaussian_naive_bayes


----------------------  k_nearest_neighbors  ----------------------


              precision    recall  f1-score   support

           0       0.98      0.96      0.97     23272
           1       0.96      0.98      0.97     23272

    accuracy                           0.97     46544
   macro avg       0.97      0.97      0.97     46544
weighted avg       0.97      0.97      0.97     46544
</code></pre></div></div>

<p><img src="/blog/assets/post_cont_image/output_264_37.png" alt="png" /></p>

<p><img src="/blog/assets/post_cont_image/output_264_39.png" alt="png" /></p>

<div class="language-plaintext highlighter-rouge"><div class="highlight"><pre class="highlight"><code>No feature importance for k_nearest_neighbors


----------------------  gradient_boosting  ----------------------


              precision    recall  f1-score   support

           0       0.90      0.90      0.90     23272
           1       0.90      0.90      0.90     23272

    accuracy                           0.90     46544
   macro avg       0.90      0.90      0.90     46544
weighted avg       0.90      0.90      0.90     46544
</code></pre></div></div>

<p><img src="/blog/assets/post_cont_image/output_264_41.png" alt="png" /></p>

<p><img src="/blog/assets/post_cont_image/output_264_43.png" alt="png" /></p>

<p><img src="/blog/assets/post_cont_image/output_264_45.png" alt="png" /></p>

<p><img src="/blog/assets/post_cont_image/output_264_47.png" alt="png" /></p>

<div class="language-plaintext highlighter-rouge"><div class="highlight"><pre class="highlight"><code>----------------------  linear_discriminant_analysis  ----------------------


              precision    recall  f1-score   support

           0       0.60      0.56      0.58     23272
           1       0.59      0.62      0.60     23272

    accuracy                           0.59     46544
   macro avg       0.59      0.59      0.59     46544
weighted avg       0.59      0.59      0.59     46544
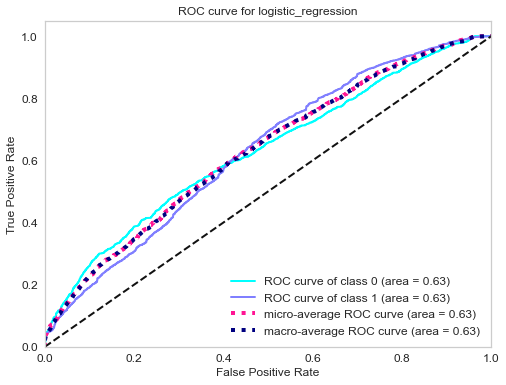
</code></pre></div></div>

<p><img src="/blog/assets/post_cont_image/output_264_49.png" alt="png" /></p>

<p><img src="/blog/assets/post_cont_image/output_264_51.png" alt="png" /></p>

<p><img src="/blog/assets/post_cont_image/output_264_53.png" alt="png" /></p>

<p><img src="/blog/assets/post_cont_image/output_264_55.png" alt="png" /></p>

<div class="language-plaintext highlighter-rouge"><div class="highlight"><pre class="highlight"><code>----------------------  bagging  ----------------------


              precision    recall  f1-score   support

           0       0.99      0.99      0.99     23272
           1       0.99      0.99      0.99     23272

    accuracy                           0.99     46544
   macro avg       0.99      0.99      0.99     46544
weighted avg       0.99      0.99      0.99     46544
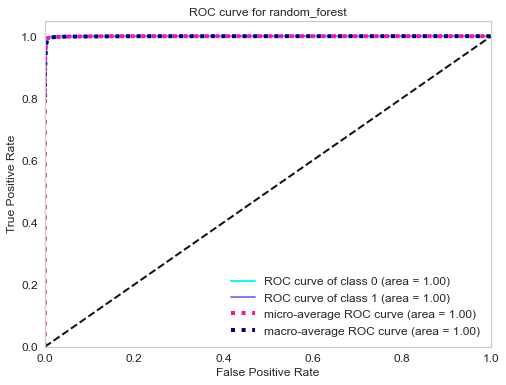
</code></pre></div></div>

<p><img src="/blog/assets/post_cont_image/output_264_57.png" alt="png" /></p>

<p><img src="/blog/assets/post_cont_image/output_264_59.png" alt="png" /></p>

<div class="language-plaintext highlighter-rouge"><div class="highlight"><pre class="highlight"><code>No feature importance for bagging


----------------------  neural_network  ----------------------


              precision    recall  f1-score   support

           0       0.97      0.94      0.96     23272
           1       0.94      0.97      0.96     23272

    accuracy                           0.96     46544
   macro avg       0.96      0.96      0.96     46544
weighted avg       0.96      0.96      0.96     46544
</code></pre></div></div>

<p><img src="/blog/assets/post_cont_image/output_264_61.png" alt="png" /></p>

<p><img src="/blog/assets/post_cont_image/output_264_63.png" alt="png" /></p>

<div class="language-plaintext highlighter-rouge"><div class="highlight"><pre class="highlight"><code>No feature importance for neural_network


----------------------  adaboost  ----------------------


              precision    recall  f1-score   support

           0       0.78      0.76      0.77     23272
           1       0.77      0.79      0.78     23272

    accuracy                           0.77     46544
   macro avg       0.77      0.77      0.77     46544
weighted avg       0.77      0.77      0.77     46544
</code></pre></div></div>

<p><img src="/blog/assets/post_cont_image/output_264_65.png" alt="png" /></p>

<p><img src="/blog/assets/post_cont_image/output_264_67.png" alt="png" /></p>

<p><img src="/blog/assets/post_cont_image/output_264_69.png" alt="png" /></p>

<p><img src="/blog/assets/post_cont_image/output_264_71.png" alt="png" /></p>

<div class="language-plaintext highlighter-rouge"><div class="highlight"><pre class="highlight"><code>----------------------  extra_trees  ----------------------


              precision    recall  f1-score   support

           0       0.99      0.99      0.99     23272
           1       0.99      0.99      0.99     23272

    accuracy                           0.99     46544
   macro avg       0.99      0.99      0.99     46544
weighted avg       0.99      0.99      0.99     46544
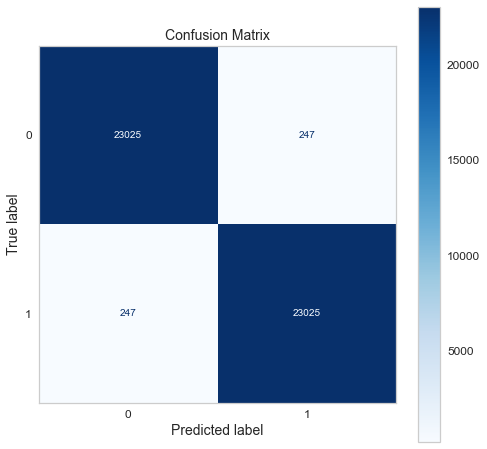
</code></pre></div></div>

<p><img src="/blog/assets/post_cont_image/output_264_73.png" alt="png" /></p>

<p><img src="/blog/assets/post_cont_image/output_264_75.png" alt="png" /></p>

<p><img src="/blog/assets/post_cont_image/output_264_77.png" alt="png" /></p>

<p><img src="/blog/assets/post_cont_image/output_264_79.png" alt="png" /></p>

<h3>What metrics to use in order to choose the best model for this problem?</h3>

<p>Lastly, we create a for loop function that will go through the dictionary of models and call all the functions that we have defined above.</p>

<p>Since the objective of this problem is to minimize the risk of a credit default, the metrics to use depends on the current economic situation:</p>

<ul>
  <li>
    <p>During a bull market (when the economy is expanding), people feel wealthy and are employed. Money is usually cheap, and the risk of default is low because of economic stability and low unemployment. The financial institution can handle the risk of default; therefore, it is not very strict about giving credit. The financial institution can handle some bad clients as long as most credit card owners are good clients (aka those who pay back their credit in time and in total).In this case, having a good recall (sensitivity) is ideal.</p>
  </li>
  <li>
    <p>During a bear market (when the economy is contracting), people lose their jobs and money through the stock market and other investment venues. Many people struggle to meet their financial obligations. The financial institution, therefore, tends to be more conservative in giving out credit or loans. The financial institution can’t afford to give out credit to many clients who won’t be able to pay back their credit. The financial institution would rather have a smaller number of good clients, even if it means that some good clients are denied credit. In this case, having good precision (specificity) is desirable.</p>

    <p><strong><em>Note</em></strong>: There is always a trade-off between precision and recall. Choosing the right metrics depends on the problem you are solving.</p>

    <p><strong><em>Conclusion</em></strong>: Since the time I worked on this project (beginning in 2022), we have been in the longest bull market (excluding March 2020 flash crash) ever recorded; we will use recall as our metric.</p>
  </li>
</ul>

<h3>Top model</h3>

<p>Using the ROC curve and recall, we can conclude that the best model is:</p>
<ul>
  <li>Gradient boosting classifier</li>
</ul>

<p>Let’s look at the picture below to understand how to interpret a ROC curve.</p>

<p><img src="/blog/assets/post_cont_image/roc_curve.svg" alt="heatmap" /></p>

<p>Source: <a href="https://en.wikipedia.org/wiki/Receiver_operating_characteristic#/media/File:Roc_curve.svg">Wikipedia</a></p>

<p>With this ROC curve, we can compare the performance of different classifiers. The closer the curve is to the top left corner of the plot without actually reaching the far end of the corner, the better the model</p>

<ul>
  <li>Any classifier’s ROC below the dashed red line performs worst than random chance. Random chance is a 50% chance of being correct for a binary classifier.</li>
  <li>Any classifier with the ROC curve blended with the dashed red line is no better than tossing a fair coin.</li>
  <li>The orange curve is slightly better than the dashed red line, but that would not be considered a good classifier.</li>
  <li>The green curve is much better than the orange one but could be better.</li>
  <li>The blue curve is the best classifier here; this curve gets closer to the top left without touching the top left corner.</li>
  <li>Lastly, the “perfect” curve that touches the top left corner is not a good classifier. You might be asked why; well, a classifier with this curve is overfitting, meaning it has learned so well on the training data but can’t generalize well on the test data (unseen data).</li>
</ul>

<p>So what to do when a classifier is overfitting? Well, these are the options to deal with this issue:</p>
<ul>
  <li>Use a simplified model by selecting fewer parameters or constraining the model (also called regularization).</li>
  <li>Gather more training data.</li>
  <li>Discard outliers and fix missing data.</li>
</ul>

<h3>Test the final model on the test set</h3>

<p>Now that we have our model trained, we can use it to predict the classes on the test set.</p>

<div class="language-python highlighter-rouge"><div class="highlight"><pre class="highlight"><code><span class="n">cc_test_copy</span><span class="p">.</span><span class="n">head</span><span class="p">(</span><span class="mi">5</span><span class="p">)</span>
</code></pre></div></div>

<div>
<style scoped="">
    .dataframe tbody tr th:only-of-type {
        vertical-align: middle;
    }

    .dataframe tbody tr th {
        vertical-align: top;
    }

    .dataframe thead th {
        text-align: right;
    }
</style>
<table border="1" class="dataframe">
  <thead>
    <tr style="text-align: right;">
      <th></th>
      <th>ID</th>
      <th>Gender</th>
      <th>Has a car</th>
      <th>Has a property</th>
      <th>Children count</th>
      <th>Income</th>
      <th>Employment status</th>
      <th>Education level</th>
      <th>Marital status</th>
      <th>Dwelling</th>
      <th>Age</th>
      <th>Employment length</th>
      <th>Has a mobile phone</th>
      <th>Has a work phone</th>
      <th>Has a phone</th>
      <th>Has an email</th>
      <th>Job title</th>
      <th>Family member count</th>
      <th>Account age</th>
      <th>Is high risk</th>
    </tr>
  </thead>
  <tbody>
    <tr>
      <th>0</th>
      <td>5091261</td>
      <td>F</td>
      <td>N</td>
      <td>Y</td>
      <td>0</td>
      <td>202500.00</td>
      <td>State servant</td>
      <td>Secondary / secondary special</td>
      <td>Separated</td>
      <td>House / apartment</td>
      <td>-16834</td>
      <td>-1692</td>
      <td>1</td>
      <td>0</td>
      <td>0</td>
      <td>0</td>
      <td>Medicine staff</td>
      <td>1.00</td>
      <td>-6.00</td>
      <td>0</td>
    </tr>
    <tr>
      <th>1</th>
      <td>5096963</td>
      <td>M</td>
      <td>Y</td>
      <td>N</td>
      <td>0</td>
      <td>675000.00</td>
      <td>Commercial associate</td>
      <td>Higher education</td>
      <td>Married</td>
      <td>House / apartment</td>
      <td>-18126</td>
      <td>-948</td>
      <td>1</td>
      <td>0</td>
      <td>1</td>
      <td>0</td>
      <td>Managers</td>
      <td>2.00</td>
      <td>-16.00</td>
      <td>0</td>
    </tr>
    <tr>
      <th>2</th>
      <td>5087880</td>
      <td>F</td>
      <td>N</td>
      <td>N</td>
      <td>0</td>
      <td>234000.00</td>
      <td>State servant</td>
      <td>Higher education</td>
      <td>Civil marriage</td>
      <td>House / apartment</td>
      <td>-21967</td>
      <td>-5215</td>
      <td>1</td>
      <td>0</td>
      <td>0</td>
      <td>1</td>
      <td>Core staff</td>
      <td>2.00</td>
      <td>-52.00</td>
      <td>0</td>
    </tr>
    <tr>
      <th>3</th>
      <td>5021949</td>
      <td>F</td>
      <td>Y</td>
      <td>Y</td>
      <td>0</td>
      <td>445500.00</td>
      <td>Commercial associate</td>
      <td>Higher education</td>
      <td>Married</td>
      <td>House / apartment</td>
      <td>-12477</td>
      <td>-456</td>
      <td>1</td>
      <td>0</td>
      <td>0</td>
      <td>0</td>
      <td>Managers</td>
      <td>2.00</td>
      <td>-54.00</td>
      <td>0</td>
    </tr>
    <tr>
      <th>4</th>
      <td>5105705</td>
      <td>F</td>
      <td>Y</td>
      <td>N</td>
      <td>0</td>
      <td>225000.00</td>
      <td>Working</td>
      <td>Secondary / secondary special</td>
      <td>Married</td>
      <td>Municipal apartment</td>
      <td>-12155</td>
      <td>-667</td>
      <td>1</td>
      <td>0</td>
      <td>0</td>
      <td>0</td>
      <td>Laborers</td>
      <td>2.00</td>
      <td>-48.00</td>
      <td>0</td>
    </tr>
  </tbody>
</table>
</div>

<p>We pass to the scikit-learn pipeline the test set as we did before for the training set to obtain a preprocessed dataset ready for our model.</p>

<div class="language-python highlighter-rouge"><div class="highlight"><pre class="highlight"><code><span class="n">cc_test_prep</span> <span class="o">=</span> <span class="n">full_pipeline</span><span class="p">(</span><span class="n">cc_test_copy</span><span class="p">)</span>
</code></pre></div></div>

<p>We extract the independent variables/features and the target variable and store them into variables <code class="language-plaintext highlighter-rouge">X_cc_test_prep</code> and <code class="language-plaintext highlighter-rouge">y_cc_test_prep</code> respectively.</p>

<div class="language-python highlighter-rouge"><div class="highlight"><pre class="highlight"><code><span class="c1"># split the train data into X and y (target)
</span><span class="n">X_cc_test_prep</span><span class="p">,</span> <span class="n">y_cc_test_prep</span> <span class="o">=</span> <span class="n">cc_test_prep</span><span class="p">.</span><span class="n">loc</span><span class="p">[:,</span> <span class="n">cc_test_prep</span><span class="p">.</span><span class="n">columns</span> <span class="o">!=</span> <span class="s">'Is high risk'</span><span class="p">],</span> <span class="n">cc_test_prep</span><span class="p">[</span><span class="s">'Is high risk'</span><span class="p">].</span><span class="n">astype</span><span class="p">(</span><span class="s">'int64'</span><span class="p">)</span>
</code></pre></div></div>

<p>Next, we train the model.</p>

<div class="language-python highlighter-rouge"><div class="highlight"><pre class="highlight"><code><span class="c1"># train the model
</span><span class="n">model_trn</span> <span class="o">=</span> <span class="n">train_model</span><span class="p">(</span><span class="n">classifiers</span><span class="p">[</span><span class="s">'gradient_boosting'</span><span class="p">],</span><span class="s">'gradient_boosting'</span><span class="p">)</span>
</code></pre></div></div>

<p>Then predict the dependent variable (predicted target) and store the prediction in the <code class="language-plaintext highlighter-rouge">final_prediction</code> variable.</p>

<div class="language-python highlighter-rouge"><div class="highlight"><pre class="highlight"><code><span class="n">final_predictions</span> <span class="o">=</span> <span class="n">model_trn</span><span class="p">.</span><span class="n">predict</span><span class="p">(</span><span class="n">X_cc_test_prep</span><span class="p">)</span>
</code></pre></div></div>

<p>Now we use the <code class="language-plaintext highlighter-rouge">shape</code> method to get the number of rows and columns.</p>

<div class="language-python highlighter-rouge"><div class="highlight"><pre class="highlight"><code><span class="n">final_predictions</span><span class="p">.</span><span class="n">shape</span>
</code></pre></div></div>

<div class="language-plaintext highlighter-rouge"><div class="highlight"><pre class="highlight"><code>(11654,)
</code></pre></div></div>

<p>We use the <code class="language-plaintext highlighter-rouge">sum</code> function to compare the predictions and actual target values. We store the count of the correct predictions in <code class="language-plaintext highlighter-rouge">n_correct</code></p>

<div class="language-python highlighter-rouge"><div class="highlight"><pre class="highlight"><code><span class="n">n_correct</span> <span class="o">=</span> <span class="nb">sum</span><span class="p">(</span><span class="n">final_predictions</span> <span class="o">==</span> <span class="n">y_cc_test_prep</span><span class="p">)</span>
</code></pre></div></div>

<p>We divide the number of correct predictions by the total number of predictions to get the accuracy. We achieved 85% accuracy on the testing set, which is very good! :)</p>

<div class="language-python highlighter-rouge"><div class="highlight"><pre class="highlight"><code><span class="k">print</span><span class="p">(</span><span class="n">n_correct</span><span class="o">/</span><span class="nb">len</span><span class="p">(</span><span class="n">final_predictions</span><span class="p">))</span>
</code></pre></div></div>

<div class="language-plaintext highlighter-rouge"><div class="highlight"><pre class="highlight"><code>0.8579028659687661
</code></pre></div></div>

<h3>Deploying the model on AWS S3</h3>

<p>Now we will deploy the gradient boosting model we previously saved on our local machine to AWS S3, but what is an AWS S3 bucket, we may ask?</p>

<p>AWS S3 (S3 stands for Simple Storage Service) is a cloud storage service that provides access to affordable data storage in the cloud. Our trained gradient boosting model stored on S3 can be accessed with access and secret access keys.</p>

<p>Now, let’s store the gradient boosting model on AWS S3, but you must create an AWS account first. AWS has a free tier subscription, and hosting this model on an S3 bucket is free of charge; also, remember to create an account as a root user. After creating an account on AWS, sign in as a root user and type on the search bar s3.</p>

<p><img src="/blog/assets/post_cont_image/search_bar_s3.png" alt="search bar s3" /></p>

<p>You should see a dropdown menu; click on the first option with a green bucket logo.</p>

<p>It will take you to the Amazon s3 landing page, and click the Create bucket button.</p>

<p><img src="/blog/assets/post_cont_image/create_bucket.png" alt="create a bucket" /></p>

<p>You will be prompted with this page.</p>

<p><img src="/blog/assets/post_cont_image/create_bucket_page.png" alt="create bucket page" /></p>

<p>Give the bucket a name; in this case, we can call our bucket name creditcardapproval; in one word, select an AWS region close to your location for better latency. We will keep the default option for the rest, then hit the create bucket button.</p>

<p>We see the bucket we just created in the list of buckets on the S3 landing page. Click on that bucket name, and you shall see the page below.</p>

<p><img src="/blog/assets/post_cont_image/upload_bucket.png" alt="upload to bucket" /></p>

<p>Click on the upload button, which will prompt you to another page. Click on add files, locate our saved model, hit the upload button and wait for it to upload to the bucket.</p>

<p><img src="/blog/assets/post_cont_image/add_bucket.png" alt="add the file to the bucket" /></p>

<p>Our model is uploaded on AWS. The status should be successful if everything goes well, like the image below.</p>

<p><img src="/blog/assets/post_cont_image/succeeded_bucket.png" alt="succeeded uploaded bucket" /></p>

<p>We have our model uploaded on the S3; we can now access it and make a prediction using access and secret access keys. So how do we get those two keys? We use IAM user and we need to create one.</p>

<p>Search for iam and click on users.</p>

<p><img src="/blog/assets/post_cont_image/users_iam.png" alt="search iam" /></p>

<p>Assuming you don’t have any IAM users, you must create one by clicking on the add users.</p>

<p>Note: I already have mine created, so I will add a new IAM user to show you how to get the keys because we can only access the secret access key once after creating a new user. Once it is created, you can no longer access the secret access key. So keep it private and store it in a safe place.</p>

<p><img src="/blog/assets/post_cont_image/add_iam_user.png" alt="add IAM user" /></p>

<p>Give it a name, let’s say <code class="language-plaintext highlighter-rouge">stern-test</code> or whatever you want. Check the access key checkbox so we can access our s3 blob storage API; now let’s go to the next step, which is the permissions.</p>

<p><img src="/blog/assets/post_cont_image/user_details.png" alt="IAM user detail" /></p>

<p>We will attach existing policies directly for the permission page. The existing permission we will be using are <code class="language-plaintext highlighter-rouge">AmazonS3FullAccess</code> and <code class="language-plaintext highlighter-rouge">AWSCompromisedKeyQuarantineV2</code> and check the corresponding checkbox. We will set the user without the permission boundary.</p>

<p><img src="/blog/assets/post_cont_image/permissions_iam.png" alt="permission iam" /></p>

<p>The next page is the tags page. IAM tags are key-value pairs you can add to your user. Tags can include user information, such as an email address, or can be descriptive, such as a job title. You can use the tags to organize, track, or control access for this user. Tags are optional, so it is up to you if you want to set them or not. I did not use them on my end since it is not helpful for this project. Press next for the review of the IAM user.</p>

<p>The review page is just a summary of the previous pages. Once you have reviewed it and satisfy with it, create the user.</p>

<p>Now comes the most crucial page; once the user is created, you will be prompted with the user name, the access and the secret access key. These keys will be used when linking our Streamlit web app with the hosted model on AWS. You can download the two keys as CSV files or copy them on your clipboard.</p>

<p>Note: This is the only time AWS will give you access to the secret access key for security purposes. You must create a new IAM user if you lose the secret access key. Please don’t share the keys; copy/save them in a safe place.</p>

<p>Now that you have saved your access and secret access key, you can close the page, and if you go back to the IAM welcome page, you can see the user you just created.</p>

<p><img src="/blog/assets/post_cont_image/final_iam.png" alt="final page iam user" /></p>

<p><img src="/blog/assets/post_cont_image/confirmation-iam.png" alt="user creation confirmation" /></p>

<p>With our model stored on S3 and the two keys in our possession. We are good to go to our last two sections with Streamlit.</p>

<h3>Streamlit Web Interface</h3>

<p>So we have our trained model stored on AWS S3. We need an interface for the model where someone can input their information in a sort of form (which is the profile to predict) and see if they will be approved for a credit card or not.</p>

<p>While working on this project, I encountered an issue with how to prepare the applicant data (feature selection, engineering and data preprocessing). I encountered errors that I could not figure out how to solve. It got exacerbated due to the fact Streamlit does not support jupyter notebooks (.ipynb), only support python files (.py)</p>

<p>To overcome this issue, I appended the applicant’s profile to the training data and did all the data preprocessing with the training data in one python script (with the Streamlit interface code), then extracted the last row, which corresponds to our applicant.</p>

<p>Note: I appended the applicant profile to the training dataset but did not retrain the model (which may result in overfitting the model). I only did the data preprocessing, as we will see shortly.</p>

<p>The following code is part of a python script (saved as .py) used for the Streamlit web interface deployment. We will go through what each session does but won’t explain the data preprocessing part in detail because most of the functions are the same as those from the sections above.</p>

<div class="language-python highlighter-rouge"><div class="highlight"><pre class="highlight"><code><span class="c1"># libraries we have already seen
</span><span class="kn">import</span> <span class="nn">numpy</span> <span class="k">as</span> <span class="n">np</span>
<span class="kn">import</span> <span class="nn">pandas</span> <span class="k">as</span> <span class="n">pd</span>
<span class="kn">from</span> <span class="nn">sklearn.model_selection</span> <span class="kn">import</span> <span class="n">train_test_split</span>
<span class="kn">from</span> <span class="nn">sklearn.base</span> <span class="kn">import</span> <span class="n">BaseEstimator</span><span class="p">,</span> <span class="n">TransformerMixin</span>
<span class="kn">from</span> <span class="nn">sklearn.pipeline</span> <span class="kn">import</span> <span class="n">Pipeline</span>
<span class="kn">from</span> <span class="nn">sklearn.compose</span> <span class="kn">import</span> <span class="n">ColumnTransformer</span>
<span class="kn">from</span> <span class="nn">sklearn.preprocessing</span> <span class="kn">import</span> <span class="n">OneHotEncoder</span><span class="p">,</span> <span class="n">MinMaxScaler</span><span class="p">,</span> <span class="n">OrdinalEncoder</span>
<span class="kn">from</span> <span class="nn">sklearn.ensemble</span> <span class="kn">import</span> <span class="n">GradientBoostingClassifier</span>
<span class="kn">from</span> <span class="nn">imblearn.over_sampling</span> <span class="kn">import</span> <span class="n">SMOTE</span>
<span class="kn">import</span> <span class="nn">joblib</span>
<span class="c1"># new libraries we have not seen
</span><span class="kn">import</span> <span class="nn">streamlit</span> <span class="k">as</span> <span class="n">st</span>
<span class="kn">import</span> <span class="nn">boto3</span>
<span class="kn">import</span> <span class="nn">tempfile</span>
<span class="kn">import</span> <span class="nn">json</span>
<span class="kn">import</span> <span class="nn">requests</span>
<span class="kn">from</span> <span class="nn">streamlit_lottie</span> <span class="kn">import</span> <span class="n">st_lottie_spinner</span>

</code></pre></div></div>

<p>We have already seen the first libraries in the script above; they are all the same. The second parts are libraries we have not seen yet.</p>

<ul>
  <li>Streamlit is a fantastic library that creates an interface for our model, and very easy to deploy using the streamlit share free service</li>
  <li>Boto3 is the Amazon Web Services (AWS) Software Development Kit (SDK) for Python, allowing Python developers to write software that uses services like Amazon S3 and Amazon EC2. In this project, we will use it to connect our interface to the trained model on AWS S3 through the access and secret access key.</li>
  <li>tempfile is a module that creates temporary files and directories. In this project, it is used to store our trained model temporally in this python script</li>
  <li>json is used here for the streamlit hand animation while the model is predicting (This library is optional since it is for the animation and does not affect any way our predictions)</li>
  <li>request is used to get the animation from the server using HTTP request (This library is optional too)</li>
  <li>streamlit_lottie is the animation library for streamlit (This library is optional as well)</li>
</ul>

<p>We will quickly skim through the next section; if you forgot what each function does, feel free to refer to the sessions above.</p>

<p>So we will import the training and testing data directly as a raw file from Github.</p>

<p>Note: This data already has the target feature.</p>

<p>So now, we concatenate the training and testing on the row axis, do a resampling(reshuffling), and split the data (80% for the training data and 20% for the testing data). We make a copy of them and store them in <code class="language-plaintext highlighter-rouge">train_copy</code> and <code class="language-plaintext highlighter-rouge">test_copy</code>variables.</p>

<div class="language-python highlighter-rouge"><div class="highlight"><pre class="highlight"><code><span class="n">train_original</span> <span class="o">=</span> <span class="n">pd</span><span class="p">.</span><span class="n">read_csv</span><span class="p">(</span><span class="s">'https://raw.githubusercontent.com/semasuka/Credit-card-approval-prediction-classification/main/datasets/train.csv'</span><span class="p">)</span>

<span class="n">test_original</span> <span class="o">=</span> <span class="n">pd</span><span class="p">.</span><span class="n">read_csv</span><span class="p">(</span><span class="s">'https://raw.githubusercontent.com/semasuka/Credit-card-approval-prediction-classification/main/datasets/test.csv'</span><span class="p">)</span>

<span class="n">full_data</span> <span class="o">=</span> <span class="n">pd</span><span class="p">.</span><span class="n">concat</span><span class="p">([</span><span class="n">train_original</span><span class="p">,</span> <span class="n">test_original</span><span class="p">],</span> <span class="n">axis</span><span class="o">=</span><span class="mi">0</span><span class="p">)</span>

<span class="n">full_data</span> <span class="o">=</span> <span class="n">full_data</span><span class="p">.</span><span class="n">sample</span><span class="p">(</span><span class="n">frac</span><span class="o">=</span><span class="mi">1</span><span class="p">).</span><span class="n">reset_index</span><span class="p">(</span><span class="n">drop</span><span class="o">=</span><span class="bp">True</span><span class="p">)</span>


<span class="k">def</span> <span class="nf">data_split</span><span class="p">(</span><span class="n">df</span><span class="p">,</span> <span class="n">test_size</span><span class="p">):</span>
    <span class="n">train_df</span><span class="p">,</span> <span class="n">test_df</span> <span class="o">=</span> <span class="n">train_test_split</span><span class="p">(</span><span class="n">df</span><span class="p">,</span> <span class="n">test_size</span><span class="o">=</span><span class="n">test_size</span><span class="p">,</span> <span class="n">random_state</span><span class="o">=</span><span class="mi">42</span><span class="p">)</span>
    <span class="k">return</span> <span class="n">train_df</span><span class="p">.</span><span class="n">reset_index</span><span class="p">(</span><span class="n">drop</span><span class="o">=</span><span class="bp">True</span><span class="p">),</span> <span class="n">test_df</span><span class="p">.</span><span class="n">reset_index</span><span class="p">(</span><span class="n">drop</span><span class="o">=</span><span class="bp">True</span><span class="p">)</span>


<span class="n">train_original</span><span class="p">,</span> <span class="n">test_original</span> <span class="o">=</span> <span class="n">data_split</span><span class="p">(</span><span class="n">full_data</span><span class="p">,</span> <span class="mf">0.2</span><span class="p">)</span>

<span class="n">train_copy</span> <span class="o">=</span> <span class="n">train_original</span><span class="p">.</span><span class="n">copy</span><span class="p">()</span>
<span class="n">test_copy</span> <span class="o">=</span> <span class="n">test_original</span><span class="p">.</span><span class="n">copy</span><span class="p">()</span>
</code></pre></div></div>

<p>After this, we reuse the same functions and classes we used for the data preprocessing.</p>

<div class="language-python highlighter-rouge"><div class="highlight"><pre class="highlight"><code><span class="k">def</span> <span class="nf">value_cnt_norm_cal</span><span class="p">(</span><span class="n">df</span><span class="p">,</span> <span class="n">feature</span><span class="p">):</span>
    <span class="s">'''Function that will return the value count and frequency of each observation within a feature'''</span>
    <span class="c1"># get the value counts of each feature
</span>    <span class="n">ftr_value_cnt</span> <span class="o">=</span> <span class="n">df</span><span class="p">[</span><span class="n">feature</span><span class="p">].</span><span class="n">value_counts</span><span class="p">()</span>
    <span class="c1"># normalize the value counts on a scale of 100
</span>    <span class="n">ftr_value_cnt_norm</span> <span class="o">=</span> <span class="n">df</span><span class="p">[</span><span class="n">feature</span><span class="p">].</span><span class="n">value_counts</span><span class="p">(</span><span class="n">normalize</span><span class="o">=</span><span class="bp">True</span><span class="p">)</span> <span class="o">*</span> <span class="mi">100</span>
    <span class="c1"># concatenate the value counts with normalized value count column wise
</span>    <span class="n">ftr_value_cnt_concat</span> <span class="o">=</span> <span class="n">pd</span><span class="p">.</span><span class="n">concat</span><span class="p">(</span>
        <span class="p">[</span><span class="n">ftr_value_cnt</span><span class="p">,</span> <span class="n">ftr_value_cnt_norm</span><span class="p">],</span> <span class="n">axis</span><span class="o">=</span><span class="mi">1</span><span class="p">)</span>
    <span class="c1"># give it a column name
</span>    <span class="n">ftr_value_cnt_concat</span><span class="p">.</span><span class="n">columns</span> <span class="o">=</span> <span class="p">[</span><span class="s">'Count'</span><span class="p">,</span> <span class="s">'Frequency (%)'</span><span class="p">]</span>
    <span class="c1"># return the dataframe
</span>    <span class="k">return</span> <span class="n">ftr_value_cnt_concat</span>


<span class="k">class</span> <span class="nc">OutlierRemover</span><span class="p">(</span><span class="n">BaseEstimator</span><span class="p">,</span> <span class="n">TransformerMixin</span><span class="p">):</span>
    <span class="k">def</span> <span class="nf">__init__</span><span class="p">(</span><span class="bp">self</span><span class="p">,</span> <span class="n">feat_with_outliers</span><span class="o">=</span><span class="p">[</span><span class="s">'Family member count'</span><span class="p">,</span> <span class="s">'Income'</span><span class="p">,</span> <span class="s">'Employment length'</span><span class="p">]):</span>
        <span class="c1"># initializing the instance of the object
</span>        <span class="bp">self</span><span class="p">.</span><span class="n">feat_with_outliers</span> <span class="o">=</span> <span class="n">feat_with_outliers</span>

    <span class="k">def</span> <span class="nf">fit</span><span class="p">(</span><span class="bp">self</span><span class="p">,</span> <span class="n">df</span><span class="p">):</span>
        <span class="k">return</span> <span class="bp">self</span>

    <span class="k">def</span> <span class="nf">transform</span><span class="p">(</span><span class="bp">self</span><span class="p">,</span> <span class="n">df</span><span class="p">):</span>
        <span class="c1"># check if the feature in part of the dataset's features
</span>        <span class="k">if</span> <span class="p">(</span><span class="nb">set</span><span class="p">(</span><span class="bp">self</span><span class="p">.</span><span class="n">feat_with_outliers</span><span class="p">).</span><span class="n">issubset</span><span class="p">(</span><span class="n">df</span><span class="p">.</span><span class="n">columns</span><span class="p">)):</span>
            <span class="c1"># 25% quantile
</span>            <span class="n">Q1</span> <span class="o">=</span> <span class="n">df</span><span class="p">[</span><span class="bp">self</span><span class="p">.</span><span class="n">feat_with_outliers</span><span class="p">].</span><span class="n">quantile</span><span class="p">(.</span><span class="mi">25</span><span class="p">)</span>
            <span class="c1"># 75% quantile
</span>            <span class="n">Q3</span> <span class="o">=</span> <span class="n">df</span><span class="p">[</span><span class="bp">self</span><span class="p">.</span><span class="n">feat_with_outliers</span><span class="p">].</span><span class="n">quantile</span><span class="p">(.</span><span class="mi">75</span><span class="p">)</span>
            <span class="n">IQR</span> <span class="o">=</span> <span class="n">Q3</span> <span class="o">-</span> <span class="n">Q1</span>
            <span class="c1"># keep the data within 3 IQR only and discard the rest
</span>            <span class="n">df</span> <span class="o">=</span> <span class="n">df</span><span class="p">[</span><span class="o">~</span><span class="p">((</span><span class="n">df</span><span class="p">[</span><span class="bp">self</span><span class="p">.</span><span class="n">feat_with_outliers</span><span class="p">]</span> <span class="o">&lt;</span> <span class="p">(</span><span class="n">Q1</span> <span class="o">-</span> <span class="mi">3</span> <span class="o">*</span> <span class="n">IQR</span><span class="p">))</span> <span class="o">|</span>
                      <span class="p">(</span><span class="n">df</span><span class="p">[</span><span class="bp">self</span><span class="p">.</span><span class="n">feat_with_outliers</span><span class="p">]</span> <span class="o">&gt;</span> <span class="p">(</span><span class="n">Q3</span> <span class="o">+</span> <span class="mi">3</span> <span class="o">*</span> <span class="n">IQR</span><span class="p">))).</span><span class="nb">any</span><span class="p">(</span><span class="n">axis</span><span class="o">=</span><span class="mi">1</span><span class="p">)]</span>
            <span class="k">return</span> <span class="n">df</span>
        <span class="k">else</span><span class="p">:</span>
            <span class="k">print</span><span class="p">(</span><span class="s">"One or more features are not in the dataframe"</span><span class="p">)</span>
            <span class="k">return</span> <span class="n">df</span>


<span class="k">class</span> <span class="nc">DropFeatures</span><span class="p">(</span><span class="n">BaseEstimator</span><span class="p">,</span> <span class="n">TransformerMixin</span><span class="p">):</span>
    <span class="k">def</span> <span class="nf">__init__</span><span class="p">(</span><span class="bp">self</span><span class="p">,</span> <span class="n">feature_to_drop</span><span class="o">=</span><span class="p">[</span><span class="s">'ID'</span><span class="p">,</span> <span class="s">'Has a mobile phone'</span><span class="p">,</span> <span class="s">'Children count'</span><span class="p">,</span> <span class="s">'Job title'</span><span class="p">,</span> <span class="s">'Account age'</span><span class="p">]):</span>
        <span class="bp">self</span><span class="p">.</span><span class="n">feature_to_drop</span> <span class="o">=</span> <span class="n">feature_to_drop</span>

    <span class="k">def</span> <span class="nf">fit</span><span class="p">(</span><span class="bp">self</span><span class="p">,</span> <span class="n">df</span><span class="p">):</span>
        <span class="k">return</span> <span class="bp">self</span>

    <span class="k">def</span> <span class="nf">transform</span><span class="p">(</span><span class="bp">self</span><span class="p">,</span> <span class="n">df</span><span class="p">):</span>
        <span class="k">if</span> <span class="p">(</span><span class="nb">set</span><span class="p">(</span><span class="bp">self</span><span class="p">.</span><span class="n">feature_to_drop</span><span class="p">).</span><span class="n">issubset</span><span class="p">(</span><span class="n">df</span><span class="p">.</span><span class="n">columns</span><span class="p">)):</span>
            <span class="c1"># drop the list of features
</span>            <span class="n">df</span><span class="p">.</span><span class="n">drop</span><span class="p">(</span><span class="bp">self</span><span class="p">.</span><span class="n">feature_to_drop</span><span class="p">,</span> <span class="n">axis</span><span class="o">=</span><span class="mi">1</span><span class="p">,</span> <span class="n">inplace</span><span class="o">=</span><span class="bp">True</span><span class="p">)</span>
            <span class="k">return</span> <span class="n">df</span>
        <span class="k">else</span><span class="p">:</span>
            <span class="k">print</span><span class="p">(</span><span class="s">"One or more features are not in the dataframe"</span><span class="p">)</span>
            <span class="k">return</span> <span class="n">df</span>


<span class="k">class</span> <span class="nc">TimeConversionHandler</span><span class="p">(</span><span class="n">BaseEstimator</span><span class="p">,</span> <span class="n">TransformerMixin</span><span class="p">):</span>
    <span class="k">def</span> <span class="nf">__init__</span><span class="p">(</span><span class="bp">self</span><span class="p">,</span> <span class="n">feat_with_days</span><span class="o">=</span><span class="p">[</span><span class="s">'Employment length'</span><span class="p">,</span> <span class="s">'Age'</span><span class="p">]):</span>
        <span class="bp">self</span><span class="p">.</span><span class="n">feat_with_days</span> <span class="o">=</span> <span class="n">feat_with_days</span>

    <span class="k">def</span> <span class="nf">fit</span><span class="p">(</span><span class="bp">self</span><span class="p">,</span> <span class="n">X</span><span class="p">,</span> <span class="n">y</span><span class="o">=</span><span class="bp">None</span><span class="p">):</span>
        <span class="k">return</span> <span class="bp">self</span>

    <span class="k">def</span> <span class="nf">transform</span><span class="p">(</span><span class="bp">self</span><span class="p">,</span> <span class="n">X</span><span class="p">,</span> <span class="n">y</span><span class="o">=</span><span class="bp">None</span><span class="p">):</span>
        <span class="k">if</span> <span class="p">(</span><span class="nb">set</span><span class="p">(</span><span class="bp">self</span><span class="p">.</span><span class="n">feat_with_days</span><span class="p">).</span><span class="n">issubset</span><span class="p">(</span><span class="n">X</span><span class="p">.</span><span class="n">columns</span><span class="p">)):</span>
            <span class="c1"># convert days to absolute value using NumPy
</span>            <span class="n">X</span><span class="p">[[</span><span class="s">'Employment length'</span><span class="p">,</span> <span class="s">'Age'</span><span class="p">]]</span> <span class="o">=</span> <span class="n">np</span><span class="p">.</span><span class="nb">abs</span><span class="p">(</span>
                <span class="n">X</span><span class="p">[[</span><span class="s">'Employment length'</span><span class="p">,</span> <span class="s">'Age'</span><span class="p">]])</span>
            <span class="k">return</span> <span class="n">X</span>
        <span class="k">else</span><span class="p">:</span>
            <span class="k">print</span><span class="p">(</span><span class="s">"One or more features are not in the dataframe"</span><span class="p">)</span>
            <span class="k">return</span> <span class="n">X</span>


<span class="k">class</span> <span class="nc">RetireeHandler</span><span class="p">(</span><span class="n">BaseEstimator</span><span class="p">,</span> <span class="n">TransformerMixin</span><span class="p">):</span>
    <span class="k">def</span> <span class="nf">__init__</span><span class="p">(</span><span class="bp">self</span><span class="p">):</span>
        <span class="k">pass</span>

    <span class="k">def</span> <span class="nf">fit</span><span class="p">(</span><span class="bp">self</span><span class="p">,</span> <span class="n">df</span><span class="p">):</span>
        <span class="k">return</span> <span class="bp">self</span>

    <span class="k">def</span> <span class="nf">transform</span><span class="p">(</span><span class="bp">self</span><span class="p">,</span> <span class="n">df</span><span class="p">):</span>
        <span class="k">if</span> <span class="s">'Employment length'</span> <span class="ow">in</span> <span class="n">df</span><span class="p">.</span><span class="n">columns</span><span class="p">:</span>
            <span class="c1"># select rows with an employment length is 365243, which corresponds to retirees
</span>            <span class="n">df_ret_idx</span> <span class="o">=</span> <span class="n">df</span><span class="p">[</span><span class="s">'Employment length'</span><span class="p">][</span><span class="n">df</span><span class="p">[</span><span class="s">'Employment length'</span><span class="p">]</span> <span class="o">==</span> <span class="mi">365243</span><span class="p">].</span><span class="n">index</span>
            <span class="c1"># set those rows with value 365243 to 0
</span>            <span class="n">df</span><span class="p">.</span><span class="n">loc</span><span class="p">[</span><span class="n">df_ret_idx</span><span class="p">,</span> <span class="s">'Employment length'</span><span class="p">]</span> <span class="o">=</span> <span class="mi">0</span>
            <span class="k">return</span> <span class="n">df</span>
        <span class="k">else</span><span class="p">:</span>
            <span class="k">print</span><span class="p">(</span><span class="s">"Employment length is not in the dataframe"</span><span class="p">)</span>
            <span class="k">return</span> <span class="n">df</span>


<span class="k">class</span> <span class="nc">SkewnessHandler</span><span class="p">(</span><span class="n">BaseEstimator</span><span class="p">,</span> <span class="n">TransformerMixin</span><span class="p">):</span>
    <span class="k">def</span> <span class="nf">__init__</span><span class="p">(</span><span class="bp">self</span><span class="p">,</span> <span class="n">feat_with_skewness</span><span class="o">=</span><span class="p">[</span><span class="s">'Income'</span><span class="p">,</span> <span class="s">'Age'</span><span class="p">]):</span>
        <span class="bp">self</span><span class="p">.</span><span class="n">feat_with_skewness</span> <span class="o">=</span> <span class="n">feat_with_skewness</span>

    <span class="k">def</span> <span class="nf">fit</span><span class="p">(</span><span class="bp">self</span><span class="p">,</span> <span class="n">df</span><span class="p">):</span>
        <span class="k">return</span> <span class="bp">self</span>

    <span class="k">def</span> <span class="nf">transform</span><span class="p">(</span><span class="bp">self</span><span class="p">,</span> <span class="n">df</span><span class="p">):</span>
        <span class="k">if</span> <span class="p">(</span><span class="nb">set</span><span class="p">(</span><span class="bp">self</span><span class="p">.</span><span class="n">feat_with_skewness</span><span class="p">).</span><span class="n">issubset</span><span class="p">(</span><span class="n">df</span><span class="p">.</span><span class="n">columns</span><span class="p">)):</span>
            <span class="c1"># Handle skewness with cubic root transformation
</span>            <span class="n">df</span><span class="p">[</span><span class="bp">self</span><span class="p">.</span><span class="n">feat_with_skewness</span><span class="p">]</span> <span class="o">=</span> <span class="n">np</span><span class="p">.</span><span class="n">cbrt</span><span class="p">(</span><span class="n">df</span><span class="p">[</span><span class="bp">self</span><span class="p">.</span><span class="n">feat_with_skewness</span><span class="p">])</span>
            <span class="k">return</span> <span class="n">df</span>
        <span class="k">else</span><span class="p">:</span>
            <span class="k">print</span><span class="p">(</span><span class="s">"One or more features are not in the dataframe"</span><span class="p">)</span>
            <span class="k">return</span> <span class="n">df</span>


<span class="k">class</span> <span class="nc">BinningNumToYN</span><span class="p">(</span><span class="n">BaseEstimator</span><span class="p">,</span> <span class="n">TransformerMixin</span><span class="p">):</span>
    <span class="k">def</span> <span class="nf">__init__</span><span class="p">(</span><span class="bp">self</span><span class="p">,</span> <span class="n">feat_with_num_enc</span><span class="o">=</span><span class="p">[</span><span class="s">'Has a work phone'</span><span class="p">,</span> <span class="s">'Has a phone'</span><span class="p">,</span> <span class="s">'Has an email'</span><span class="p">]):</span>
        <span class="bp">self</span><span class="p">.</span><span class="n">feat_with_num_enc</span> <span class="o">=</span> <span class="n">feat_with_num_enc</span>

    <span class="k">def</span> <span class="nf">fit</span><span class="p">(</span><span class="bp">self</span><span class="p">,</span> <span class="n">df</span><span class="p">):</span>
        <span class="k">return</span> <span class="bp">self</span>

    <span class="k">def</span> <span class="nf">transform</span><span class="p">(</span><span class="bp">self</span><span class="p">,</span> <span class="n">df</span><span class="p">):</span>
        <span class="k">if</span> <span class="p">(</span><span class="nb">set</span><span class="p">(</span><span class="bp">self</span><span class="p">.</span><span class="n">feat_with_num_enc</span><span class="p">).</span><span class="n">issubset</span><span class="p">(</span><span class="n">df</span><span class="p">.</span><span class="n">columns</span><span class="p">)):</span>
            <span class="c1"># Change 0 to N and 1 to Y for all the features in feat_with_num_enc
</span>            <span class="k">for</span> <span class="n">ft</span> <span class="ow">in</span> <span class="bp">self</span><span class="p">.</span><span class="n">feat_with_num_enc</span><span class="p">:</span>
                <span class="n">df</span><span class="p">[</span><span class="n">ft</span><span class="p">]</span> <span class="o">=</span> <span class="n">df</span><span class="p">[</span><span class="n">ft</span><span class="p">].</span><span class="nb">map</span><span class="p">({</span><span class="mi">1</span><span class="p">:</span> <span class="s">'Y'</span><span class="p">,</span> <span class="mi">0</span><span class="p">:</span> <span class="s">'N'</span><span class="p">})</span>
            <span class="k">return</span> <span class="n">df</span>
        <span class="k">else</span><span class="p">:</span>
            <span class="k">print</span><span class="p">(</span><span class="s">"One or more features are not in the dataframe"</span><span class="p">)</span>
            <span class="k">return</span> <span class="n">df</span>


<span class="k">class</span> <span class="nc">OneHotWithFeatNames</span><span class="p">(</span><span class="n">BaseEstimator</span><span class="p">,</span> <span class="n">TransformerMixin</span><span class="p">):</span>
    <span class="k">def</span> <span class="nf">__init__</span><span class="p">(</span><span class="bp">self</span><span class="p">,</span> <span class="n">one_hot_enc_ft</span><span class="o">=</span><span class="p">[</span><span class="s">'Gender'</span><span class="p">,</span> <span class="s">'Marital status'</span><span class="p">,</span> <span class="s">'Dwelling'</span><span class="p">,</span> <span class="s">'Employment status'</span><span class="p">,</span> <span class="s">'Has a car'</span><span class="p">,</span> <span class="s">'Has a property'</span><span class="p">,</span> <span class="s">'Has a work phone'</span><span class="p">,</span> <span class="s">'Has a phone'</span><span class="p">,</span> <span class="s">'Has an email'</span><span class="p">]):</span>
        <span class="bp">self</span><span class="p">.</span><span class="n">one_hot_enc_ft</span> <span class="o">=</span> <span class="n">one_hot_enc_ft</span>

    <span class="k">def</span> <span class="nf">fit</span><span class="p">(</span><span class="bp">self</span><span class="p">,</span> <span class="n">df</span><span class="p">):</span>
        <span class="k">return</span> <span class="bp">self</span>

    <span class="k">def</span> <span class="nf">transform</span><span class="p">(</span><span class="bp">self</span><span class="p">,</span> <span class="n">df</span><span class="p">):</span>
        <span class="k">if</span> <span class="p">(</span><span class="nb">set</span><span class="p">(</span><span class="bp">self</span><span class="p">.</span><span class="n">one_hot_enc_ft</span><span class="p">).</span><span class="n">issubset</span><span class="p">(</span><span class="n">df</span><span class="p">.</span><span class="n">columns</span><span class="p">)):</span>
            <span class="c1"># function to one-hot encode the features
</span>            <span class="k">def</span> <span class="nf">one_hot_enc</span><span class="p">(</span><span class="n">df</span><span class="p">,</span> <span class="n">one_hot_enc_ft</span><span class="p">):</span>
                <span class="c1"># instantiate the OneHotEncoder object
</span>                <span class="n">one_hot_enc</span> <span class="o">=</span> <span class="n">OneHotEncoder</span><span class="p">()</span>
                <span class="c1"># fit the dataframe with the features we want to one-hot encode
</span>                <span class="n">one_hot_enc</span><span class="p">.</span><span class="n">fit</span><span class="p">(</span><span class="n">df</span><span class="p">[</span><span class="n">one_hot_enc_ft</span><span class="p">])</span>
                <span class="c1"># get output feature names for transformation.
</span>                <span class="n">feat_names_one_hot_enc</span> <span class="o">=</span> <span class="n">one_hot_enc</span><span class="p">.</span><span class="n">get_feature_names_out</span><span class="p">(</span>
                    <span class="n">one_hot_enc_ft</span><span class="p">)</span>
                <span class="c1"># change the one hot encoding array to a dataframe with the column names
</span>                <span class="n">df</span> <span class="o">=</span> <span class="n">pd</span><span class="p">.</span><span class="n">DataFrame</span><span class="p">(</span><span class="n">one_hot_enc</span><span class="p">.</span><span class="n">transform</span><span class="p">(</span><span class="n">df</span><span class="p">[</span><span class="bp">self</span><span class="p">.</span><span class="n">one_hot_enc_ft</span><span class="p">]).</span><span class="n">toarray</span><span class="p">(</span>
                <span class="p">),</span> <span class="n">columns</span><span class="o">=</span><span class="n">feat_names_one_hot_enc</span><span class="p">,</span> <span class="n">index</span><span class="o">=</span><span class="n">df</span><span class="p">.</span><span class="n">index</span><span class="p">)</span>
                <span class="k">return</span> <span class="n">df</span>
            <span class="c1"># function to concatenate the one hot encoded features with the rest of the features that were not encoded
</span>
            <span class="k">def</span> <span class="nf">concat_with_rest</span><span class="p">(</span><span class="n">df</span><span class="p">,</span> <span class="n">one_hot_enc_df</span><span class="p">,</span> <span class="n">one_hot_enc_ft</span><span class="p">):</span>
                <span class="c1"># get the rest of the features that are not encoded
</span>                <span class="n">rest_of_features</span> <span class="o">=</span> <span class="p">[</span>
                    <span class="n">ft</span> <span class="k">for</span> <span class="n">ft</span> <span class="ow">in</span> <span class="n">df</span><span class="p">.</span><span class="n">columns</span> <span class="k">if</span> <span class="n">ft</span> <span class="ow">not</span> <span class="ow">in</span> <span class="n">one_hot_enc_ft</span><span class="p">]</span>
                <span class="c1"># concatenate the rest of the features with the one hot encoded features
</span>                <span class="n">df_concat</span> <span class="o">=</span> <span class="n">pd</span><span class="p">.</span><span class="n">concat</span><span class="p">(</span>
                    <span class="p">[</span><span class="n">one_hot_enc_df</span><span class="p">,</span> <span class="n">df</span><span class="p">[</span><span class="n">rest_of_features</span><span class="p">]],</span> <span class="n">axis</span><span class="o">=</span><span class="mi">1</span><span class="p">)</span>
                <span class="k">return</span> <span class="n">df_concat</span>
            <span class="c1"># call the one_hot_enc function and stores the dataframe in the one_hot_enc_df variable
</span>            <span class="n">one_hot_enc_df</span> <span class="o">=</span> <span class="n">one_hot_enc</span><span class="p">(</span><span class="n">df</span><span class="p">,</span> <span class="bp">self</span><span class="p">.</span><span class="n">one_hot_enc_ft</span><span class="p">)</span>
            <span class="c1"># returns the concatenated dataframe and stores it in the full_df_one_hot_enc variable
</span>            <span class="n">full_df_one_hot_enc</span> <span class="o">=</span> <span class="n">concat_with_rest</span><span class="p">(</span>
                <span class="n">df</span><span class="p">,</span> <span class="n">one_hot_enc_df</span><span class="p">,</span> <span class="bp">self</span><span class="p">.</span><span class="n">one_hot_enc_ft</span><span class="p">)</span>
            <span class="k">return</span> <span class="n">full_df_one_hot_enc</span>
        <span class="k">else</span><span class="p">:</span>
            <span class="k">print</span><span class="p">(</span><span class="s">"One or more features are not in the dataframe"</span><span class="p">)</span>
            <span class="k">return</span> <span class="n">df</span>


<span class="k">class</span> <span class="nc">OrdinalFeatNames</span><span class="p">(</span><span class="n">BaseEstimator</span><span class="p">,</span> <span class="n">TransformerMixin</span><span class="p">):</span>
    <span class="k">def</span> <span class="nf">__init__</span><span class="p">(</span><span class="bp">self</span><span class="p">,</span> <span class="n">ordinal_enc_ft</span><span class="o">=</span><span class="p">[</span><span class="s">'Education level'</span><span class="p">]):</span>
        <span class="bp">self</span><span class="p">.</span><span class="n">ordinal_enc_ft</span> <span class="o">=</span> <span class="n">ordinal_enc_ft</span>

    <span class="k">def</span> <span class="nf">fit</span><span class="p">(</span><span class="bp">self</span><span class="p">,</span> <span class="n">df</span><span class="p">):</span>
        <span class="k">return</span> <span class="bp">self</span>

    <span class="k">def</span> <span class="nf">transform</span><span class="p">(</span><span class="bp">self</span><span class="p">,</span> <span class="n">df</span><span class="p">):</span>
        <span class="k">if</span> <span class="s">'Education level'</span> <span class="ow">in</span> <span class="n">df</span><span class="p">.</span><span class="n">columns</span><span class="p">:</span>
            <span class="c1"># instantiate the OrdinalEncoder object
</span>            <span class="n">ordinal_enc</span> <span class="o">=</span> <span class="n">OrdinalEncoder</span><span class="p">()</span>
            <span class="n">df</span><span class="p">[</span><span class="bp">self</span><span class="p">.</span><span class="n">ordinal_enc_ft</span><span class="p">]</span> <span class="o">=</span> <span class="n">ordinal_enc</span><span class="p">.</span><span class="n">fit_transform</span><span class="p">(</span>
                <span class="n">df</span><span class="p">[</span><span class="bp">self</span><span class="p">.</span><span class="n">ordinal_enc_ft</span><span class="p">])</span>
            <span class="k">return</span> <span class="n">df</span>
        <span class="k">else</span><span class="p">:</span>
            <span class="k">print</span><span class="p">(</span><span class="s">"Education level is not in the dataframe"</span><span class="p">)</span>
            <span class="k">return</span> <span class="n">df</span>


<span class="k">class</span> <span class="nc">MinMaxWithFeatNames</span><span class="p">(</span><span class="n">BaseEstimator</span><span class="p">,</span> <span class="n">TransformerMixin</span><span class="p">):</span>
    <span class="k">def</span> <span class="nf">__init__</span><span class="p">(</span><span class="bp">self</span><span class="p">,</span> <span class="n">min_max_scaler_ft</span><span class="o">=</span><span class="p">[</span><span class="s">'Age'</span><span class="p">,</span> <span class="s">'Income'</span><span class="p">,</span> <span class="s">'Employment length'</span><span class="p">]):</span>
        <span class="bp">self</span><span class="p">.</span><span class="n">min_max_scaler_ft</span> <span class="o">=</span> <span class="n">min_max_scaler_ft</span>

    <span class="k">def</span> <span class="nf">fit</span><span class="p">(</span><span class="bp">self</span><span class="p">,</span> <span class="n">df</span><span class="p">):</span>
        <span class="k">return</span> <span class="bp">self</span>

    <span class="k">def</span> <span class="nf">transform</span><span class="p">(</span><span class="bp">self</span><span class="p">,</span> <span class="n">df</span><span class="p">):</span>
        <span class="k">if</span> <span class="p">(</span><span class="nb">set</span><span class="p">(</span><span class="bp">self</span><span class="p">.</span><span class="n">min_max_scaler_ft</span><span class="p">).</span><span class="n">issubset</span><span class="p">(</span><span class="n">df</span><span class="p">.</span><span class="n">columns</span><span class="p">)):</span>
            <span class="c1"># instantiate the MinMaxScaler object
</span>            <span class="n">min_max_enc</span> <span class="o">=</span> <span class="n">MinMaxScaler</span><span class="p">()</span>
            <span class="c1"># fit and transform on a scale 0 to 1
</span>            <span class="n">df</span><span class="p">[</span><span class="bp">self</span><span class="p">.</span><span class="n">min_max_scaler_ft</span><span class="p">]</span> <span class="o">=</span> <span class="n">min_max_enc</span><span class="p">.</span><span class="n">fit_transform</span><span class="p">(</span>
                <span class="n">df</span><span class="p">[</span><span class="bp">self</span><span class="p">.</span><span class="n">min_max_scaler_ft</span><span class="p">])</span>
            <span class="k">return</span> <span class="n">df</span>
        <span class="k">else</span><span class="p">:</span>
            <span class="k">print</span><span class="p">(</span><span class="s">"One or more features are not in the dataframe"</span><span class="p">)</span>
            <span class="k">return</span> <span class="n">df</span>


<span class="k">class</span> <span class="nc">ChangeToNumTarget</span><span class="p">(</span><span class="n">BaseEstimator</span><span class="p">,</span> <span class="n">TransformerMixin</span><span class="p">):</span>
    <span class="k">def</span> <span class="nf">__init__</span><span class="p">(</span><span class="bp">self</span><span class="p">):</span>
        <span class="k">pass</span>

    <span class="k">def</span> <span class="nf">fit</span><span class="p">(</span><span class="bp">self</span><span class="p">,</span> <span class="n">df</span><span class="p">):</span>
        <span class="k">return</span> <span class="bp">self</span>

    <span class="k">def</span> <span class="nf">transform</span><span class="p">(</span><span class="bp">self</span><span class="p">,</span> <span class="n">df</span><span class="p">):</span>
        <span class="c1"># check if the target is part of the dataframe
</span>        <span class="k">if</span> <span class="s">'Is high risk'</span> <span class="ow">in</span> <span class="n">df</span><span class="p">.</span><span class="n">columns</span><span class="p">:</span>
            <span class="c1"># change to a numeric data type using Pandas
</span>            <span class="n">df</span><span class="p">[</span><span class="s">'Is high risk'</span><span class="p">]</span> <span class="o">=</span> <span class="n">pd</span><span class="p">.</span><span class="n">to_numeric</span><span class="p">(</span><span class="n">df</span><span class="p">[</span><span class="s">'Is high risk'</span><span class="p">])</span>
            <span class="k">return</span> <span class="n">df</span>
        <span class="k">else</span><span class="p">:</span>
            <span class="k">print</span><span class="p">(</span><span class="s">"Is high risk is not in the dataframe"</span><span class="p">)</span>
            <span class="k">return</span> <span class="n">df</span>


<span class="k">class</span> <span class="nc">Oversample</span><span class="p">(</span><span class="n">BaseEstimator</span><span class="p">,</span> <span class="n">TransformerMixin</span><span class="p">):</span>
    <span class="k">def</span> <span class="nf">__init__</span><span class="p">(</span><span class="bp">self</span><span class="p">):</span>
        <span class="k">pass</span>

    <span class="k">def</span> <span class="nf">fit</span><span class="p">(</span><span class="bp">self</span><span class="p">,</span> <span class="n">df</span><span class="p">):</span>
        <span class="k">return</span> <span class="bp">self</span>

    <span class="k">def</span> <span class="nf">transform</span><span class="p">(</span><span class="bp">self</span><span class="p">,</span> <span class="n">df</span><span class="p">):</span>
        <span class="k">if</span> <span class="s">'Is high risk'</span> <span class="ow">in</span> <span class="n">df</span><span class="p">.</span><span class="n">columns</span><span class="p">:</span>
            <span class="c1"># smote function instantiation to oversample the minority class to fix the imbalance data
</span>            <span class="n">oversample</span> <span class="o">=</span> <span class="n">SMOTE</span><span class="p">(</span><span class="n">sampling_strategy</span><span class="o">=</span><span class="s">'minority'</span><span class="p">)</span>
            <span class="c1"># fit and resample the classes and assign them to X_bal, y_bal variable
</span>            <span class="n">X_bal</span><span class="p">,</span> <span class="n">y_bal</span> <span class="o">=</span> <span class="n">oversample</span><span class="p">.</span><span class="n">fit_resample</span><span class="p">(</span>
                <span class="n">df</span><span class="p">.</span><span class="n">loc</span><span class="p">[:,</span> <span class="n">df</span><span class="p">.</span><span class="n">columns</span> <span class="o">!=</span> <span class="s">'Is high risk'</span><span class="p">],</span> <span class="n">df</span><span class="p">[</span><span class="s">'Is high risk'</span><span class="p">])</span>
            <span class="c1"># concatenate the balanced classes column-wise
</span>            <span class="n">df_bal</span> <span class="o">=</span> <span class="n">pd</span><span class="p">.</span><span class="n">concat</span><span class="p">(</span>
                <span class="p">[</span><span class="n">pd</span><span class="p">.</span><span class="n">DataFrame</span><span class="p">(</span><span class="n">X_bal</span><span class="p">),</span> <span class="n">pd</span><span class="p">.</span><span class="n">DataFrame</span><span class="p">(</span><span class="n">y_bal</span><span class="p">)],</span> <span class="n">axis</span><span class="o">=</span><span class="mi">1</span><span class="p">)</span>
            <span class="k">return</span> <span class="n">df_bal</span>
        <span class="k">else</span><span class="p">:</span>
            <span class="k">print</span><span class="p">(</span><span class="s">"Is high risk is not in the dataframe"</span><span class="p">)</span>
            <span class="k">return</span> <span class="n">df</span>


<span class="k">def</span> <span class="nf">full_pipeline</span><span class="p">(</span><span class="n">df</span><span class="p">):</span>
    <span class="c1"># Create the pipeline that will call all the classes from OutlierRemoval() to Oversample() in one go
</span>    <span class="n">pipeline</span> <span class="o">=</span> <span class="n">Pipeline</span><span class="p">([</span>
        <span class="p">(</span><span class="s">'outlier_remover'</span><span class="p">,</span> <span class="n">OutlierRemover</span><span class="p">()),</span>
        <span class="p">(</span><span class="s">'feature_dropper'</span><span class="p">,</span> <span class="n">DropFeatures</span><span class="p">()),</span>
        <span class="p">(</span><span class="s">'time_conversion_handler'</span><span class="p">,</span> <span class="n">TimeConversionHandler</span><span class="p">()),</span>
        <span class="p">(</span><span class="s">'retiree_handler'</span><span class="p">,</span> <span class="n">RetireeHandler</span><span class="p">()),</span>
        <span class="p">(</span><span class="s">'skewness_handler'</span><span class="p">,</span> <span class="n">SkewnessHandler</span><span class="p">()),</span>
        <span class="p">(</span><span class="s">'binning_num_to_yn'</span><span class="p">,</span> <span class="n">BinningNumToYN</span><span class="p">()),</span>
        <span class="p">(</span><span class="s">'one_hot_with_feat_names'</span><span class="p">,</span> <span class="n">OneHotWithFeatNames</span><span class="p">()),</span>
        <span class="p">(</span><span class="s">'ordinal_feat_names'</span><span class="p">,</span> <span class="n">OrdinalFeatNames</span><span class="p">()),</span>
        <span class="p">(</span><span class="s">'min_max_with_feat_names'</span><span class="p">,</span> <span class="n">MinMaxWithFeatNames</span><span class="p">()),</span>
        <span class="p">(</span><span class="s">'change_to_num_target'</span><span class="p">,</span> <span class="n">ChangeToNumTarget</span><span class="p">()),</span>
        <span class="p">(</span><span class="s">'oversample'</span><span class="p">,</span> <span class="n">Oversample</span><span class="p">())</span>
    <span class="p">])</span>
    <span class="n">df_pipe_prep</span> <span class="o">=</span> <span class="n">pipeline</span><span class="p">.</span><span class="n">fit_transform</span><span class="p">(</span><span class="n">df</span><span class="p">)</span>
    <span class="k">return</span> <span class="n">df_pipe_prep</span>

</code></pre></div></div>

<p>Now let’s work on the Streamlit interface/dashboard.</p>

<p>We start by creating a title and a brief description of our interface and what it does. The streamlit function <code class="language-plaintext highlighter-rouge">st.write</code> will accept within the parentheses markdown markup language. So that first line that starts with <code class="language-plaintext highlighter-rouge">#</code> is equivalent to HTML heading H1.</p>

<div class="language-python highlighter-rouge"><div class="highlight"><pre class="highlight"><code><span class="n">st</span><span class="p">.</span><span class="n">write</span><span class="p">(</span><span class="s">"""
# Credit card approval prediction
This app predicts if an applicant will be approved for a credit card or not. Just fill in the following information and click on the Predict button.
"""</span><span class="p">)</span>

</code></pre></div></div>

<p>The first input from the applicant is gender, and use the streamlit radio button function to choose between two options. We store the output in the <code class="language-plaintext highlighter-rouge">input_gender</code> variable.</p>

<div class="language-python highlighter-rouge"><div class="highlight"><pre class="highlight"><code><span class="c1">#Gender input
</span><span class="n">st</span><span class="p">.</span><span class="n">write</span><span class="p">(</span><span class="s">"""
## Gender
"""</span><span class="p">)</span>
<span class="n">input_gender</span> <span class="o">=</span> <span class="n">st</span><span class="p">.</span><span class="n">radio</span><span class="p">(</span><span class="s">'Select you gender'</span><span class="p">,[</span><span class="s">'Male'</span><span class="p">,</span><span class="s">'Female'</span><span class="p">],</span> <span class="n">index</span><span class="o">=</span><span class="mi">0</span><span class="p">)</span>
</code></pre></div></div>

<p>For age, we will use a slider instead, with a maximum value of 70 and a minimum value of 18, with one step at a time. We are then changing the age to days by multiplying it with 365.25, as we did in the sessions above.</p>

<div class="language-python highlighter-rouge"><div class="highlight"><pre class="highlight"><code><span class="c1"># Age input slider
</span><span class="n">st</span><span class="p">.</span><span class="n">write</span><span class="p">(</span><span class="s">"""
## Age
"""</span><span class="p">)</span>
<span class="n">input_age</span> <span class="o">=</span> <span class="n">np</span><span class="p">.</span><span class="n">negative</span><span class="p">(</span><span class="n">st</span><span class="p">.</span><span class="n">slider</span><span class="p">(</span>
    <span class="s">'Select your age'</span><span class="p">,</span> <span class="n">value</span><span class="o">=</span><span class="mi">42</span><span class="p">,</span> <span class="n">min_value</span><span class="o">=</span><span class="mi">18</span><span class="p">,</span> <span class="n">max_value</span><span class="o">=</span><span class="mi">70</span><span class="p">,</span> <span class="n">step</span><span class="o">=</span><span class="mi">1</span><span class="p">)</span> <span class="o">*</span> <span class="mf">365.25</span><span class="p">)</span>

</code></pre></div></div>

<p>We use a drop-down for marital status. Each marital status string value is mapped to an index to create a dictionary to return that string value.</p>

<div class="language-python highlighter-rouge"><div class="highlight"><pre class="highlight"><code><span class="c1"># Marital status input dropdown
</span><span class="n">st</span><span class="p">.</span><span class="n">write</span><span class="p">(</span><span class="s">"""
## Marital status
"""</span><span class="p">)</span>
<span class="c1"># get the index from value_cnt_norm_cal function
</span><span class="n">marital_status_values</span> <span class="o">=</span> <span class="nb">list</span><span class="p">(</span>
    <span class="n">value_cnt_norm_cal</span><span class="p">(</span><span class="n">full_data</span><span class="p">,</span> <span class="s">'Marital status'</span><span class="p">).</span><span class="n">index</span><span class="p">)</span>
<span class="n">marital_status_key</span> <span class="o">=</span> <span class="p">[</span><span class="s">'Married'</span><span class="p">,</span> <span class="s">'Single/not married'</span><span class="p">,</span> <span class="s">'Civil marriage'</span><span class="p">,</span> <span class="s">'Separated'</span><span class="p">,</span> <span class="s">'Widowed'</span><span class="p">]</span>
<span class="c1"># mapping of the values and keys
</span><span class="n">marital_status_dict</span> <span class="o">=</span> <span class="nb">dict</span><span class="p">(</span><span class="nb">zip</span><span class="p">(</span><span class="n">marital_status_key</span><span class="p">,</span> <span class="n">marital_status_values</span><span class="p">))</span>
<span class="c1"># streamlit dropdown menu function, value stored in input_marital_status_key
</span><span class="n">input_marital_status_key</span> <span class="o">=</span> <span class="n">st</span><span class="p">.</span><span class="n">selectbox</span><span class="p">(</span>
    <span class="s">'Select your marital status'</span><span class="p">,</span> <span class="n">marital_status_key</span><span class="p">)</span>

<span class="c1"># get the corresponding value
</span><span class="n">input_marital_status_val</span> <span class="o">=</span> <span class="n">marital_status_dict</span><span class="p">.</span><span class="n">get</span><span class="p">(</span><span class="n">input_marital_status_key</span><span class="p">)</span>

</code></pre></div></div>

<p>We again get the family count using streamlit dropdown menu.</p>

<p>Note: since we have removed outliers from our training model, we will only have the family count up to 6, which encompass most scenario.</p>

<div class="language-python highlighter-rouge"><div class="highlight"><pre class="highlight"><code><span class="c1"># Family member count
</span><span class="n">st</span><span class="p">.</span><span class="n">write</span><span class="p">(</span><span class="s">"""
## Family member count
"""</span><span class="p">)</span>
<span class="n">fam_member_count</span> <span class="o">=</span> <span class="nb">float</span><span class="p">(</span><span class="n">st</span><span class="p">.</span><span class="n">selectbox</span><span class="p">(</span><span class="s">'Select your family member count'</span><span class="p">,</span> <span class="p">[</span><span class="mi">1</span><span class="p">,</span><span class="mi">2</span><span class="p">,</span><span class="mi">3</span><span class="p">,</span><span class="mi">4</span><span class="p">,</span><span class="mi">5</span><span class="p">,</span><span class="mi">6</span><span class="p">]))</span>
</code></pre></div></div>

<p>We use a dropdown menu for dwelling type just like we did for Marital status.</p>

<div class="language-python highlighter-rouge"><div class="highlight"><pre class="highlight"><code><span class="c1"># Dwelling type dropdown
</span><span class="n">st</span><span class="p">.</span><span class="n">write</span><span class="p">(</span><span class="s">"""
## Dwelling type
"""</span><span class="p">)</span>
<span class="n">dwelling_type_values</span> <span class="o">=</span> <span class="nb">list</span><span class="p">(</span><span class="n">value_cnt_norm_cal</span><span class="p">(</span><span class="n">full_data</span><span class="p">,</span> <span class="s">'Dwelling'</span><span class="p">).</span><span class="n">index</span><span class="p">)</span>
<span class="n">dwelling_type_key</span> <span class="o">=</span> <span class="p">[</span><span class="s">'House / apartment'</span><span class="p">,</span> <span class="s">'Live with parents'</span><span class="p">,</span> <span class="s">'Municipal apartment '</span><span class="p">,</span> <span class="s">'Rented apartment'</span><span class="p">,</span> <span class="s">'Office apartment'</span><span class="p">,</span> <span class="s">'Co-op apartment'</span><span class="p">]</span>
<span class="n">dwelling_type_dict</span> <span class="o">=</span> <span class="nb">dict</span><span class="p">(</span><span class="nb">zip</span><span class="p">(</span><span class="n">dwelling_type_key</span><span class="p">,</span> <span class="n">dwelling_type_values</span><span class="p">))</span>
<span class="n">input_dwelling_type_key</span> <span class="o">=</span> <span class="n">st</span><span class="p">.</span><span class="n">selectbox</span><span class="p">(</span>
    <span class="s">'Select the type of dwelling you reside in'</span><span class="p">,</span> <span class="n">dwelling_type_key</span><span class="p">)</span>
<span class="n">input_dwelling_type_val</span> <span class="o">=</span> <span class="n">dwelling_type_dict</span><span class="p">.</span><span class="n">get</span><span class="p">(</span><span class="n">input_dwelling_type_key</span><span class="p">)</span>

</code></pre></div></div>

<p>For income, we will input income value in a text field.</p>

<div class="language-python highlighter-rouge"><div class="highlight"><pre class="highlight"><code><span class="c1"># Income
</span><span class="n">st</span><span class="p">.</span><span class="n">write</span><span class="p">(</span><span class="s">"""
## Income
"""</span><span class="p">)</span>
<span class="n">input_income</span> <span class="o">=</span> <span class="n">np</span><span class="p">.</span><span class="nb">int</span><span class="p">(</span><span class="n">st</span><span class="p">.</span><span class="n">text_input</span><span class="p">(</span><span class="s">'Enter your income (in USD)'</span><span class="p">,</span><span class="mi">0</span><span class="p">))</span>
</code></pre></div></div>

<p>We will proceed the same way for employment status as marital status.</p>

<div class="language-python highlighter-rouge"><div class="highlight"><pre class="highlight"><code><span class="c1"># Employment status dropdown
</span><span class="n">st</span><span class="p">.</span><span class="n">write</span><span class="p">(</span><span class="s">"""
## Employment status
"""</span><span class="p">)</span>
<span class="n">employment_status_values</span> <span class="o">=</span> <span class="nb">list</span><span class="p">(</span>
    <span class="n">value_cnt_norm_cal</span><span class="p">(</span><span class="n">full_data</span><span class="p">,</span> <span class="s">'Employment status'</span><span class="p">).</span><span class="n">index</span><span class="p">)</span>
<span class="n">employment_status_key</span> <span class="o">=</span> <span class="p">[</span>
    <span class="s">'Working'</span><span class="p">,</span> <span class="s">'Commercial associate'</span><span class="p">,</span> <span class="s">'Pensioner'</span><span class="p">,</span> <span class="s">'State servant'</span><span class="p">,</span> <span class="s">'Student'</span><span class="p">]</span>
<span class="n">employment_status_dict</span> <span class="o">=</span> <span class="nb">dict</span><span class="p">(</span>
    <span class="nb">zip</span><span class="p">(</span><span class="n">employment_status_key</span><span class="p">,</span> <span class="n">employment_status_values</span><span class="p">))</span>
<span class="n">input_employment_status_key</span> <span class="o">=</span> <span class="n">st</span><span class="p">.</span><span class="n">selectbox</span><span class="p">(</span>
    <span class="s">'Select your employment status'</span><span class="p">,</span> <span class="n">employment_status_key</span><span class="p">)</span>
<span class="n">input_employment_status_val</span> <span class="o">=</span> <span class="n">employment_status_dict</span><span class="p">.</span><span class="n">get</span><span class="p">(</span>
    <span class="n">input_employment_status_key</span><span class="p">)</span>

</code></pre></div></div>

<p>We use a slider for the employment length.</p>

<div class="language-python highlighter-rouge"><div class="highlight"><pre class="highlight"><code><span class="c1"># Employment length input slider
</span><span class="n">st</span><span class="p">.</span><span class="n">write</span><span class="p">(</span><span class="s">"""
## Employment length
"""</span><span class="p">)</span>
<span class="n">input_employment_length</span> <span class="o">=</span> <span class="n">np</span><span class="p">.</span><span class="n">negative</span><span class="p">(</span><span class="n">st</span><span class="p">.</span><span class="n">slider</span><span class="p">(</span>
    <span class="s">'Select your employment length'</span><span class="p">,</span> <span class="n">value</span><span class="o">=</span><span class="mi">6</span><span class="p">,</span> <span class="n">min_value</span><span class="o">=</span><span class="mi">0</span><span class="p">,</span> <span class="n">max_value</span><span class="o">=</span><span class="mi">30</span><span class="p">,</span> <span class="n">step</span><span class="o">=</span><span class="mi">1</span><span class="p">)</span> <span class="o">*</span> <span class="mf">365.25</span><span class="p">)</span>

</code></pre></div></div>

<p>Again, we use a dropdown for the education level.</p>

<div class="language-python highlighter-rouge"><div class="highlight"><pre class="highlight"><code><span class="c1"># Education level dropdown
</span><span class="n">st</span><span class="p">.</span><span class="n">write</span><span class="p">(</span><span class="s">"""
## Education level
"""</span><span class="p">)</span>
<span class="n">edu_level_values</span> <span class="o">=</span> <span class="nb">list</span><span class="p">(</span><span class="n">value_cnt_norm_cal</span><span class="p">(</span><span class="n">full_data</span><span class="p">,</span> <span class="s">'Education level'</span><span class="p">).</span><span class="n">index</span><span class="p">)</span>
<span class="n">edu_level_key</span> <span class="o">=</span> <span class="p">[</span><span class="s">'Secondary school'</span><span class="p">,</span> <span class="s">'Higher education'</span><span class="p">,</span> <span class="s">'Incomplete higher'</span><span class="p">,</span> <span class="s">'Lower secondary'</span><span class="p">,</span> <span class="s">'Academic degree'</span><span class="p">]</span>
<span class="n">edu_level_dict</span> <span class="o">=</span> <span class="nb">dict</span><span class="p">(</span><span class="nb">zip</span><span class="p">(</span><span class="n">edu_level_key</span><span class="p">,</span> <span class="n">edu_level_values</span><span class="p">))</span>
<span class="n">input_edu_level_key</span> <span class="o">=</span> <span class="n">st</span><span class="p">.</span><span class="n">selectbox</span><span class="p">(</span>
    <span class="s">'Select your education status'</span><span class="p">,</span> <span class="n">edu_level_key</span><span class="p">)</span>
<span class="n">input_edu_level_val</span> <span class="o">=</span> <span class="n">edu_level_dict</span><span class="p">.</span><span class="n">get</span><span class="p">(</span><span class="n">input_edu_level_key</span><span class="p">)</span>

</code></pre></div></div>

<p>We use the <code class="language-plaintext highlighter-rouge">st.radio</code> streamlit function (radio button select only one input between two choices) for car ownership feature, property ownership, work phone input, phone input, and email input.</p>

<div class="language-python highlighter-rouge"><div class="highlight"><pre class="highlight"><code><span class="c1"># Car ownship input
</span><span class="n">st</span><span class="p">.</span><span class="n">write</span><span class="p">(</span><span class="s">"""
## Car ownship
"""</span><span class="p">)</span>
<span class="n">input_car_ownship</span> <span class="o">=</span> <span class="n">st</span><span class="p">.</span><span class="n">radio</span><span class="p">(</span><span class="s">'Do you own a car?'</span><span class="p">,</span> <span class="p">[</span><span class="s">'Yes'</span><span class="p">,</span> <span class="s">'No'</span><span class="p">],</span> <span class="n">index</span><span class="o">=</span><span class="mi">0</span><span class="p">)</span>

<span class="c1"># Property ownship input
</span><span class="n">st</span><span class="p">.</span><span class="n">write</span><span class="p">(</span><span class="s">"""
## Property ownship
"""</span><span class="p">)</span>
<span class="n">input_prop_ownship</span> <span class="o">=</span> <span class="n">st</span><span class="p">.</span><span class="n">radio</span><span class="p">(</span><span class="s">'Do you own a property?'</span><span class="p">,</span> <span class="p">[</span><span class="s">'Yes'</span><span class="p">,</span> <span class="s">'No'</span><span class="p">],</span> <span class="n">index</span><span class="o">=</span><span class="mi">0</span><span class="p">)</span>


<span class="c1"># Work phone input
</span><span class="n">st</span><span class="p">.</span><span class="n">write</span><span class="p">(</span><span class="s">"""
## Work phone
"""</span><span class="p">)</span>
<span class="n">input_work_phone</span> <span class="o">=</span> <span class="n">st</span><span class="p">.</span><span class="n">radio</span><span class="p">(</span>
    <span class="s">'Do you have a work phone?'</span><span class="p">,</span> <span class="p">[</span><span class="s">'Yes'</span><span class="p">,</span> <span class="s">'No'</span><span class="p">],</span> <span class="n">index</span><span class="o">=</span><span class="mi">0</span><span class="p">)</span>
<span class="n">work_phone_dict</span> <span class="o">=</span> <span class="p">{</span><span class="s">'Yes'</span><span class="p">:</span> <span class="mi">1</span><span class="p">,</span> <span class="s">'No'</span><span class="p">:</span> <span class="mi">0</span><span class="p">}</span>
<span class="n">work_phone_val</span> <span class="o">=</span> <span class="n">work_phone_dict</span><span class="p">.</span><span class="n">get</span><span class="p">(</span><span class="n">input_work_phone</span><span class="p">)</span>

<span class="c1"># Phone input
</span><span class="n">st</span><span class="p">.</span><span class="n">write</span><span class="p">(</span><span class="s">"""
## Phone
"""</span><span class="p">)</span>
<span class="n">input_phone</span> <span class="o">=</span> <span class="n">st</span><span class="p">.</span><span class="n">radio</span><span class="p">(</span><span class="s">'Do you have a phone?'</span><span class="p">,</span> <span class="p">[</span><span class="s">'Yes'</span><span class="p">,</span> <span class="s">'No'</span><span class="p">],</span> <span class="n">index</span><span class="o">=</span><span class="mi">0</span><span class="p">)</span>
<span class="n">work_dict</span> <span class="o">=</span> <span class="p">{</span><span class="s">'Yes'</span><span class="p">:</span> <span class="mi">1</span><span class="p">,</span> <span class="s">'No'</span><span class="p">:</span> <span class="mi">0</span><span class="p">}</span>
<span class="n">phone_val</span> <span class="o">=</span> <span class="n">work_dict</span><span class="p">.</span><span class="n">get</span><span class="p">(</span><span class="n">input_phone</span><span class="p">)</span>

<span class="c1"># Email input
</span><span class="n">st</span><span class="p">.</span><span class="n">write</span><span class="p">(</span><span class="s">"""
## Email
"""</span><span class="p">)</span>
<span class="n">input_email</span> <span class="o">=</span> <span class="n">st</span><span class="p">.</span><span class="n">radio</span><span class="p">(</span><span class="s">'Do you have an email?'</span><span class="p">,</span> <span class="p">[</span><span class="s">'Yes'</span><span class="p">,</span> <span class="s">'No'</span><span class="p">],</span> <span class="n">index</span><span class="o">=</span><span class="mi">0</span><span class="p">)</span>
<span class="n">email_dict</span> <span class="o">=</span> <span class="p">{</span><span class="s">'Yes'</span><span class="p">:</span> <span class="mi">1</span><span class="p">,</span> <span class="s">'No'</span><span class="p">:</span> <span class="mi">0</span><span class="p">}</span>
<span class="n">email_val</span> <span class="o">=</span> <span class="n">email_dict</span><span class="p">.</span><span class="n">get</span><span class="p">(</span><span class="n">input_email</span><span class="p">)</span>

</code></pre></div></div>

<p>The final element on the interface is the predict button.</p>

<div class="language-python highlighter-rouge"><div class="highlight"><pre class="highlight"><code><span class="c1"># Predict button
</span><span class="n">predict_bt</span> <span class="o">=</span> <span class="n">st</span><span class="p">.</span><span class="n">button</span><span class="p">(</span><span class="s">'Predict'</span><span class="p">)</span>
</code></pre></div></div>

<p>So now that we have the interface ready and all the input variables, we can store those input variables in a list which will be the profile we are predicting.</p>

<div class="language-python highlighter-rouge"><div class="highlight"><pre class="highlight"><code><span class="c1"># list of all the input variables
</span><span class="n">profile_to_predict</span> <span class="o">=</span> <span class="p">[</span><span class="mi">0</span><span class="p">,</span>  <span class="c1"># ID (which will be dropped in the pipeline)
</span>                    <span class="n">input_gender</span><span class="p">[:</span><span class="mi">1</span><span class="p">],</span>  <span class="c1"># get the first element in gender
</span>                    <span class="n">input_car_ownship</span><span class="p">[:</span><span class="mi">1</span><span class="p">],</span>  <span class="c1"># get the first element in car ownership
</span>                    <span class="n">input_prop_ownship</span><span class="p">[:</span><span class="mi">1</span><span class="p">],</span>  <span class="c1"># get the first element in property ownership
</span>                    <span class="mi">0</span><span class="p">,</span> <span class="c1"># Children count (which will be dropped in the pipeline)
</span>                    <span class="n">input_income</span><span class="p">,</span>  <span class="c1"># Income
</span>                    <span class="n">input_employment_status_val</span><span class="p">,</span>  <span class="c1"># Employment status
</span>                    <span class="n">input_edu_level_val</span><span class="p">,</span>  <span class="c1"># Education level
</span>                    <span class="n">input_marital_status_val</span><span class="p">,</span>  <span class="c1"># Marital status
</span>                    <span class="n">input_dwelling_type_val</span><span class="p">,</span>  <span class="c1"># Dwelling type
</span>                    <span class="n">input_age</span><span class="p">,</span>  <span class="c1"># Age
</span>                    <span class="n">input_employment_length</span><span class="p">,</span>    <span class="c1"># Employment length
</span>                    <span class="mi">1</span><span class="p">,</span> <span class="c1"># Has a mobile phone (which will be dropped in the pipeline)
</span>                    <span class="n">work_phone_val</span><span class="p">,</span>  <span class="c1"># Work phone
</span>                    <span class="n">phone_val</span><span class="p">,</span>  <span class="c1"># Phone
</span>                    <span class="n">email_val</span><span class="p">,</span>  <span class="c1"># Email
</span>                    <span class="s">'to_be_droped'</span><span class="p">,</span> <span class="c1"># Job title (which will be dropped in the pipeline)
</span>                    <span class="n">fam_member_count</span><span class="p">,</span>  <span class="c1"># Family member count
</span>                    <span class="mf">0.00</span><span class="p">,</span> <span class="c1"># Account age (which will be dropped in the pipeline)
</span>                    <span class="mi">0</span>  <span class="c1"># target set to 0 as a placeholder
</span>                    <span class="p">]</span>

</code></pre></div></div>

<p>We will change the list into a one row dataframe.</p>

<div class="language-python highlighter-rouge"><div class="highlight"><pre class="highlight"><code><span class="n">profile_to_predict_df</span> <span class="o">=</span> <span class="n">pd</span><span class="p">.</span><span class="n">DataFrame</span><span class="p">([</span><span class="n">profile_to_predict</span><span class="p">],</span><span class="n">columns</span><span class="o">=</span><span class="n">train_copy</span><span class="p">.</span><span class="n">columns</span><span class="p">)</span>
</code></pre></div></div>

<p>We will add the profile to predict as the last row in the train data.</p>

<div class="language-python highlighter-rouge"><div class="highlight"><pre class="highlight"><code><span class="n">train_copy_with_profile_to_pred</span> <span class="o">=</span> <span class="n">pd</span><span class="p">.</span><span class="n">concat</span><span class="p">([</span><span class="n">train_copy</span><span class="p">,</span><span class="n">profile_to_predict_df</span><span class="p">],</span><span class="n">ignore_index</span><span class="o">=</span><span class="bp">True</span><span class="p">)</span>
</code></pre></div></div>

<p>We will prepare the whole dataset (profile to predict with the training dataset) with the <code class="language-plaintext highlighter-rouge">full_pipeline</code> function we have defined above.</p>

<div class="language-python highlighter-rouge"><div class="highlight"><pre class="highlight"><code><span class="c1"># whole dataset prepared
</span><span class="n">train_copy_with_profile_to_pred_prep</span> <span class="o">=</span> <span class="n">full_pipeline</span><span class="p">(</span><span class="n">train_copy_with_profile_to_pred</span><span class="p">)</span>
</code></pre></div></div>

<p>To get our applicant profile observation, we first get the row with the ID = 0 and then drop the ID with the target (which was added as a placeholder) column.</p>

<div class="language-python highlighter-rouge"><div class="highlight"><pre class="highlight"><code><span class="n">profile_to_pred_prep</span> <span class="o">=</span> <span class="n">train_copy_with_profile_to_pred_prep</span><span class="p">[</span><span class="n">train_copy_with_profile_to_pred_prep</span><span class="p">[</span><span class="s">'ID'</span><span class="p">]</span> <span class="o">==</span> <span class="mi">0</span><span class="p">].</span><span class="n">drop</span><span class="p">(</span><span class="n">columns</span><span class="o">=</span><span class="p">[</span><span class="s">'ID'</span><span class="p">,</span><span class="s">'Is high risk'</span><span class="p">])</span>
</code></pre></div></div>

<p>Now we will add an optional but cool animation of an impatient hand that will be displayed when the model makes the prediction; here is what it looks like.</p>

<p><img src="/blog/assets/post_cont_image/hand_ani.png" alt="hand animation" /></p>

<p>Check out the animation in action <a href="https://lottiefiles.com/89308-loading-hand-green">here</a></p>

<p>And here is its function</p>

<div class="language-python highlighter-rouge"><div class="highlight"><pre class="highlight"><code><span class="c1">#Animation function
</span><span class="o">@</span><span class="n">st</span><span class="p">.</span><span class="n">experimental_memo</span>
<span class="k">def</span> <span class="nf">load_lottieurl</span><span class="p">(</span><span class="n">url</span><span class="p">:</span> <span class="nb">str</span><span class="p">):</span>
    <span class="n">r</span> <span class="o">=</span> <span class="n">requests</span><span class="p">.</span><span class="n">get</span><span class="p">(</span><span class="n">url</span><span class="p">)</span>
    <span class="k">if</span> <span class="n">r</span><span class="p">.</span><span class="n">status_code</span> <span class="o">!=</span> <span class="mi">200</span><span class="p">:</span>
        <span class="k">return</span> <span class="bp">None</span>
    <span class="k">return</span> <span class="n">r</span><span class="p">.</span><span class="n">json</span><span class="p">()</span>


<span class="n">lottie_loading_an</span> <span class="o">=</span> <span class="n">load_lottieurl</span><span class="p">(</span>
    <span class="s">'https://assets3.lottiefiles.com/packages/lf20_szlepvdh.json'</span><span class="p">)</span>

</code></pre></div></div>

<p>Last but not least, we will finally create a function to make predictions. We first get the client from AWS S3 using the <code class="language-plaintext highlighter-rouge">boto3.client</code> function and store it in the <code class="language-plaintext highlighter-rouge">client</code> variable.</p>

<p>Now you might ask, how are we passing the keys to this function, yet there is nowhere we pasted our access and secret access key. It will be done when we deploy to streamlit share in the sections below.</p>

<p>we declare our bucket and model name stored on AWS, then load the model from AWS into a temporally file using the <code class="language-plaintext highlighter-rouge">tempfile</code> library, download, load and return a prediction as <code class="language-plaintext highlighter-rouge">0</code> (is not high risk) or <code class="language-plaintext highlighter-rouge">1</code> (is high risk).</p>

<div class="language-python highlighter-rouge"><div class="highlight"><pre class="highlight"><code><span class="k">def</span> <span class="nf">make_prediction</span><span class="p">():</span>
    <span class="c1"># connect to s3 bucket with the access and secret access key
</span>    <span class="n">client</span> <span class="o">=</span> <span class="n">boto3</span><span class="p">.</span><span class="n">client</span><span class="p">(</span>
        <span class="s">'s3'</span><span class="p">,</span> <span class="n">aws_access_key_id</span><span class="o">=</span><span class="n">st</span><span class="p">.</span><span class="n">secrets</span><span class="p">[</span><span class="s">"access_key"</span><span class="p">],</span> <span class="n">aws_secret_access_key</span><span class="o">=</span><span class="n">st</span><span class="p">.</span><span class="n">secrets</span><span class="p">[</span><span class="s">"secret_access_key"</span><span class="p">])</span>

    <span class="n">bucket_name</span> <span class="o">=</span> <span class="s">"creditapplipred"</span>
    <span class="n">key</span> <span class="o">=</span> <span class="s">"gradient_boosting_model.sav"</span>

    <span class="c1"># load the model from s3 in a temporary file
</span>    <span class="k">with</span> <span class="n">tempfile</span><span class="p">.</span><span class="n">TemporaryFile</span><span class="p">()</span> <span class="k">as</span> <span class="n">fp</span><span class="p">:</span>
        <span class="c1"># download our model from AWS
</span>        <span class="n">client</span><span class="p">.</span><span class="n">download_fileobj</span><span class="p">(</span><span class="n">Fileobj</span><span class="o">=</span><span class="n">fp</span><span class="p">,</span> <span class="n">Bucket</span><span class="o">=</span><span class="n">bucket_name</span><span class="p">,</span> <span class="n">Key</span><span class="o">=</span><span class="n">key</span><span class="p">)</span>
        <span class="c1"># change the position of the File Handle to the beginning of the file
</span>        <span class="n">fp</span><span class="p">.</span><span class="n">seek</span><span class="p">(</span><span class="mi">0</span><span class="p">)</span>
        <span class="c1"># load the model using joblib library
</span>        <span class="n">model</span> <span class="o">=</span> <span class="n">joblib</span><span class="p">.</span><span class="n">load</span><span class="p">(</span><span class="n">fp</span><span class="p">)</span>

    <span class="c1"># prediction from the model, returns 0 or 1
</span>    <span class="k">return</span> <span class="n">model</span><span class="p">.</span><span class="n">predict</span><span class="p">(</span><span class="n">profile_to_pred_prep</span><span class="p">)</span>

</code></pre></div></div>

<p>Let’s create an if statement that will call the function above only when someone clicks on the predict button. The following code will be executed only when <code class="language-plaintext highlighter-rouge">predict_bt</code> is = <code class="language-plaintext highlighter-rouge">1</code>, meaning when someone clicks the predict button.</p>

<p>The animation will run as long as the <code class="language-plaintext highlighter-rouge">make_prediction</code> function is running and will stop once the function has finished executing. If the result from the prediction is <code class="language-plaintext highlighter-rouge">0</code>, a green banner for success will be displayed with text that the applicant has been approved for a credit card; it is <code class="language-plaintext highlighter-rouge">1</code>, and a red banner will be displayed with the appropriate text.</p>

<div class="language-python highlighter-rouge"><div class="highlight"><pre class="highlight"><code><span class="k">if</span> <span class="n">predict_bt</span><span class="p">:</span>
    <span class="c1"># will run the animation as long as the function is running, if final_pred exit, then stop displaying the loading animation
</span>    <span class="k">with</span> <span class="n">st_lottie_spinner</span><span class="p">(</span><span class="n">lottie_loading_an</span><span class="p">,</span> <span class="n">quality</span><span class="o">=</span><span class="s">'high'</span><span class="p">,</span> <span class="n">height</span><span class="o">=</span><span class="s">'200px'</span><span class="p">,</span> <span class="n">width</span><span class="o">=</span><span class="s">'200px'</span><span class="p">):</span>
        <span class="n">final_pred</span> <span class="o">=</span> <span class="n">make_prediction</span><span class="p">()</span>
    <span class="c1"># the prediction is 0
</span>    <span class="k">if</span> <span class="n">final_pred</span><span class="p">[</span><span class="mi">0</span><span class="p">]</span> <span class="o">==</span> <span class="mi">0</span><span class="p">:</span>
        <span class="c1"># display a green banner for success
</span>        <span class="n">st</span><span class="p">.</span><span class="n">success</span><span class="p">(</span><span class="s">'## You have been approved for a credit card'</span><span class="p">)</span>
        <span class="c1"># display the streamlit ballon
</span>        <span class="n">st</span><span class="p">.</span><span class="n">balloons</span><span class="p">()</span>
    <span class="c1"># if prediction is 1
</span>    <span class="k">elif</span> <span class="n">final_pred</span><span class="p">[</span><span class="mi">0</span><span class="p">]</span> <span class="o">==</span> <span class="mi">1</span><span class="p">:</span>
        <span class="c1"># display a red banner for error/failure
</span>        <span class="n">st</span><span class="p">.</span><span class="n">error</span><span class="p">(</span><span class="s">'## Unfortunately, you have not been approved for a credit card'</span><span class="p">)</span>

</code></pre></div></div>

<p>That is it, guys!! We have our Streamlit interface ready to go; now we need to deploy it on Streamlit share and share it with the world. What an exciting moment! :)</p>

<h3>Deployment to Streamlit share (free web hosting for the Streamlit Web interface)</h3>

<p>In this last session, we will deploy our web interface to Streamlit share. In other words, we are creating a front-end interface for our model through which the applicant can interact with our trained model.</p>

<p>Before deployment, we first need to store our Streamlit file on Github, where Streamlit can pick up the files from the Github repository.</p>

<p>Head on to Github, sign up for an account if you don’t already have one and create a new repository just like this.</p>

<p><img src="/blog/assets/post_cont_image/github_repo.png" alt="GitHub New Repo" /></p>

<p>We get the following page, give it a name and description (optional) and set the repository to be public so that Streamlit can read the file. And hit the create repository button.</p>

<p><img src="/blog/assets/post_cont_image/github_create_repo.png" alt="Github create repo" /></p>

<p>Drag and drop our streamlit python file in the area below.</p>

<p><img src="/blog/assets/post_cont_image/github_drag.png" alt="GitHub drag" /></p>

<p>Streamlit also needs a <code class="language-plaintext highlighter-rouge">requirements.txt</code> file to be added to the repo. This simple text file will inform Streamlit which version of the python libraries to install on the Streamlit servers.</p>

<p>Create a text file locally, copy past the information below, and then upload it to GitHub like the python file.</p>

<p>Note: it is crucial to name the file <code class="language-plaintext highlighter-rouge">requirements.txt</code> so that Streamlit can read it; otherwise, it won’t deploy.</p>

<div class="language-plaintext highlighter-rouge"><div class="highlight"><pre class="highlight"><code>numpy==1.22.0
pandas==1.3.5
scikit-learn==1.0.2
imbalanced-learn==0.9.0
streamlit&gt;=1.8.1
boto3==1.20.34
joblib&gt;=0.11,&lt;=1.0.1
streamlit-lottie==0.0.3
</code></pre></div></div>

<p>So now we can commit the two files after giving them a brief description.</p>

<p><img src="/blog/assets/post_cont_image/Github_commit_change.png" alt="Github commit saved" /></p>

<p>Now let’s head to Streamlit share, <a href="https://share.streamlit.io/">here</a> is the link. You can sign up with your Google account.</p>

<p>After login in, you will land on this page. I already have three apps deployed here.</p>

<p><img src="/blog/assets/post_cont_image/streamlit_new_app.png" alt="New app" /></p>

<p>So on the deployment page, fill in the information below.</p>

<p>For the repository, you give it the username of your GitHub account, separated from the repository name by /
For the branch, it should default, which is the main branch
For main file path, it should be the Streamlit Python file name</p>

<p>Then click on the Advanced settings.</p>

<p><img src="/blog/assets/post_cont_image/deploy_app.png" alt="Deploy an app on Streamlit" /></p>

<p>A new pop window will come; select the latest Python version and past the access and secret access key from AWS S3.</p>

<p><img src="/blog/assets/post_cont_image/save_deployed_app.png" alt="Save deployed app" /></p>

<p>Now relax and give it a minute while the app is deploying on Streamlit.</p>

<p><img src="/blog/assets/post_cont_image/deploying.png" alt="deploying" /></p>

<p>Tadaaaa! the app should be up and running on Streamlit.</p>

<p><img src="/blog/assets/post_cont_image/running.png" alt="App running" /></p>

<p><a href="https://share.streamlit.io/semasuka/credit-card-approval-prediction-classification/main/cc_approval_pred.py">Here is the link</a> of the app deployed on Streamlit.</p>

<h3>Conclusion</h3>

<p>It was a long and fascinating project. We have come a long way, and you are still with me; you deserve a pad on your shoulder. By now, you should have a good grasp of what an end-to-end Machine Learning project is all about.</p>

<p>In this project, we touched at pretty much the main processes into carring an end-to-end Machine learning project, which are:</p>
<ul>
  <li>Exploratory data analysis</li>
  <li>Data preparation</li>
  <li>Training the model</li>
  <li>Model selection</li>
  <li>Testing the model</li>
  <li>Building a web interface for the model</li>
  <li>Deploying the model</li>
</ul>

<p>The only process I would say is missing is Web Scrapping the data because, in the real world, data is not found on Kaggle or clean. Data is received either through source data (could be a file, database, or API), but sometimes we might need to scrap it from a website. Hey! this is an excellent idea for you to apply the knowledge you gained from this project to your project. Try to scrap a website for your next project and create an end-to-end machine learning project as we did in this post.</p>

<p>I also want to mention some of the limitations of this project and what could be improved:</p>
<ul>
  <li>This model only predicts if an applicant is approved or not for a credit card, we could combine this model with a regression model to predict how much of a credit limit an applicant will be approved for.</li>
  <li>We could do a hyperparameter tuning with grid search or random search.</li>
  <li>We could do a chi-square test.</li>
  <li>We could also retrain the model without the least predictive features.</li>
</ul>

<p>I hope you enjoyed this project as much as I did. Find the codes of this project on my GitHub profile <a href="https://github.com/semasuka/Credit-card-approval-prediction-classification">here</a></p>

<p>Thank you again for going through this project with me. I hope you have learned one or two things. If you like this post, please subscribe to stay updated with new posts, and if you have a thought, correction or a question, I would love to hear it by commenting below. Remember, practice makes perfect! Keep on learning every day! Cheers!</p>]]></content><author><name>Stern Semasuka</name></author><category term="python" /><category term="machine learning" /><category term="tutorial" /><category term="classification" /><category term="project" /><category term="deployment" /><summary type="html"><![CDATA[Welcome back, forks! After a long period of not posting here, I am happy to share that I am back again on MIB. In this post, we will work on an end-to-end machine learning project. I firmly believe this is one of the most detailed and comprehensive end-to-end ML project blog post on the internet. This project is perfect for the beginner in Machine Learning and seasoned ML engineers who could still learn one or two things from this post. This project was featured on Luke Barousse Youtube channel, click here to watch the video.]]></summary><media:thumbnail xmlns:media="http://search.yahoo.com/mrss/" url="https://semasuka.github.io/blog/blog/assets/post_images/cc.jpeg" /><media:content medium="image" url="https://semasuka.github.io/blog/blog/assets/post_images/cc.jpeg" xmlns:media="http://search.yahoo.com/mrss/" /></entry><entry><title type="html">Demystify Machine Learning</title><link href="https://semasuka.github.io/blog/blog/2021/04/04/demystify-machine-learning.html" rel="alternate" type="text/html" title="Demystify Machine Learning" /><published>2021-04-04T00:00:00+00:00</published><updated>2021-04-04T00:00:00+00:00</updated><id>https://semasuka.github.io/blog/blog/2021/04/04/demystify-machine-learning</id><content type="html" xml:base="https://semasuka.github.io/blog/blog/2021/04/04/demystify-machine-learning.html"><![CDATA[<p>Welcome back! I am very excited about this post as we are introducing machine learning and its commonly used jargon. You will have a broad overview of machine learning, how it works, and even write our first machine learning code at the end of the post. To understand advanced machine learning, we first need to have a good grasp of the fundamentals. That is why I think this is the most important post on this blog so far.<!-- more --></p>

<p>With no further due, let’s get started.</p>

<h3>1. What is machine learning, and how can a machine learn?</h3>

<h4>1.1 What is machine learning</h4>

<p><strong><em>Machine learning</em></strong> is a subfield of computer science that studies the ability of a computer to learn and exhibit cognitive abilities without being explicitly programmed.</p>

<h4>1.2 How do computers learn?</h4>

<p>As we have previously said, computers learn through data. The more the data, the better. Computers are very good at discovering not immediately apparent patterns within a large dataset (tabular or non-tabular) than humans. It is called <strong><em>data mining</em></strong>. Data mining is a whole separate computer science field on its own.</p>

<p>Going back to our question, how can machines learn? one way is by breaking the dataset into two datasets. A <strong><em>training dataset</em></strong> and a <strong><em>testing dataset</em></strong>. As a good rule of thumb, the training dataset should account for 80% of the dataset, and the test dataset should be 20% (more on this later in the post). Each unit of information in the dataset is a <strong><em>datapoint</em></strong> represented as the entire row in a tabular dataset.</p>

<p><img src="/blog/assets/post_cont_image/dml_dataset_split.jpg" alt="dataset_split" /></p>

<p>A training dataset is a dataset used to train(teach) <strong><em>the model</em></strong> (also called <strong><em>estimators</em></strong> in Scikit-learn library, and I’ll be using those two words interchangeably). We use the testing dataset to evaluate the model and see how well it has learned (also called measuring its <strong><em>accuracy</em></strong>).</p>

<p>Note: we should never train a model on the testing dataset, or else it defeats the whole purpose of evaluating the model.</p>

<p>Let me explain this statement further. Let’s say you are a student enrolled in a math course. To pass the exam, you have to practice by doing many exercises to become good at it. If the lecture decides to give you the exam paper for practice,  probably during the exam time, you will score close to 100%. But does that mean that you have mastered the course? Of course not! You have just memorized the whole exam without really understanding anything. The same happens to a machine learning model trained and tested on a testing dataset. It is called <strong><em>overfitting</em></strong> (more on this later in the post). That is why we need to hide the model from the testing dataset and only train on the training dataset.</p>

<h3>2. Use of machine learning VS traditional programming?</h3>

<p>To understand when shall we use machine learning, we need first to understand how machine learning and traditional programming work under the hood.</p>

<h4>2.1 How machine learning works VS traditional programming?</h4>
<h4>2.1.1 Traditional programming</h4>

<p>Let’s start with traditional programming. It includes all the backends development, front-end development, mobile development, dev-ops, systems architecture, etc. All these computer science subfields share the same fundamentals of using a set of instructions called <strong><em>Algorithms</em></strong> written by a programmer that takes an input and produces an output. Think of it as a more complex “if and else statement” for example, if a user presses this button, then change the webpage to this new page.</p>

<p><img src="/blog/assets/post_cont_image/trad_programming.jpg" alt="traditional_programming_process" /></p>

<p>If an unexpected event occurs (not coded), the algorithm will not execute, and the software/app will crash. Now you know what is happening when you see a blue screen in Windows or your mobile app has unexpectedly stopped working. The algorithm can’t troubleshoot itself without the intervention of the programmer. That is why you always have to upgrade your software or app to fix the “bugs”.</p>

<p><img src="/blog/assets/post_cont_image/unexpected_input.jpg" alt="unexpected_input" /></p>

<h4>2.1.1 Machine learning</h4>

<p>On the other hand, machine learning works differently than traditional programming. We feed (train) the machine learning model datasets as input and let the model predict the best output. We, the programmers, don’t explicitly write those instructions. We help the model fine-tune its parameters (more on this later) to find the best predictions. Consequently, the more the data we feed to the model, the better the predictions become overtime.</p>

<p>We evaluate the model and see if it has learned well. If the result is satisfying, then we lunch the model into production. If not, we then analyze the model, fine-tune its parameter, and retraining the model is required.</p>

<p><img src="/blog/assets/post_cont_image/ML_process.jpg" alt="ML-process" /></p>

<p>Note: it is crucial to feed the model accurate and clean data (without outliers or missing data) because if you don’t, then the predictions will be off, and its accuracy won’t be reliable. That is why modeling (the process of training the model) is the least consuming task in an end-to-end machine learning project compare to data cleaning. I wrote in <a href="https://semasuka.github.io/blog/2019/03/26/introduction-to-eda.html" target="_blank">this post</a> that data scientists spend 60% of their time cleaning the training data and only 4% modeling and training the model.</p>

<h4>2.2 When shall we use machine learning or traditional programming?</h4>

<p>Here are some questions to ask yourself when deciding to use whether machine learning or traditional programming for a project:</p>

<ul>
  <li>
    <p>Does this project try to solve a problem that requires a lot of fine-tuning and rules? If you answered yes, then use machine learning.</p>

    <p>To clarify the point above, let’s say that you work at a bank as a fraud expert analyst, and your boss tells you that there has been a sharp increase in credit card frauds this month. As a fraud expert with programming skills, you need to find a solution to this as soon as possible. You first analyze the transactions reported as fraudulent. You notice interesting similarities among 80% of them: First, those transactions are orchestrated from overseas. Second, they are below one thousand dollars. Third, the account holders are mostly seniors (65 years old and above).</p>

    <p>After gathering these pieces of information, you decided to create a script to detect and block automatically similar transactions that will occur in the future. The code is not perfect, as there are false positives, but after deploying the script for a week, there is a drop in the number of fraudulent transactions reported. Yes! We did.</p>

    <p>After two months, your boss comes back to you and tells you that the number of fraud has gone up again. It seems like the scammers now use a VPN as the transactions appear to be from within the country. Secondly, in the new fraudulent transactions, the amount transacted is not below on thousand dollars all the time. The scammers have found a way to bypass the script that you have put in place.</p>

    <p>Now, you are thinking about two options: Option 1, rewrite a new script with the new rules and option 2, come up with a script that can adapt to new rules without being explicitly coded.</p>

    <p>The first option is tedious, and it is a matter of time until the scammers find another way of going around it. So the best option would be option 2, to let the script adapt and block the fraudulent transactions with minimal intervention.</p>
  </li>
  <li>
    <p>Does this project try to solve a complex problem where using traditional programming has failed? Then use machine learning. Example: Detection of a cancer cell in an image.</p>
  </li>
  <li>
    <p>Does this project try to solve a complex problem in a constantly changing environment? Then use machine learning as it can adapt to a constantly changing environment as it receives more and more data. Example: Robots that sort trash on a recycling line depending on the type of materials using computer vision.</p>
  </li>
  <li>
    <p>Does this project try to solve a complex problem with a large amount of data? Then use machine learning. Example: Self-driving cars in a busy street.</p>
  </li>
</ul>

<p>I firmly believe that machine learning and traditional programming will continue to co-exist as they solve problems differently. Therefore one can’t replace the other.</p>

<h3>3. Types of machine learning</h3>

<p>There are different types of machine learning systems depending on how we train them, how they learn, and how they generalize.</p>

<h3>3.1 Types of machine learning system classified on how we train them</h3>

<h4>3.1.1 Supervised learning</h4>

<p>We train these types of machine learning using <strong><em>labels</em></strong>. It means that in the training dataset, we have the desired outputs. We use different datapoints attributes called <strong><em>features</em></strong> or <strong><em>predictor</em></strong> to train the model and predict the labels.</p>

<p>For example, given a dataset with features like age, gender, weight, height, family history and blood pressure, we are trying to predict if someone has diabetes or not. The last column in the training dataset is the label. This type of training is called <strong><em>classification model</em></strong> because we are classifying the data points into two groups (has diabetes or does not have diabetes).</p>

<p><img src="/blog/assets/post_cont_image/datasplit_sup.jpg" alt="supervised_train" /></p>

<p>The labels can also be numerical. In this case, we are dealing with a <strong><em>regression model</em></strong>. An example of this would be predicting the houses price depending on different features like the size, the location, the mortgage interest rate, etc.</p>

<h4>3.1.2 Unsupervised learning</h4>

<p>For this type of machine learning, we train the model without labels. With your help, the model will try to figure out the correlations within the datasets. Listed below are the unsupervised tasks we could perform:</p>

<ul>
  <li><strong><em>clustering</em></strong> to discover similar data points within the dataset and <strong><em>hierarchical clustering</em></strong> to group similar data points into smaller groups. Each group is called <strong><em>cluster</em></strong></li>
</ul>

<p><img src="/blog/assets/post_cont_image/clustering.jpg" alt="hierarchical_clustering" />
<em>Credit: <a href="https://www.kdnuggets.com/2019/09/hierarchical-clustering.html" target="_blank">Kdnuggets</a></em></p>
<ul>
  <li>
    <p><strong><em>dimensionality reduction</em></strong> to merge similar features into one feature. For example, we could combine the smartphone’s age with its battery health as those two are strongly correlated. We call it <strong><em>feature extraction</em></strong></p>
  </li>
  <li>
    <p><strong><em>anomaly detection</em></strong> by detecting automatically and removing <em>outliers</em> (a data point that differs significantly from the rest of data points) and <strong><em>novelty detection</em></strong> by detecting but not flagging as outliers incoming data point that looks different from the rest of data points in the dataset.</p>
  </li>
</ul>

<p><img src="/blog/assets/post_cont_image/anomaly.jpg" alt="anomaly" /></p>

<ul>
  <li><strong><em>association rule learning</em></strong> to discover underlying relations between data points in a large dataset. For example, through data, we have found out that clients in the supermarket who bought chicken will most likely buy the barbeque sauce. It makes sense to give a bundle pricing discount or place those two products close together on the shelves to incentivize the purchase.</li>
</ul>

<h4>3.1.3 Semisupervised learning</h4>

<p>We can combine a small labelled dataset and an unlabeled dataset to get a semi labelled dataset. Now you might ask why can we just label the whole dataset? well because labelling a dataset is time-consuming and very expensive as it does require a skilled person.</p>

<p>Semisupervised learning is a great alternative from supervised learning because some machine learning models are able to train using a partially labelled dataset.</p>

<h4>3.1.4 Reinforcement learning</h4>

<p>Reinforcement learning works differently than the previous types. It involves an “agent” taking action to perform tasks using a strategy called “policy”. We want him to do one specific task and avoid the others. Each time the agent accomplishes the desired task, he gets rewarded. If not, he gets penalized.</p>

<p>The more the rewards, the more the agents understand that it needs to perform the desired task (just like the Pavlov’s dogs conditioning). Through trials and errors with the feedback (in terms of rewards and penalties), the agent learns and becomes good at the task we require him to perform.</p>

<p>Of course, this is a simple explanation of reinforcement learning as it is a bit more complex, but you have at least a basic understanding. Deepmind’s AlphaGo used reinforcement learning to beat the professional Go player Lee Sedol in 2016.</p>

<p>Jabril has a video where he did a great job at explaining reinforcement learning in details. By the way, I highly advise watching his entire AI crash course series.</p>

<p><a href="https://www.youtube.com/watch?v=nIgIv4IfJ6s" target="_blank"><img src="/blog/assets/post_cont_image/jabril_rl.jpg" alt="Jabril_reinforcement_learning" /></a></p>

<h3>3.2 Types of machine learning system classified on how they learn</h3>

<h4>3.2.1 Batch learning</h4>

<p>For this type of learning, the model has to be trained one step at a time. It means that the model can’t learn continuously on the fly. It needs first to train with all the available data before the initial deployment into production. Once into production, it will only predict using the training dataset we had previously used.</p>

<p>To retrain the model on new data, we need to take down the model, train a new version of the model with the full dataset (old and new) offline, then replace the old model and deploy the new version. That is why it is called <strong><em>offline learning</em></strong>. The con of this method is that it is time and resource consuming.</p>

<h4>3.2.2 Online learning</h4>

<p>Here, the model is train gradually, meaning that we can feed the model new data in small groups (called <strong><em>mini-batches</em></strong>) on the fly while the model is in production. This method is way cheaper than batch learning. The disadvantage is when the new data quality deteriorates, it also affects the model’s performance. Thus, constant monitoring of the quality of new data is required.</p>

<h3>3.3 Types of machine learning system classified on how they generalize (making a prediction on new data)</h3>

<h4>3.3.3 Instance-based learning</h4>

<p>This type of learning is comparable to the script used for spotting the fraudulent transactions seen above. That script looked at the similarities (overseas transactions below $1000 and senior account holder) among the reported fraudulent transactions and new transactions, then flagged the very similar ones.</p>

<p>This script learnt by examples, by memorizing the similarities and made predictions on new data it has never seen before.</p>

<h4>3.3.4 Model-based learning</h4>

<p>As the name implies, model-based learning means that we build and use a model to make predictions. Let’s illustrate this with a concrete example.</p>

<p>We all have heard the expression: “Money does not buy happiness”. As an avid researcher, you want to prove that with numbers, and as we know: “Numbers don’t lie”. Right?</p>

<p>So you decide to survey your friends, family members and internet users, asking them their incomes and then rank their happiness in life on a scale of 1 to 10.</p>

<p>You got a total of 498 responses, which is not a large dataset, but for this experiment, it is a good population sample. Download the dataset <a href="https://cdn.scribbr.com/wp-content/uploads//2020/02/income.data_.zip" target="_blank">here</a>.</p>

<p>Let’s first start by importing Numpy, Pandas, Matplotlib and the CSV file.</p>

<div class="language-python highlighter-rouge"><div class="highlight"><pre class="highlight"><code><span class="kn">import</span> <span class="nn">numpy</span> <span class="k">as</span> <span class="n">np</span>
<span class="kn">import</span> <span class="nn">pandas</span> <span class="k">as</span> <span class="n">pd</span>
<span class="kn">import</span> <span class="nn">matplotlib.pyplot</span> <span class="k">as</span> <span class="n">plt</span>
<span class="o">%</span><span class="n">matplotlib</span> <span class="n">inline</span>
</code></pre></div></div>

<div class="language-python highlighter-rouge"><div class="highlight"><pre class="highlight"><code><span class="n">income_data</span> <span class="o">=</span> <span class="n">pd</span><span class="p">.</span><span class="n">read_csv</span><span class="p">(</span><span class="s">"income_data.csv"</span><span class="p">)</span>
<span class="n">income_data</span>
</code></pre></div></div>

<div>
<style scoped="">
    .dataframe tbody tr th:only-of-type {
        vertical-align: middle;
    }

    .dataframe tbody tr th {
        vertical-align: top;
    }

    .dataframe thead th {
        text-align: right;
    }
</style>
<table border="1" class="dataframe">
  <thead>
    <tr style="text-align: right;">
      <th></th>
      <th>Unnamed: 0</th>
      <th>income</th>
      <th>happiness</th>
    </tr>
  </thead>
  <tbody>
    <tr>
      <th>0</th>
      <td>1</td>
      <td>3.862647</td>
      <td>2.314489</td>
    </tr>
    <tr>
      <th>1</th>
      <td>2</td>
      <td>4.979381</td>
      <td>3.433490</td>
    </tr>
    <tr>
      <th>2</th>
      <td>3</td>
      <td>4.923957</td>
      <td>4.599373</td>
    </tr>
    <tr>
      <th>3</th>
      <td>4</td>
      <td>3.214372</td>
      <td>2.791114</td>
    </tr>
    <tr>
      <th>4</th>
      <td>5</td>
      <td>7.196409</td>
      <td>5.596398</td>
    </tr>
    <tr>
      <th>...</th>
      <td>...</td>
      <td>...</td>
      <td>...</td>
    </tr>
    <tr>
      <th>493</th>
      <td>494</td>
      <td>5.249209</td>
      <td>4.568705</td>
    </tr>
    <tr>
      <th>494</th>
      <td>495</td>
      <td>3.471799</td>
      <td>2.535002</td>
    </tr>
    <tr>
      <th>495</th>
      <td>496</td>
      <td>6.087610</td>
      <td>4.397451</td>
    </tr>
    <tr>
      <th>496</th>
      <td>497</td>
      <td>3.440847</td>
      <td>2.070664</td>
    </tr>
    <tr>
      <th>497</th>
      <td>498</td>
      <td>4.530545</td>
      <td>3.710193</td>
    </tr>
  </tbody>
</table>
<p>498 rows × 3 columns</p>
</div>

<p>Now, let’s drop the <code class="language-plaintext highlighter-rouge">Unnamed: 0</code> column because it is a duplicate column since we already have the index column automatically added by pandas. Let’s also scale up the income column to 10000 to make it more realistic and round the numbers in the dataset by two decimal places.</p>

<div class="language-python highlighter-rouge"><div class="highlight"><pre class="highlight"><code><span class="n">income_data</span> <span class="o">=</span> <span class="n">income_data</span><span class="p">.</span><span class="n">drop</span><span class="p">(</span><span class="n">columns</span><span class="o">=</span><span class="p">[</span><span class="s">"Unnamed: 0"</span><span class="p">])</span>
</code></pre></div></div>

<div class="language-python highlighter-rouge"><div class="highlight"><pre class="highlight"><code><span class="n">income_data</span><span class="p">[</span><span class="s">"income"</span><span class="p">]</span> <span class="o">=</span> <span class="n">income_data</span><span class="p">[</span><span class="s">"income"</span><span class="p">]</span> <span class="o">*</span> <span class="mi">10000</span>
</code></pre></div></div>

<div class="language-python highlighter-rouge"><div class="highlight"><pre class="highlight"><code><span class="n">income_data</span> <span class="o">=</span> <span class="n">income_data</span><span class="p">.</span><span class="nb">round</span><span class="p">(</span><span class="mi">2</span><span class="p">)</span>
</code></pre></div></div>

<div class="language-python highlighter-rouge"><div class="highlight"><pre class="highlight"><code><span class="n">income_data</span>
</code></pre></div></div>

<div>
<style scoped="">
    .dataframe tbody tr th:only-of-type {
        vertical-align: middle;
    }

    .dataframe tbody tr th {
        vertical-align: top;
    }

    .dataframe thead th {
        text-align: right;
    }
</style>
<table border="1" class="dataframe">
  <thead>
    <tr style="text-align: right;">
      <th></th>
      <th>income</th>
      <th>happiness</th>
    </tr>
  </thead>
  <tbody>
    <tr>
      <th>0</th>
      <td>38626.47</td>
      <td>2.31</td>
    </tr>
    <tr>
      <th>1</th>
      <td>49793.81</td>
      <td>3.43</td>
    </tr>
    <tr>
      <th>2</th>
      <td>49239.57</td>
      <td>4.60</td>
    </tr>
    <tr>
      <th>3</th>
      <td>32143.72</td>
      <td>2.79</td>
    </tr>
    <tr>
      <th>4</th>
      <td>71964.09</td>
      <td>5.60</td>
    </tr>
    <tr>
      <th>...</th>
      <td>...</td>
      <td>...</td>
    </tr>
    <tr>
      <th>493</th>
      <td>52492.09</td>
      <td>4.57</td>
    </tr>
    <tr>
      <th>494</th>
      <td>34717.99</td>
      <td>2.54</td>
    </tr>
    <tr>
      <th>495</th>
      <td>60876.10</td>
      <td>4.40</td>
    </tr>
    <tr>
      <th>496</th>
      <td>34408.47</td>
      <td>2.07</td>
    </tr>
    <tr>
      <th>497</th>
      <td>45305.45</td>
      <td>3.71</td>
    </tr>
  </tbody>
</table>
<p>498 rows × 2 columns</p>
</div>

<p>Then, let’s plot the dataset on a scatterplot.</p>

<div class="language-python highlighter-rouge"><div class="highlight"><pre class="highlight"><code><span class="n">plt</span><span class="p">.</span><span class="n">scatter</span><span class="p">(</span><span class="n">income_data</span><span class="p">[</span><span class="s">"income"</span><span class="p">],</span><span class="n">income_data</span><span class="p">[</span><span class="s">"happiness"</span><span class="p">],</span> <span class="n">alpha</span><span class="o">=</span><span class="mf">0.5</span><span class="p">,</span><span class="n">edgecolors</span><span class="o">=</span><span class="s">"black"</span><span class="p">)</span>
<span class="n">plt</span><span class="p">.</span><span class="n">xlabel</span><span class="p">(</span><span class="s">"Income"</span><span class="p">)</span>
<span class="n">plt</span><span class="p">.</span><span class="n">ylabel</span><span class="p">(</span><span class="s">"Hapiness scale"</span><span class="p">)</span>
<span class="n">plt</span><span class="p">.</span><span class="n">show</span><span class="p">()</span>
</code></pre></div></div>

<p><img src="/blog/assets/post_cont_image/output_58_0.png" alt="png" /></p>

<p>Yeah seems like the more money we make, the happier we become! On average, someone making over 70000 dollars is likely to be happier than someone making 20000 dollars. Shocking right?</p>

<p>We can see that the data points follow an upward direction. Now let’s try to create a <strong><em>model</em></strong> that follows best those data points. This step is called a <strong><em>model selection</em></strong>, and in this example, it will be a <strong><em>linear model</em></strong> also called <strong><em>linear regression</em></strong> since there are no curves in the upward direction.</p>

<p>The formula is as follow called the <em>population regression function</em>:</p>

<p>$\alpha$ = $\theta_{0}$ + $\theta_{1}$ $\times$ $\lambda$ + $\epsilon$</p>

<p>where</p>

<p>$\alpha$ is the predicted value. In this case, the happiness scale.</p>

<p>$\theta_{0}$ is the first <strong>parameter</strong> called <strong>intercept</strong> of the predicted values $\alpha$ (happiness scale).</p>

<p>$\theta_{1}$ is the second <strong>parameter</strong> called <strong>regression coefficient</strong>.</p>

<p>$\lambda$ is the independent variable. In this case, it is the income.</p>

<p>$\epsilon$ is the <strong>error</strong>(different from the sample error <strong>e</strong>), also called margin error in our prediction of the regression coefficient. In our case, we assume that there is no error implying that $\epsilon$ = 0</p>

<p>To keep it simple, we will rewrite the equation as follow:</p>

<p><em>happiness scale</em> = $\theta_{0}$ + $\theta_{1}$ $\times$ income</p>

<p>Note: if you have taken a high school algebra course, you might have recognized this formula as the <a href="https://en.wikipedia.org/wiki/Linear_equation" target="_blank">equation of a straight line</a> <code class="language-plaintext highlighter-rouge">y = mx + b</code>  where <code class="language-plaintext highlighter-rouge">x</code> and <code class="language-plaintext highlighter-rouge">y</code> are the x and y axis coordinates, <code class="language-plaintext highlighter-rouge">m</code> is the slope of the line and <code class="language-plaintext highlighter-rouge">b</code> is the y intercept.</p>

<p>This model has two <strong>parameters</strong> $\theta_{0}$ and $\theta_{1}$. We need to find those two parameters value to define a line that follows the best data points. How do we find that? We have the choice between two functions. The <strong><em>utility function</em></strong>(also called <strong><em>fitness function</em></strong>) and the <strong><em>cost function</em></strong>. So what is the difference and which one should we use? The short answer is it depends.</p>

<p>The utility function measures how good the model is, and the cost function calculates how bad the model is. Since we are dealing with linear regression, it is best to use the cost function to compare the distance between the predicted data point coordinate and the linear regression line. We need to reduce that distance as much as possible. The shorter that distance, the more <strong><em>accurate</em></strong> is our model.</p>

<p>So how do we get that linear regression line to best align with the data points? We use the <a href="https://scikit-learn.org/" target="_blank">scikit-learn</a> functions to find the two parameters $\theta_{0}$ and $\theta_{1}$. This is what’s called <strong><em>training</em></strong> the model.</p>

<p>We import directly the function from the scikit-learn library.</p>

<div class="language-python highlighter-rouge"><div class="highlight"><pre class="highlight"><code><span class="kn">from</span> <span class="nn">sklearn</span> <span class="kn">import</span> <span class="n">linear_model</span>
</code></pre></div></div>

<p>Then, we store the estimator (this is how we call a model in the scikit-learn library) in the <code class="language-plaintext highlighter-rouge">est</code> variable.</p>

<div class="language-python highlighter-rouge"><div class="highlight"><pre class="highlight"><code><span class="n">est</span> <span class="o">=</span> <span class="n">linear_model</span><span class="p">.</span><span class="n">LinearRegression</span><span class="p">()</span>
</code></pre></div></div>

<p>Now we store the features as a one-dimensional array in <code class="language-plaintext highlighter-rouge">Xsample_inc</code> and <code class="language-plaintext highlighter-rouge">Ysample_hap</code> using the <code class="language-plaintext highlighter-rouge">c_</code> Numpy function.</p>

<div class="language-python highlighter-rouge"><div class="highlight"><pre class="highlight"><code><span class="n">Xsample_inc</span> <span class="o">=</span> <span class="n">np</span><span class="p">.</span><span class="n">c_</span><span class="p">[</span><span class="n">income_data</span><span class="p">[</span><span class="s">"income"</span><span class="p">]]</span>
<span class="n">Ysample_hap</span> <span class="o">=</span> <span class="n">np</span><span class="p">.</span><span class="n">c_</span><span class="p">[</span><span class="n">income_data</span><span class="p">[</span><span class="s">"happiness"</span><span class="p">]]</span>
</code></pre></div></div>

<p>the linear model estimator learn from those data points using the <code class="language-plaintext highlighter-rouge">fit</code> function</p>

<div class="language-python highlighter-rouge"><div class="highlight"><pre class="highlight"><code><span class="n">est</span><span class="p">.</span><span class="n">fit</span><span class="p">(</span><span class="n">Xsample_inc</span><span class="p">,</span><span class="n">Ysample_hap</span><span class="p">)</span>
</code></pre></div></div>

<div class="language-plaintext highlighter-rouge"><div class="highlight"><pre class="highlight"><code>LinearRegression()
</code></pre></div></div>

<p>Finally, we access the values of $\theta_{0}$ (the intercept) and $\theta_{1}$ (regression coefficient) by calling the <code class="language-plaintext highlighter-rouge">intercept_</code> and <code class="language-plaintext highlighter-rouge">coef_</code> functions on the estimator.</p>

<div class="language-python highlighter-rouge"><div class="highlight"><pre class="highlight"><code><span class="n">est</span><span class="p">.</span><span class="n">coef_</span><span class="p">[</span><span class="mi">0</span><span class="p">][</span><span class="mi">0</span><span class="p">]</span>
</code></pre></div></div>

<div class="language-plaintext highlighter-rouge"><div class="highlight"><pre class="highlight"><code>7.137623851143422e-05
</code></pre></div></div>

<div class="language-python highlighter-rouge"><div class="highlight"><pre class="highlight"><code><span class="n">o0</span><span class="p">,</span><span class="n">o1</span> <span class="o">=</span> <span class="n">est</span><span class="p">.</span><span class="n">intercept_</span><span class="p">[</span><span class="mi">0</span><span class="p">],</span> <span class="n">est</span><span class="p">.</span><span class="n">coef_</span><span class="p">[</span><span class="mi">0</span><span class="p">][</span><span class="mi">0</span><span class="p">]</span>
</code></pre></div></div>

<div class="language-python highlighter-rouge"><div class="highlight"><pre class="highlight"><code><span class="k">print</span><span class="p">(</span><span class="s">"the intercept 𝜃0 is {} and the regression coefficient 𝜃1 is {}"</span><span class="p">.</span><span class="nb">format</span><span class="p">(</span><span class="n">o0</span><span class="p">,</span><span class="n">o1</span><span class="p">))</span>
</code></pre></div></div>

<div class="language-plaintext highlighter-rouge"><div class="highlight"><pre class="highlight"><code>the intercept 𝜃0 is 0.20472523776933782 and the regression coefficient 𝜃1 is 7.137623851143422e-05
</code></pre></div></div>

<p>With these two values, we can plot the linear regression line.</p>

<div class="language-python highlighter-rouge"><div class="highlight"><pre class="highlight"><code><span class="n">plt</span><span class="p">.</span><span class="n">scatter</span><span class="p">(</span><span class="n">income_data</span><span class="p">[</span><span class="s">"income"</span><span class="p">],</span><span class="n">income_data</span><span class="p">[</span><span class="s">"happiness"</span><span class="p">],</span> <span class="n">alpha</span><span class="o">=</span><span class="mf">0.5</span><span class="p">,</span><span class="n">edgecolors</span><span class="o">=</span><span class="s">"black"</span><span class="p">)</span>
<span class="n">plt</span><span class="p">.</span><span class="n">axis</span><span class="p">([</span><span class="mi">15000</span><span class="p">,</span><span class="mi">75000</span><span class="p">,</span><span class="mi">0</span><span class="p">,</span><span class="mf">7.2</span><span class="p">])</span>
<span class="n">X_coordinate</span> <span class="o">=</span> <span class="n">np</span><span class="p">.</span><span class="n">linspace</span><span class="p">(</span><span class="mi">15000</span><span class="p">,</span><span class="mi">75000</span><span class="p">)</span>
<span class="n">plt</span><span class="p">.</span><span class="n">plot</span><span class="p">(</span><span class="n">X_coordinate</span><span class="p">,</span> <span class="n">o0</span> <span class="o">+</span> <span class="n">o1</span><span class="o">*</span><span class="n">X_coordinate</span><span class="p">,</span> <span class="n">color</span><span class="o">=</span><span class="s">"r"</span><span class="p">,</span><span class="n">linewidth</span><span class="o">=</span><span class="mi">3</span><span class="p">)</span>
<span class="n">plt</span><span class="p">.</span><span class="n">text</span><span class="p">(</span><span class="mi">18000</span><span class="p">,</span><span class="mf">6.5</span><span class="p">,</span> <span class="sa">r</span><span class="s">"$\theta_{0} = 0.20$"</span><span class="p">,</span><span class="n">fontsize</span><span class="o">=</span><span class="mi">14</span><span class="p">,</span><span class="n">color</span><span class="o">=</span><span class="s">"r"</span><span class="p">)</span>
<span class="n">plt</span><span class="p">.</span><span class="n">text</span><span class="p">(</span><span class="mi">18000</span><span class="p">,</span><span class="mf">5.5</span><span class="p">,</span> <span class="sa">r</span><span class="s">"$\theta_{1} = 7.13 \times 10^{-5}$"</span><span class="p">,</span><span class="n">fontsize</span><span class="o">=</span><span class="mi">14</span><span class="p">,</span><span class="n">color</span><span class="o">=</span><span class="s">"r"</span><span class="p">)</span>
<span class="n">plt</span><span class="p">.</span><span class="n">xlabel</span><span class="p">(</span><span class="s">"Income"</span><span class="p">)</span>
<span class="n">plt</span><span class="p">.</span><span class="n">ylabel</span><span class="p">(</span><span class="s">"Hapiness scale"</span><span class="p">)</span>
<span class="n">plt</span><span class="p">.</span><span class="n">title</span><span class="p">(</span><span class="s">"Linear regression of Hapiness VS income"</span><span class="p">)</span>
<span class="n">plt</span><span class="p">.</span><span class="n">show</span><span class="p">()</span>
</code></pre></div></div>

<p><img src="/blog/assets/post_cont_image/output_82_0.png" alt="png" /></p>

<p>We plot the dataset’s features using a scatter plot and set the plot axis limits. We then create an interval <code class="language-plaintext highlighter-rouge">X</code> that represents the axis limit of the linear regression line and set it to range from 15000 to 75000 (we don’t need the steps because drawing a line requires only two coordinate in a 2D dimension).</p>

<p>We then plot <code class="language-plaintext highlighter-rouge">X_coordinate</code> on the X and Y axis using the <a href="https://en.wikipedia.org/wiki/Linear_equation" target="_blank">linear equation</a> and change the color of the line to red using the character <code class="language-plaintext highlighter-rouge">"r"</code>.</p>

<p>Finally, we place the text of $\theta_{0}$ and $\theta_{1}$ in the plot with the axis labels and title.</p>

<p>If we don’t need the values of $\theta_{0}$ and $\theta_{1}$ and only want to plot the linear regression line <a href="https://seaborn.pydata.org/" target="_blank">seaborn</a> has a function for that.</p>

<div class="language-python highlighter-rouge"><div class="highlight"><pre class="highlight"><code><span class="kn">import</span> <span class="nn">seaborn</span> <span class="k">as</span> <span class="n">sns</span>
</code></pre></div></div>

<div class="language-python highlighter-rouge"><div class="highlight"><pre class="highlight"><code><span class="n">sns</span><span class="p">.</span><span class="n">regplot</span><span class="p">(</span><span class="n">x</span><span class="o">=</span><span class="n">income_data</span><span class="p">[</span><span class="s">"income"</span><span class="p">],</span><span class="n">y</span><span class="o">=</span><span class="n">income_data</span><span class="p">[</span><span class="s">"happiness"</span><span class="p">],</span><span class="n">line_kws</span><span class="o">=</span><span class="p">{</span><span class="s">"color"</span><span class="p">:</span><span class="s">"red"</span><span class="p">,</span><span class="s">"linewidth"</span><span class="p">:</span><span class="mi">3</span><span class="p">},</span><span class="n">scatter_kws</span><span class="o">=</span><span class="p">{</span><span class="s">"alpha"</span><span class="p">:</span><span class="mf">0.5</span><span class="p">,</span><span class="s">"edgecolor"</span><span class="p">:</span><span class="s">"black"</span><span class="p">})</span>
<span class="n">plt</span><span class="p">.</span><span class="n">text</span><span class="p">(</span><span class="mi">18000</span><span class="p">,</span><span class="mf">6.5</span><span class="p">,</span> <span class="sa">r</span><span class="s">"$\theta_{0} = 0.20$"</span><span class="p">,</span><span class="n">fontsize</span><span class="o">=</span><span class="mi">14</span><span class="p">,</span><span class="n">color</span><span class="o">=</span><span class="s">"r"</span><span class="p">)</span>
<span class="n">plt</span><span class="p">.</span><span class="n">text</span><span class="p">(</span><span class="mi">18000</span><span class="p">,</span><span class="mf">5.5</span><span class="p">,</span> <span class="sa">r</span><span class="s">"$\theta_{1} = 7.13 \times 10^{-5}$"</span><span class="p">,</span><span class="n">fontsize</span><span class="o">=</span><span class="mi">14</span><span class="p">,</span><span class="n">color</span><span class="o">=</span><span class="s">"r"</span><span class="p">)</span>
<span class="n">plt</span><span class="p">.</span><span class="n">title</span><span class="p">(</span><span class="s">"Linear regression of Hapiness VS income"</span><span class="p">)</span>
<span class="n">plt</span><span class="p">.</span><span class="n">xlabel</span><span class="p">(</span><span class="s">"Income"</span><span class="p">)</span>
<span class="n">plt</span><span class="p">.</span><span class="n">ylabel</span><span class="p">(</span><span class="s">"Hapiness scale"</span><span class="p">)</span>
<span class="n">plt</span><span class="p">.</span><span class="n">show</span><span class="p">()</span>
</code></pre></div></div>

<p><img src="/blog/assets/post_cont_image/output_85_0.png" alt="png" /></p>

<p>Now comes the fun part, prediction time! Let’s predict the happiness scale of a new person (not from our survey) given his income.  Let’s say person A makes per year $61200.</p>

<p>We have 2 ways of predicting the happiness scale:</p>

<ol>
  <li>Using the formula <em>happiness scale</em> = $\theta_{0}$ + $\theta_{1}$ $\times$ income.</li>
  <li>Using the model’s <code class="language-plaintext highlighter-rouge">predict</code> function (most recommended).</li>
</ol>

<h4>1. Using the formula</h4>

<p>Using the equation that we previously saw:</p>

<p><em>happiness scale</em> = $\theta_{0}$ + $\theta_{1}$ $\times$ income</p>

<p>After replacement with the numerical values, we get:</p>

<p><em>happiness scale</em> = 0.2047 + 7.13 $\times$ $10^{-5}$ $\times$ 61200</p>

<p>happiness scale ~ 4.56</p>

<h4>2. Using the model’s function</h4>

<p>Now let’s calculate this in codes, shall we?</p>

<div class="language-python highlighter-rouge"><div class="highlight"><pre class="highlight"><code><span class="n">personA_inc</span> <span class="o">=</span> <span class="mi">61200</span>

<span class="n">personA_hap</span> <span class="o">=</span> <span class="n">est</span><span class="p">.</span><span class="n">predict</span><span class="p">([[</span><span class="n">personA_inc</span><span class="p">]])[</span><span class="mi">0</span><span class="p">][</span><span class="mi">0</span><span class="p">]</span>
<span class="k">print</span><span class="p">(</span><span class="s">"The estimated happiness scale of person A with an income of ${} is {:.2f} using linear regression."</span><span class="p">.</span><span class="nb">format</span><span class="p">(</span><span class="n">personA_inc</span><span class="p">,</span><span class="n">personA_hap</span><span class="p">))</span>
</code></pre></div></div>

<div class="language-plaintext highlighter-rouge"><div class="highlight"><pre class="highlight"><code>The estimated happiness scale of person A with an income of $61200 is 4.57 using linear regression
</code></pre></div></div>

<p>We call the <code class="language-plaintext highlighter-rouge">predict</code> function on the estimator then pass as an argument the person A’s income. Note that we add the indexes selection <code class="language-plaintext highlighter-rouge">[0][0]</code> because the <code class="language-plaintext highlighter-rouge">predict</code> function accepts only an array-like or matrix as an argument.</p>

<p>Now, let’s plot this.</p>

<div class="language-python highlighter-rouge"><div class="highlight"><pre class="highlight"><code><span class="n">plt</span><span class="p">.</span><span class="n">scatter</span><span class="p">(</span><span class="n">income_data</span><span class="p">[</span><span class="s">"income"</span><span class="p">],</span><span class="n">income_data</span><span class="p">[</span><span class="s">"happiness"</span><span class="p">],</span> <span class="n">alpha</span><span class="o">=</span><span class="mf">0.5</span><span class="p">,</span><span class="n">edgecolors</span><span class="o">=</span><span class="s">"black"</span><span class="p">,</span><span class="n">zorder</span><span class="o">=</span><span class="mi">1</span><span class="p">)</span>
<span class="n">plt</span><span class="p">.</span><span class="n">axis</span><span class="p">([</span><span class="mi">15000</span><span class="p">,</span><span class="mi">75000</span><span class="p">,</span><span class="mi">0</span><span class="p">,</span><span class="mf">7.2</span><span class="p">])</span>
<span class="n">X_coordinate</span> <span class="o">=</span> <span class="n">np</span><span class="p">.</span><span class="n">linspace</span><span class="p">(</span><span class="mi">15000</span><span class="p">,</span><span class="mi">75000</span><span class="p">)</span>
<span class="n">plt</span><span class="p">.</span><span class="n">plot</span><span class="p">(</span><span class="n">X_coordinate</span><span class="p">,</span> <span class="n">o0</span> <span class="o">+</span> <span class="n">o1</span><span class="o">*</span><span class="n">X_coordinate</span><span class="p">,</span> <span class="n">color</span><span class="o">=</span><span class="s">"r"</span><span class="p">,</span><span class="n">linewidth</span><span class="o">=</span><span class="mi">3</span><span class="p">)</span>
<span class="n">plt</span><span class="p">.</span><span class="n">text</span><span class="p">(</span><span class="mi">18000</span><span class="p">,</span><span class="mf">6.5</span><span class="p">,</span> <span class="sa">r</span><span class="s">"$\theta_{0} = 0.20$"</span><span class="p">,</span><span class="n">fontsize</span><span class="o">=</span><span class="mi">14</span><span class="p">,</span><span class="n">color</span><span class="o">=</span><span class="s">"r"</span><span class="p">)</span>
<span class="n">plt</span><span class="p">.</span><span class="n">text</span><span class="p">(</span><span class="mi">18000</span><span class="p">,</span><span class="mf">6.0</span><span class="p">,</span> <span class="sa">r</span><span class="s">"$\theta_{1} = 7.13 \times 10^{-5}$"</span><span class="p">,</span><span class="n">fontsize</span><span class="o">=</span><span class="mi">14</span><span class="p">,</span><span class="n">color</span><span class="o">=</span><span class="s">"r"</span><span class="p">)</span>
<span class="n">plt</span><span class="p">.</span><span class="n">xlabel</span><span class="p">(</span><span class="s">"Income"</span><span class="p">)</span>
<span class="n">plt</span><span class="p">.</span><span class="n">ylabel</span><span class="p">(</span><span class="s">"Hapiness scale"</span><span class="p">)</span>
<span class="n">plt</span><span class="p">.</span><span class="n">title</span><span class="p">(</span><span class="s">"Linear regression of Happiness VS income"</span><span class="p">)</span>

<span class="c1"># Prediction data point
</span><span class="n">plt</span><span class="p">.</span><span class="n">vlines</span><span class="p">(</span><span class="n">personA_inc</span><span class="p">,</span> <span class="mi">0</span><span class="p">,</span> <span class="n">personA_hap</span><span class="p">,</span><span class="n">linestyles</span><span class="o">=</span><span class="s">"dashed"</span><span class="p">,</span><span class="n">linewidth</span><span class="o">=</span><span class="mi">3</span><span class="p">,</span><span class="n">colors</span><span class="o">=</span><span class="s">"k"</span><span class="p">)</span>
<span class="n">plt</span><span class="p">.</span><span class="n">hlines</span><span class="p">(</span><span class="n">personA_hap</span><span class="p">,</span> <span class="mi">0</span><span class="p">,</span> <span class="n">personA_inc</span><span class="p">,</span><span class="n">linestyles</span><span class="o">=</span><span class="s">"dashed"</span><span class="p">,</span><span class="n">linewidth</span><span class="o">=</span><span class="mi">3</span><span class="p">,</span><span class="n">colors</span><span class="o">=</span><span class="s">"k"</span><span class="p">)</span>
<span class="n">plt</span><span class="p">.</span><span class="n">scatter</span><span class="p">(</span><span class="n">personA_inc</span><span class="p">,</span> <span class="n">personA_hap</span><span class="p">,</span><span class="n">c</span><span class="o">=</span><span class="s">"k"</span><span class="p">,</span><span class="n">marker</span><span class="o">=</span><span class="s">"o"</span><span class="p">,</span><span class="n">s</span><span class="o">=</span><span class="mi">100</span><span class="p">,</span><span class="n">zorder</span><span class="o">=</span><span class="mi">5</span><span class="p">)</span>
<span class="n">plt</span><span class="p">.</span><span class="n">text</span><span class="p">(</span><span class="mi">15500</span><span class="p">,</span><span class="mf">4.7</span><span class="p">,</span> <span class="s">"prediction = 4.57"</span><span class="p">,</span><span class="n">fontsize</span><span class="o">=</span><span class="mi">12</span><span class="p">,</span><span class="n">color</span><span class="o">=</span><span class="s">"k"</span><span class="p">)</span>
<span class="n">plt</span><span class="p">.</span><span class="n">text</span><span class="p">(</span><span class="mi">62000</span><span class="p">,</span><span class="mf">0.2</span><span class="p">,</span> <span class="s">"$61200"</span><span class="p">,</span><span class="n">fontsize</span><span class="o">=</span><span class="mi">12</span><span class="p">,</span><span class="n">color</span><span class="o">=</span><span class="s">"k"</span><span class="p">)</span>

<span class="n">plt</span><span class="p">.</span><span class="n">show</span><span class="p">()</span>
</code></pre></div></div>

<p><img src="/blog/assets/post_cont_image/output_99_0.png" alt="png" /></p>

<p>We can predict the happiness scale using the plot by drawing a perpendicular line (also called the projection of a point to a line) from the X-axis coordinate (61200) to a point belonging to the linear regression line. From that point, we draw another parallel to the X-axis projected to the Y-axis. That point on the Y-axis is our prediction.</p>

<p>Sweet! Now that we understand how we drew the dashed lines, let’s go back to the codes.</p>

<p>We have already seen the first nine lines of codes, and we will focus on the following lines of code. We use the Matplotlib’s <code class="language-plaintext highlighter-rouge">vline</code> function to project <code class="language-plaintext highlighter-rouge">personA_inc</code> value to the linear regression line passing as argument the <code class="language-plaintext highlighter-rouge">personA_inc</code> value as X, <code class="language-plaintext highlighter-rouge">0</code> and <code class="language-plaintext highlighter-rouge">personA_hap</code> to draw a line parallel to the Y-axis starting from the value of <code class="language-plaintext highlighter-rouge">personA_hap</code> on the X-axis. We set the <code class="language-plaintext highlighter-rouge">linestyles</code> to <code class="language-plaintext highlighter-rouge">dashed</code> to draw a dashed line, increase its width by three and finally change the color to black using <code class="language-plaintext highlighter-rouge">k</code>. Vice versa for the <code class="language-plaintext highlighter-rouge">hline</code>.</p>

<p>To emphasize the projected point where the income and the happiness scale meet on the linear regression line, we increase its size, setting the color to black and <code class="language-plaintext highlighter-rouge">zorder</code> to 5 (because we want that point to be on the top of the linear regression line).</p>

<p>How about we use instance-based learning instead of model-based learning? For this, we could use a simple model called <strong><em>K-nearest neighbors</em></strong>. We will look at this estimator in the upcoming post but for now, what you need to know is that it uses the features of the nearest data points(the neighboring points)to make predictions, thus the name.</p>

<p>The code is almost the same as model-based learning. The difference is that we are using a different estimator. Instead of using <code class="language-plaintext highlighter-rouge">linear_model</code> we use <code class="language-plaintext highlighter-rouge">KNeighborsRegressor</code>.</p>

<p>Note: we are importing a regressor model and not a classifier because we are predicting a number.</p>

<div class="language-python highlighter-rouge"><div class="highlight"><pre class="highlight"><code><span class="kn">from</span> <span class="nn">sklearn.neighbors</span> <span class="kn">import</span> <span class="n">KNeighborsRegressor</span>
</code></pre></div></div>

<div class="language-python highlighter-rouge"><div class="highlight"><pre class="highlight"><code><span class="n">est_reg</span> <span class="o">=</span> <span class="n">KNeighborsRegressor</span><span class="p">(</span><span class="n">n_neighbors</span><span class="o">=</span><span class="mi">3</span><span class="p">)</span>
</code></pre></div></div>

<p><code class="language-plaintext highlighter-rouge">n_neighbors</code> is set to three because we want to predict the scale using the three nearest data points.</p>

<div class="language-python highlighter-rouge"><div class="highlight"><pre class="highlight"><code><span class="n">est_reg</span><span class="p">.</span><span class="n">fit</span><span class="p">(</span><span class="n">X</span><span class="o">=</span><span class="n">Xsample_inc</span><span class="p">,</span> <span class="n">y</span><span class="o">=</span><span class="n">Ysample_hap</span><span class="p">)</span>
</code></pre></div></div>

<div class="language-plaintext highlighter-rouge"><div class="highlight"><pre class="highlight"><code>KNeighborsRegressor(n_neighbors=3)
</code></pre></div></div>

<p>Now let’s predict and see what we get.</p>

<div class="language-python highlighter-rouge"><div class="highlight"><pre class="highlight"><code><span class="n">personA_hap</span> <span class="o">=</span> <span class="n">est_reg</span><span class="p">.</span><span class="n">predict</span><span class="p">([[</span><span class="n">personA_inc</span><span class="p">]])[</span><span class="mi">0</span><span class="p">][</span><span class="mi">0</span><span class="p">]</span>
<span class="k">print</span><span class="p">(</span><span class="s">"The estimated happiness scale of person A with an income of ${} is {:.2f} using KNN"</span><span class="p">.</span><span class="nb">format</span><span class="p">(</span><span class="n">personA_inc</span><span class="p">,</span><span class="n">personA_hap</span><span class="p">))</span>
</code></pre></div></div>

<div class="language-plaintext highlighter-rouge"><div class="highlight"><pre class="highlight"><code>The estimated happiness scale of person A with an income of $61200 is 4.53 using KNN
</code></pre></div></div>

<p>We got a result very close to what we got while using model-based learning. Hopefully, you were able to get predictions closed to these results.</p>

<p>If these models are deployed into production and don’t perform well, we can do the following:</p>
<ul>
  <li>add more features like heath status, community vitality, city of residence, life purpose.</li>
  <li>get better quality training data.</li>
  <li>select more advanced and powerful models.</li>
</ul>

<p>The examples above are basic machine learning projects, but it gives us a climbs into the steps taken for every machine learning projects:</p>

<ol>
  <li>We import and clean the data.</li>
  <li>We select the appropriate model (estimator).</li>
  <li>We train the model on the training dataset.</li>
  <li>Finally, use the newly trained model to make predictions on data it has never seen before.</li>
</ol>

<p>Since there are so many models, how do we choose the right one for our project? Well, the amazing team from the Scikit-learn organization came up with this chart below.</p>

<p><img src="/blog/assets/post_cont_image/ml_map.png" alt="ML-map" /></p>

<p>We will be working with some of these models in the upcoming posts, and we will be referring to this diagram frequently.</p>

<h3>4. Main challenges of machine learning and how to overcome them</h3>

<p>Since we don’t live in a perfect world, machine learning has its own set of challenges caused by the data and the model.</p>

<h4>4.1 Challenges related to data</h4>

<h4>4.1.1 Not enough data</h4>

<p>Machine learning requires a lot of data to generalize well on unseen data. Typical machine learning projects require thousands of data points, but more complex projects like self-driving cars will require millions or even billions of data points.</p>

<p>That is why it is challenging and expensive for startups to compete with unicorns like Google, Amazon or Telsa, as those companies already have petabytes of data.</p>

<p>Solution: To get more data</p>

<h4>4.1.2 Train on nonrepresentative data</h4>

<p>If a model is training on nonrepresentative data, it will come up with biased predictions. Think of this as training on a sample of similar data points, which don’t reflect the whole population. We are training on a small dataset not inclusive of all the possible data points in the population. We call this <strong><em>sampling noise</em></strong>.</p>

<p>The opposite can also true when we have a large dataset, but the sampling methodology used is flawed and inclusive of all the possible data points. We call it <strong><em>sampling bias</em></strong>. It applies to both instance-based and model-based learning.</p>

<p>Solution: Gather more representative data</p>

<h4>4.1.3 Train on inaccurate data</h4>

<p>It makes sense that a model fed with a dataset full of errors and outliers will not find patterns and generalize on new data. That is why it is always wise to do an <a href="https://semasuka.github.io/blog/2019/03/26/introduction-to-eda.html" target="_blank">exploratory data analysis</a> and data preparation before training the model.</p>

<p>Solution:</p>

<ol>
  <li>Identify and remove outliers from the dataset</li>
  <li>For missing data, we can remove the feature, the data points, replace the missing data with the median or train one model with the feature and one model without it.</li>
</ol>

<h4>4.1.4 Irrelevant features</h4>

<p>Not all the features in a dataset are useful for generalization. For example, predicting if someone has diabetes with features like age, gender, daily calory intake, height, weight and if the patient has a smartphone or not. Most probably, the last feature is irrelevant to this prediction, and we should drop it. We call this process <strong><em>feature selection</em></strong>.</p>

<p>Solution: Discard irrelevant feature.</p>

<p>Training a model requires a lot of computing power. For that reason, it is best to combine similar features (for example, the smartphone age and its battery health) into one useful feature (smartphone condition). We call this process <strong><em>feature extraction</em></strong>.</p>

<h4>4.2 Challenges related to the model</h4>

<h4>4.2.1 Overfitting</h4>

<p>Overfitting means that the model has learned so well on the training dataset but failed to generalize on a new dataset. It does happen when we train a complex model (like a deep neural network) on a small dataset. It can also happen when we train a model on the dataset then test on that same dataset (That is why it is always crucial to hide the testing dataset by splitting the dataset into a training and testing dataset).</p>

<p>Solution:</p>

<ol>
  <li>Use a simplified model by selecting fewer parameters or constraining the model ( also called <strong><em>regularization</em></strong>).</li>
  <li>Gather more training data.</li>
  <li>Discard outliers and fix missing data.</li>
</ol>

<p>The amount of constrain or regularization applied to a model is called <strong><em>hyperparameters</em></strong>. Think of hyperparameters as a model’s settings set before training to help generalize well. We discuss further <strong><em>hyperparameters</em></strong> when we will be doing an end-to-end project in the next post.</p>

<h4>4.2.2 Underfitting</h4>

<p>Underfitting is the opposite of overfitting which means that the model is too simple and can’t discover the patterns within the data.</p>

<p>Solution:</p>

<ol>
  <li>Use a powerful model.</li>
  <li>Use better features for training.</li>
  <li>Reduce the value of the hyperparameter.</li>
</ol>

<h3>5. Testing and validating the model</h3>

<h4>5.1 Testing</h4>

<p>Now that we have trained our model, how do we know that the model is ready to generalize new data? There must be a sort of metrics used to measure how well it has generalized, right?</p>

<p>We perform a test in the dataset by splitting the dataset into 80% training data and 20% testing data and then calculate the <strong><em>generalization error</em></strong>. The generalization error is the measurement of error the model makes when tested on data it has never seen before. A low training error with a high generalization error implies that the model is overfitting.</p>

<h4>5.2 Model selection and hyperparameter tuning</h4>

<p>Choosing which model to use is quite simple. We train different algorithms and compare their generalization error and pick the one with the lowest generalization error, but how do we choose its hyperparameter values to avoid overfitting?</p>

<p>One solution would be to train using different hyperparameter values and select the value that produces the lowest generalization error on the test dataset. Let’s say that the generalization error is 6% on the training dataset, but when we lunch it into production, we have a generalization error is 14%. Now you are wondering what is going on?</p>

<p>What just happened is that we have found the best hyperparameters for the test dataset, but those hyperparameters don’t perform well on new data.</p>

<p>To solve this issue, we extract a part of the training dataset to find the best model and parameters. This extracted training dataset is called <strong><em>validation set</em></strong>( also called <strong><em>development set</em></strong> or <strong><em>dev set</em></strong>). After finding the best model and parameters values, we use them for training the full training dataset (including the validation set) to get our final model. Then we will use this final model to come up with a generalization error on the testing dataset.</p>

<p><img src="/blog/assets/post_cont_image/val_set.jpg" alt="Validation-set" /></p>

<p>However, the main challenge here will be to know how big (or small) is the validation set compare to the training set. Why would this be a challenge, may you ask?</p>

<p>Because we will train the final model on the whole training dataset, so we must avoid as much as possible selecting a model that is not representative of the entire training set. So how can we overcome this?</p>

<p>We can use <strong><em>cross-validation</em></strong> to divide the training set into small validation sets called <strong><em>k-fold blocks</em></strong> where <strong><em>k</em></strong> represents the number of small validation sets. For example, if we divide the training set into ten smaller validation sets, we will have ten-fold cross-validation. Each model is tested on one small validation set after being trained on the other sets (for the previously mentioned ten-fold cross-validation, the model will be tested on one set and trained on the remaining nine sets). The only disadvantage of using cross-validation is that it requires a lot of computing power because the training time is multiply by the number of validation sets <strong><em>k</em></strong>.</p>

<h3>6. Conclusion</h3>

<p>Wow! You have to have made it until the end! Congratulation! You have learned a lot about machine learning in this post. It is okay to go through this post twice or thrice to grasp everything. But don’t worry! You will strengthen your understanding more when we start doing end-to-end machine learning projects. We will practice most of the theoretical concepts that we have discussed in this post in future posts.</p>

<p>Finally, here is a recap of the main points we have discovered in this post:</p>

<ul>
  <li>
    <p>Machine learning is the computer’s ability to learn through data and make predictions on new data without being explicitly hardcoded.</p>
  </li>
  <li>
    <p>If the problem you are trying to solve requires a lot of fine-tuning, or is complex, or requires a large amount of data, only then use machine learning</p>
  </li>
  <li>
    <p>There are different types of machine learning systems grouped b, first how they train (supervised, unsupervised, semisupervised or reinforcement learning). Second, how they learn (batch or online learning). Third, how they generalize (instance-based or model-based learning).</p>

    <p>Most machine learning projects follow this blueprint:</p>
    <blockquote>
      <p>Gather data -&gt; clean data -&gt; Split the dataset into training and testing data -&gt; feed the training dataset -&gt; test using the testing dataset -&gt; find the generalization error of the model -&gt; improve the generalization error</p>
    </blockquote>
  </li>
  <li>
    <p>Machine learning faces some challenges caused by the data and the model</p>
  </li>
  <li>
    <p>To know the accuracy of a machine learning model, we have to test it to find the generalization error. If satisfied with it, we select the best model and its hyperparameters using the validation set and the cross-validation.</p>
  </li>
</ul>

<p>Note: Always try to first use traditional programming before using machine learning (or deep learning).  Don’t be like this guy below :)</p>

<p><img src="/blog/assets/post_cont_image/cut_dl.jpg" alt="cutting-sword" /></p>

<p>Image credit: <a href="https://www.google.com/url?sa=i&amp;url=https%3A%2F%2Fknowyourmeme.com%2Fmemes%2Fcutting-food-with-a-sword&amp;psig=AOvVaw2CMnmX3rcg63eawO9zq6bl&amp;ust=1617641348297000&amp;source=images&amp;cd=vfe&amp;ved=0CAIQjRxqFwoTCJCa_ueF5e8CFQAAAAAdAAAAABAD" target="_blank">cutting-sword-credit</a></p>
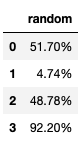
<p>In the next post, we will work on an end-to-end machine learning project. I hope you enjoyed this post as much as I did. Find the jupyter notebook version of this post on my GitHub profile <a href="https://github.com/semasuka/blog/blob/gh-pages/ipynb/Demystify%20Machine%20Learning.ipynb" target="_blank">here</a>.</p>

<p>Thank you again for going through this tutorial with me. I hope you have learned one or two things. If you like this post, please subscribe to stay updated with new posts, and if you have a thought or a question, I would love to hear it by commenting below. Remember, practice makes perfect! Keep on learning!</p>]]></content><author><name>Stern Semasuka</name></author><category term="python" /><category term="machine learning" /><category term="tutorial" /><category term="linear regression" /><summary type="html"><![CDATA[Welcome back! I am very excited about this post as we are introducing machine learning and its commonly used jargon. You will have a broad overview of machine learning, how it works, and even write our first machine learning code at the end of the post. To understand advanced machine learning, we first need to have a good grasp of the fundamentals. That is why I think this is the most important post on this blog so far.]]></summary><media:thumbnail xmlns:media="http://search.yahoo.com/mrss/" url="https://semasuka.github.io/blog/blog/assets/post_images/demystify.jpg" /><media:content medium="image" url="https://semasuka.github.io/blog/blog/assets/post_images/demystify.jpg" xmlns:media="http://search.yahoo.com/mrss/" /></entry><entry><title type="html">Pandas Exercises Part 3</title><link href="https://semasuka.github.io/blog/blog/2021/01/25/pandas-exercise-part-3.html" rel="alternate" type="text/html" title="Pandas Exercises Part 3" /><published>2021-01-25T00:00:00+00:00</published><updated>2021-01-25T00:00:00+00:00</updated><id>https://semasuka.github.io/blog/blog/2021/01/25/pandas-exercise-part-3</id><content type="html" xml:base="https://semasuka.github.io/blog/blog/2021/01/25/pandas-exercise-part-3.html"><![CDATA[<p>Great to see you again here! In this last post of the Pandas series, we will continue exploring advanced DataFrame exercises. Pandas is easer to learn than NumPy, in my opinion. Its documentation is well written, so don’t be shy! Read its documentation throughout if you get stuck <a href="https://pandas.pydata.org/pandas-docs/stable/index.html" target="_blank">here</a>.<!-- more --></p>

<p>Let’s get started by importing NumPy and Pandas.</p>

<div class="language-python highlighter-rouge"><div class="highlight"><pre class="highlight"><code><span class="kn">import</span> <span class="nn">numpy</span> <span class="k">as</span> <span class="n">np</span>
<span class="kn">import</span> <span class="nn">pandas</span> <span class="k">as</span> <span class="n">pd</span> 
</code></pre></div></div>

<h3>Ex 51: How to get the row number of the nth largest value in a column?</h3>

<p>Q: Find the row position of the 5th largest value of column <code class="language-plaintext highlighter-rouge">a</code> of <code class="language-plaintext highlighter-rouge">the_dataframe</code>.</p>

<div class="language-python highlighter-rouge"><div class="highlight"><pre class="highlight"><code><span class="kn">from</span> <span class="nn">numpy.random</span> <span class="kn">import</span> <span class="n">default_rng</span>
<span class="n">np</span><span class="p">.</span><span class="n">random</span><span class="p">.</span><span class="n">seed</span><span class="p">(</span><span class="mi">42</span><span class="p">)</span>
<span class="n">rng</span> <span class="o">=</span> <span class="n">default_rng</span><span class="p">()</span>
<span class="n">the_dataframe</span> <span class="o">=</span> <span class="n">pd</span><span class="p">.</span><span class="n">DataFrame</span><span class="p">(</span><span class="n">rng</span><span class="p">.</span><span class="n">choice</span><span class="p">(</span><span class="mi">30</span><span class="p">,</span> <span class="n">size</span><span class="o">=</span><span class="mi">30</span><span class="p">,</span> <span class="n">replace</span><span class="o">=</span><span class="bp">False</span><span class="p">).</span><span class="n">reshape</span><span class="p">(</span><span class="mi">10</span><span class="p">,</span><span class="o">-</span><span class="mi">1</span><span class="p">),</span> <span class="n">columns</span><span class="o">=</span><span class="nb">list</span><span class="p">(</span><span class="s">'abc'</span><span class="p">))</span>
</code></pre></div></div>

<div class="language-python highlighter-rouge"><div class="highlight"><pre class="highlight"><code><span class="n">the_dataframe</span>
</code></pre></div></div>

<div>
<style scoped="">
    .dataframe tbody tr th:only-of-type {
        vertical-align: middle;
    }

    .dataframe tbody tr th {
        vertical-align: top;
    }

    .dataframe thead th {
        text-align: right;
    }
</style>
<table border="1" class="dataframe">
  <thead>
    <tr style="text-align: right;">
      <th></th>
      <th>a</th>
      <th>b</th>
      <th>c</th>
    </tr>
  </thead>
  <tbody>
    <tr>
      <th>0</th>
      <td>16</td>
      <td>11</td>
      <td>9</td>
    </tr>
    <tr>
      <th>1</th>
      <td>25</td>
      <td>22</td>
      <td>15</td>
    </tr>
    <tr>
      <th>2</th>
      <td>1</td>
      <td>18</td>
      <td>8</td>
    </tr>
    <tr>
      <th>3</th>
      <td>27</td>
      <td>12</td>
      <td>3</td>
    </tr>
    <tr>
      <th>4</th>
      <td>19</td>
      <td>17</td>
      <td>20</td>
    </tr>
    <tr>
      <th>5</th>
      <td>0</td>
      <td>24</td>
      <td>28</td>
    </tr>
    <tr>
      <th>6</th>
      <td>23</td>
      <td>13</td>
      <td>21</td>
    </tr>
    <tr>
      <th>7</th>
      <td>29</td>
      <td>5</td>
      <td>2</td>
    </tr>
    <tr>
      <th>8</th>
      <td>7</td>
      <td>10</td>
      <td>26</td>
    </tr>
    <tr>
      <th>9</th>
      <td>6</td>
      <td>14</td>
      <td>4</td>
    </tr>
  </tbody>
</table>
</div>

<p>Note: We import and use <code class="language-plaintext highlighter-rouge">default_rng</code> to generated no duplicate values in the DataFrame and use <code class="language-plaintext highlighter-rouge">random.seed</code> to always generate the same numbers even on a different computer.</p>

<h4>Desired out</h4>

<div class="language-python highlighter-rouge"><div class="highlight"><pre class="highlight"><code><span class="c1"># The row with the 5th largest number is 6
</span></code></pre></div></div>

<h4>1st Method</h4>

<div class="language-python highlighter-rouge"><div class="highlight"><pre class="highlight"><code><span class="n">row_fifth_largest_num</span> <span class="o">=</span> <span class="n">the_dataframe</span><span class="p">[</span><span class="s">"a"</span><span class="p">].</span><span class="n">sort_values</span><span class="p">(</span><span class="nb">reversed</span><span class="p">)[::</span><span class="o">-</span><span class="mi">1</span><span class="p">].</span><span class="n">index</span><span class="p">[</span><span class="mi">4</span><span class="p">]</span>
</code></pre></div></div>

<div class="language-python highlighter-rouge"><div class="highlight"><pre class="highlight"><code><span class="k">print</span><span class="p">(</span><span class="s">"The row with the 5th largest number is {}"</span><span class="p">.</span><span class="nb">format</span><span class="p">(</span><span class="n">row_fifth_largest_num</span><span class="p">))</span>
</code></pre></div></div>

<div class="language-plaintext highlighter-rouge"><div class="highlight"><pre class="highlight"><code>The row with the 5th largest number is 6
</code></pre></div></div>

<p>We first sort the values in column <code class="language-plaintext highlighter-rouge">a</code>, and then reverse it. To get the index(the row number) of the 5th position, we pass in 4 in the <code class="language-plaintext highlighter-rouge">index</code> (indexes start from 0).</p>

<h4>2nd Method</h4>

<div class="language-python highlighter-rouge"><div class="highlight"><pre class="highlight"><code><span class="n">row_fifth_largest_num</span> <span class="o">=</span> <span class="n">the_dataframe</span><span class="p">[</span><span class="s">"a"</span><span class="p">].</span><span class="n">argsort</span><span class="p">()[::</span><span class="o">-</span><span class="mi">1</span><span class="p">][</span><span class="mi">5</span><span class="p">]</span>
</code></pre></div></div>

<div class="language-python highlighter-rouge"><div class="highlight"><pre class="highlight"><code><span class="k">print</span><span class="p">(</span><span class="s">"The row with the 5th largest number is {}"</span><span class="p">.</span><span class="nb">format</span><span class="p">(</span><span class="n">row_fifth_largest_num</span><span class="p">))</span>
</code></pre></div></div>

<div class="language-plaintext highlighter-rouge"><div class="highlight"><pre class="highlight"><code>The row with the 5th largest number is 6
</code></pre></div></div>

<p>Another way is by using <code class="language-plaintext highlighter-rouge">argsort</code> which will return sorted indexes according to the values in those indexes. Then we reverse those indexes using <code class="language-plaintext highlighter-rouge">[::1]</code> and get the fifth element using <code class="language-plaintext highlighter-rouge">[5]</code>.</p>

<h3>Ex 52: How to find the position of the nth largest value greater than a given value?</h3>

<p>Q: In <code class="language-plaintext highlighter-rouge">the_serie</code> find the position of the 2nd largest value greater than the mean.</p>

<div class="language-python highlighter-rouge"><div class="highlight"><pre class="highlight"><code><span class="n">np</span><span class="p">.</span><span class="n">random</span><span class="p">.</span><span class="n">seed</span><span class="p">(</span><span class="mi">42</span><span class="p">)</span>
<span class="n">the_serie</span> <span class="o">=</span> <span class="n">pd</span><span class="p">.</span><span class="n">Series</span><span class="p">(</span><span class="n">np</span><span class="p">.</span><span class="n">random</span><span class="p">.</span><span class="n">randint</span><span class="p">(</span><span class="mi">1</span><span class="p">,</span> <span class="mi">100</span><span class="p">,</span> <span class="mi">15</span><span class="p">))</span>
</code></pre></div></div>

<div class="language-python highlighter-rouge"><div class="highlight"><pre class="highlight"><code><span class="n">the_serie</span>
</code></pre></div></div>

<div class="language-plaintext highlighter-rouge"><div class="highlight"><pre class="highlight"><code>0     52
1     93
2     15
3     72
4     61
5     21
6     83
7     87
8     75
9     75
10    88
11    24
12     3
13    22
14    53
dtype: int64
</code></pre></div></div>

<h4>Desired output</h4>

<div class="language-python highlighter-rouge"><div class="highlight"><pre class="highlight"><code><span class="c1"># The mean is 55.0 and the row of the second largest number is 3
</span></code></pre></div></div>

<h4>Solution</h4>

<div class="language-python highlighter-rouge"><div class="highlight"><pre class="highlight"><code><span class="n">the_mean</span> <span class="o">=</span> <span class="n">np</span><span class="p">.</span><span class="n">mean</span><span class="p">(</span><span class="n">the_serie</span><span class="p">.</span><span class="n">values</span><span class="p">).</span><span class="nb">round</span><span class="p">()</span>
</code></pre></div></div>

<div class="language-python highlighter-rouge"><div class="highlight"><pre class="highlight"><code><span class="n">the_mean</span>
</code></pre></div></div>

<div class="language-plaintext highlighter-rouge"><div class="highlight"><pre class="highlight"><code>55.0
</code></pre></div></div>

<div class="language-python highlighter-rouge"><div class="highlight"><pre class="highlight"><code><span class="n">greater_than_mean_arr</span> <span class="o">=</span> <span class="n">the_serie</span><span class="p">.</span><span class="n">where</span><span class="p">(</span><span class="n">the_serie</span> <span class="o">&gt;</span> <span class="n">the_mean</span><span class="p">).</span><span class="n">dropna</span><span class="p">().</span><span class="n">sort_values</span><span class="p">()</span>
</code></pre></div></div>

<div class="language-python highlighter-rouge"><div class="highlight"><pre class="highlight"><code><span class="n">row_second_largest_num</span> <span class="o">=</span> <span class="n">greater_than_mean_arr</span><span class="p">.</span><span class="n">index</span><span class="p">[</span><span class="mi">1</span><span class="p">]</span>
</code></pre></div></div>

<div class="language-python highlighter-rouge"><div class="highlight"><pre class="highlight"><code><span class="n">row_second_largest_num</span>
</code></pre></div></div>

<div class="language-plaintext highlighter-rouge"><div class="highlight"><pre class="highlight"><code>3
</code></pre></div></div>

<div class="language-python highlighter-rouge"><div class="highlight"><pre class="highlight"><code><span class="k">print</span><span class="p">(</span><span class="s">"The mean is {} and the row of the second largest number is {}"</span><span class="p">.</span><span class="nb">format</span><span class="p">(</span><span class="n">the_mean</span><span class="p">,</span> <span class="n">row_second_largest_num</span><span class="p">))</span>
</code></pre></div></div>

<div class="language-plaintext highlighter-rouge"><div class="highlight"><pre class="highlight"><code>The mean is 55.0 and the row of the second largest number is 3
</code></pre></div></div>

<p>We start by calculating the mean of the values in the series using <code class="language-plaintext highlighter-rouge">np.mean</code> and round it. Then we use <code class="language-plaintext highlighter-rouge">where</code> to get all rows with the values superior to the mean.</p>

<p>We drop NaN values (which are values inferior to the mean) and sort the remaining values to finally get the second value in the sorted series using <code class="language-plaintext highlighter-rouge">.index[1]</code> which correspond to the second largest number superior to the mean.</p>

<h3>Ex 53: How to get the last n rows of a DataFrame with row sum &gt; 100?</h3>

<p>Q: Get the last two rows of <code class="language-plaintext highlighter-rouge">the_dataframe</code> whose row sum is superior to 100.</p>

<div class="language-python highlighter-rouge"><div class="highlight"><pre class="highlight"><code><span class="n">np</span><span class="p">.</span><span class="n">random</span><span class="p">.</span><span class="n">seed</span><span class="p">(</span><span class="mi">42</span><span class="p">)</span>
<span class="n">the_dataframe</span> <span class="o">=</span> <span class="n">pd</span><span class="p">.</span><span class="n">DataFrame</span><span class="p">(</span><span class="n">np</span><span class="p">.</span><span class="n">random</span><span class="p">.</span><span class="n">randint</span><span class="p">(</span><span class="mi">10</span><span class="p">,</span> <span class="mi">40</span><span class="p">,</span> <span class="mi">60</span><span class="p">).</span><span class="n">reshape</span><span class="p">(</span><span class="o">-</span><span class="mi">1</span><span class="p">,</span> <span class="mi">4</span><span class="p">))</span>
</code></pre></div></div>

<div class="language-python highlighter-rouge"><div class="highlight"><pre class="highlight"><code><span class="n">the_dataframe</span>
</code></pre></div></div>

<div>
<style scoped="">
    .dataframe tbody tr th:only-of-type {
        vertical-align: middle;
    }

    .dataframe tbody tr th {
        vertical-align: top;
    }

    .dataframe thead th {
        text-align: right;
    }
</style>
<table border="1" class="dataframe">
  <thead>
    <tr style="text-align: right;">
      <th></th>
      <th>0</th>
      <th>1</th>
      <th>2</th>
      <th>3</th>
    </tr>
  </thead>
  <tbody>
    <tr>
      <th>0</th>
      <td>16</td>
      <td>29</td>
      <td>38</td>
      <td>24</td>
    </tr>
    <tr>
      <th>1</th>
      <td>20</td>
      <td>17</td>
      <td>38</td>
      <td>30</td>
    </tr>
    <tr>
      <th>2</th>
      <td>16</td>
      <td>35</td>
      <td>28</td>
      <td>32</td>
    </tr>
    <tr>
      <th>3</th>
      <td>20</td>
      <td>20</td>
      <td>33</td>
      <td>30</td>
    </tr>
    <tr>
      <th>4</th>
      <td>13</td>
      <td>17</td>
      <td>33</td>
      <td>12</td>
    </tr>
    <tr>
      <th>5</th>
      <td>31</td>
      <td>30</td>
      <td>11</td>
      <td>33</td>
    </tr>
    <tr>
      <th>6</th>
      <td>21</td>
      <td>39</td>
      <td>15</td>
      <td>11</td>
    </tr>
    <tr>
      <th>7</th>
      <td>37</td>
      <td>30</td>
      <td>10</td>
      <td>21</td>
    </tr>
    <tr>
      <th>8</th>
      <td>35</td>
      <td>31</td>
      <td>38</td>
      <td>21</td>
    </tr>
    <tr>
      <th>9</th>
      <td>34</td>
      <td>26</td>
      <td>36</td>
      <td>36</td>
    </tr>
    <tr>
      <th>10</th>
      <td>19</td>
      <td>37</td>
      <td>37</td>
      <td>25</td>
    </tr>
    <tr>
      <th>11</th>
      <td>24</td>
      <td>39</td>
      <td>39</td>
      <td>24</td>
    </tr>
    <tr>
      <th>12</th>
      <td>39</td>
      <td>28</td>
      <td>21</td>
      <td>32</td>
    </tr>
    <tr>
      <th>13</th>
      <td>29</td>
      <td>34</td>
      <td>12</td>
      <td>14</td>
    </tr>
    <tr>
      <th>14</th>
      <td>28</td>
      <td>16</td>
      <td>30</td>
      <td>18</td>
    </tr>
  </tbody>
</table>
</div>

<h4>Desired output</h4>

<p><img src="/blog/assets/post_cont_image/pandas_ex53.png" alt="Pandas_ex53" /></p>

<h4>Solution</h4>

<div class="language-python highlighter-rouge"><div class="highlight"><pre class="highlight"><code><span class="n">rows_sum</span> <span class="o">=</span> <span class="n">the_dataframe</span><span class="p">.</span><span class="nb">sum</span><span class="p">(</span><span class="n">axis</span><span class="o">=</span><span class="mi">1</span><span class="p">).</span><span class="n">sort_values</span><span class="p">()</span>
</code></pre></div></div>

<div class="language-python highlighter-rouge"><div class="highlight"><pre class="highlight"><code><span class="n">rows_sum</span>
</code></pre></div></div>

<div class="language-plaintext highlighter-rouge"><div class="highlight"><pre class="highlight"><code>4      75
6      86
13     89
14     92
7      98
3     103
1     105
5     105
0     107
2     111
10    118
12    120
8     125
11    126
9     132
dtype: int64
</code></pre></div></div>

<div class="language-python highlighter-rouge"><div class="highlight"><pre class="highlight"><code><span class="n">rows_sum_greater_100</span> <span class="o">=</span> <span class="n">rows_sum</span><span class="p">.</span><span class="n">where</span><span class="p">(</span><span class="n">rows_sum</span> <span class="o">&gt;</span> <span class="mi">100</span><span class="p">).</span><span class="n">dropna</span><span class="p">()</span>
<span class="n">rows_sum_greater_100</span>
</code></pre></div></div>

<div class="language-plaintext highlighter-rouge"><div class="highlight"><pre class="highlight"><code>3     103.0
1     105.0
5     105.0
0     107.0
2     111.0
10    118.0
12    120.0
8     125.0
11    126.0
9     132.0
dtype: float64
</code></pre></div></div>

<div class="language-python highlighter-rouge"><div class="highlight"><pre class="highlight"><code><span class="n">the_dataframe</span><span class="p">.</span><span class="n">iloc</span><span class="p">[</span><span class="n">rows_sum_greater_100</span><span class="p">[::</span><span class="o">-</span><span class="mi">1</span><span class="p">][:</span><span class="mi">2</span><span class="p">].</span><span class="n">index</span><span class="p">]</span>
</code></pre></div></div>

<div>
<style scoped="">
    .dataframe tbody tr th:only-of-type {
        vertical-align: middle;
    }

    .dataframe tbody tr th {
        vertical-align: top;
    }

    .dataframe thead th {
        text-align: right;
    }
</style>
<table border="1" class="dataframe">
  <thead>
    <tr style="text-align: right;">
      <th></th>
      <th>0</th>
      <th>1</th>
      <th>2</th>
      <th>3</th>
    </tr>
  </thead>
  <tbody>
    <tr>
      <th>9</th>
      <td>34</td>
      <td>26</td>
      <td>36</td>
      <td>36</td>
    </tr>
    <tr>
      <th>11</th>
      <td>24</td>
      <td>39</td>
      <td>39</td>
      <td>24</td>
    </tr>
  </tbody>
</table>
</div>

<p>We calculate a series with of the sum of all the elements row-wise and sort it. We then use <code class="language-plaintext highlighter-rouge">where</code> function to get only the row with element greater than 100 and drop the rest using <code class="language-plaintext highlighter-rouge">dropna</code> function.</p>

<p>Finally, we reverse that row using <code class="language-plaintext highlighter-rouge">[::-1]</code> and get the indexes first two rows using indexing from 0 to 2 (exclusive). We replace those indexes in the original dataframe to get the two rows using <code class="language-plaintext highlighter-rouge">iloc</code>.</p>

<h3>Ex 54: How to find and cap outliers from a series or DataFrame column?</h3>

<p>Q: Replace all values of <code class="language-plaintext highlighter-rouge">the_serie</code> lower to the 5th percentile and greater than 95th percentile respectively with the 5th and 95th percentile value.</p>

<div class="language-python highlighter-rouge"><div class="highlight"><pre class="highlight"><code><span class="n">the_serie</span> <span class="o">=</span> <span class="n">ser</span> <span class="o">=</span> <span class="n">pd</span><span class="p">.</span><span class="n">Series</span><span class="p">(</span><span class="n">np</span><span class="p">.</span><span class="n">logspace</span><span class="p">(</span><span class="o">-</span><span class="mi">2</span><span class="p">,</span> <span class="mi">2</span><span class="p">,</span> <span class="mi">30</span><span class="p">))</span>
</code></pre></div></div>

<h4>Desired output</h4>

<div class="language-python highlighter-rouge"><div class="highlight"><pre class="highlight"><code><span class="c1"># 0      0.016049
# 1      0.016049
# 2      0.018874
# 3      0.025929
# 4      0.035622
# 5      0.048939
# 6      0.067234
# 7      0.092367
# 8      0.126896
# 9      0.174333
# 10     0.239503
# 11     0.329034
# 12     0.452035
# 13     0.621017
# 14     0.853168
# 15     1.172102
# 16     1.610262
# 17     2.212216
# 18     3.039195
# 19     4.175319
# 20     5.736153
# 21     7.880463
# 22    10.826367
# 23    14.873521
# 24    20.433597
# 25    28.072162
# 26    38.566204
# 27    52.983169
# 28    63.876672
# 29    63.876672
# dtype: float64
</span></code></pre></div></div>

<h4>Solution</h4>

<div class="language-python highlighter-rouge"><div class="highlight"><pre class="highlight"><code><span class="n">low_perc</span> <span class="o">=</span> <span class="n">the_serie</span><span class="p">.</span><span class="n">quantile</span><span class="p">(</span><span class="n">q</span><span class="o">=</span><span class="mf">0.05</span><span class="p">)</span>
<span class="n">low_perc</span>
</code></pre></div></div>

<div class="language-plaintext highlighter-rouge"><div class="highlight"><pre class="highlight"><code>0.016049294076965887
</code></pre></div></div>

<div class="language-python highlighter-rouge"><div class="highlight"><pre class="highlight"><code><span class="n">high_perc</span> <span class="o">=</span> <span class="n">the_serie</span><span class="p">.</span><span class="n">quantile</span><span class="p">(</span><span class="n">q</span><span class="o">=</span><span class="mf">0.95</span><span class="p">)</span>
<span class="n">high_perc</span>
</code></pre></div></div>

<div class="language-plaintext highlighter-rouge"><div class="highlight"><pre class="highlight"><code>63.876672220183934
</code></pre></div></div>

<div class="language-python highlighter-rouge"><div class="highlight"><pre class="highlight"><code><span class="n">the_serie</span><span class="p">.</span><span class="n">where</span><span class="p">(</span><span class="n">the_serie</span> <span class="o">&gt;</span> <span class="n">low_perc</span><span class="p">,</span> <span class="n">other</span><span class="o">=</span><span class="n">low_perc</span><span class="p">,</span> <span class="n">inplace</span><span class="o">=</span><span class="bp">True</span><span class="p">)</span> 
</code></pre></div></div>

<div class="language-python highlighter-rouge"><div class="highlight"><pre class="highlight"><code><span class="n">the_serie</span><span class="p">.</span><span class="n">where</span><span class="p">(</span><span class="n">the_serie</span> <span class="o">&lt;</span> <span class="n">high_perc</span><span class="p">,</span> <span class="n">other</span><span class="o">=</span><span class="n">high_perc</span><span class="p">,</span> <span class="n">inplace</span><span class="o">=</span><span class="bp">True</span><span class="p">)</span> 
</code></pre></div></div>

<div class="language-python highlighter-rouge"><div class="highlight"><pre class="highlight"><code><span class="n">the_serie</span>
</code></pre></div></div>

<div class="language-plaintext highlighter-rouge"><div class="highlight"><pre class="highlight"><code>0      0.016049
1      0.016049
2      0.018874
3      0.025929
4      0.035622
5      0.048939
6      0.067234
7      0.092367
8      0.126896
9      0.174333
10     0.239503
11     0.329034
12     0.452035
13     0.621017
14     0.853168
15     1.172102
16     1.610262
17     2.212216
18     3.039195
19     4.175319
20     5.736153
21     7.880463
22    10.826367
23    14.873521
24    20.433597
25    28.072162
26    38.566204
27    52.983169
28    63.876672
29    63.876672
dtype: float64
</code></pre></div></div>

<p>We first calculate the 5th and the 95th percentile using the <code class="language-plaintext highlighter-rouge">quantile</code> function and pass in <code class="language-plaintext highlighter-rouge">q</code> the number 0.05 and 0.95 respectively. Then we call the <code class="language-plaintext highlighter-rouge">where</code> function on the original series, pass in the condition as <code class="language-plaintext highlighter-rouge">the_serie &gt; low_perc</code>.</p>

<p>This condition will target the elements superior to the 5th percentile and set <code class="language-plaintext highlighter-rouge">other</code> which is the remaining element (inferior to the 5th percentile) to be the 5th percentile. The assignment will replace all the values in the series lower than the 5th percentile by the 5th percentile value. Finally, we set <code class="language-plaintext highlighter-rouge">inplace</code> to <code class="language-plaintext highlighter-rouge">True</code>.</p>

<p>We do the same for the 95th percentile, just that this time we are targeting elements inferior to the 95th percentile and set <code class="language-plaintext highlighter-rouge">other</code> to the value of the 95th percentile.</p>

<h3>Ex 55: How to reshape a DataFrame to the largest possible square after removing the negative values?</h3>

<p>Q: Reshape <code class="language-plaintext highlighter-rouge">the_dataframe</code> to the largest possible square with negative values removed. Drop the smallest values if need be. The order of the positive numbers in the result should remain the same as the original.</p>

<div class="language-python highlighter-rouge"><div class="highlight"><pre class="highlight"><code><span class="n">np</span><span class="p">.</span><span class="n">random</span><span class="p">.</span><span class="n">seed</span><span class="p">(</span><span class="mi">42</span><span class="p">)</span>
<span class="n">the_dataframe</span> <span class="o">=</span> <span class="n">pd</span><span class="p">.</span><span class="n">DataFrame</span><span class="p">(</span><span class="n">np</span><span class="p">.</span><span class="n">random</span><span class="p">.</span><span class="n">randint</span><span class="p">(</span><span class="o">-</span><span class="mi">20</span><span class="p">,</span> <span class="mi">50</span><span class="p">,</span> <span class="mi">100</span><span class="p">).</span><span class="n">reshape</span><span class="p">(</span><span class="mi">10</span><span class="p">,</span><span class="o">-</span><span class="mi">1</span><span class="p">))</span>
<span class="n">the_dataframe</span>
</code></pre></div></div>

<div>
<style scoped="">
    .dataframe tbody tr th:only-of-type {
        vertical-align: middle;
    }

    .dataframe tbody tr th {
        vertical-align: top;
    }

    .dataframe thead th {
        text-align: right;
    }
</style>
<table border="1" class="dataframe">
  <thead>
    <tr style="text-align: right;">
      <th></th>
      <th>0</th>
      <th>1</th>
      <th>2</th>
      <th>3</th>
      <th>4</th>
      <th>5</th>
      <th>6</th>
      <th>7</th>
      <th>8</th>
      <th>9</th>
    </tr>
  </thead>
  <tbody>
    <tr>
      <th>0</th>
      <td>31</td>
      <td>-6</td>
      <td>40</td>
      <td>0</td>
      <td>3</td>
      <td>-18</td>
      <td>1</td>
      <td>32</td>
      <td>-19</td>
      <td>9</td>
    </tr>
    <tr>
      <th>1</th>
      <td>17</td>
      <td>-19</td>
      <td>43</td>
      <td>39</td>
      <td>0</td>
      <td>12</td>
      <td>37</td>
      <td>1</td>
      <td>28</td>
      <td>38</td>
    </tr>
    <tr>
      <th>2</th>
      <td>21</td>
      <td>39</td>
      <td>-6</td>
      <td>41</td>
      <td>41</td>
      <td>26</td>
      <td>41</td>
      <td>30</td>
      <td>34</td>
      <td>43</td>
    </tr>
    <tr>
      <th>3</th>
      <td>-18</td>
      <td>30</td>
      <td>-14</td>
      <td>0</td>
      <td>18</td>
      <td>-3</td>
      <td>-17</td>
      <td>39</td>
      <td>-7</td>
      <td>-12</td>
    </tr>
    <tr>
      <th>4</th>
      <td>32</td>
      <td>-19</td>
      <td>39</td>
      <td>23</td>
      <td>-13</td>
      <td>26</td>
      <td>14</td>
      <td>15</td>
      <td>29</td>
      <td>-17</td>
    </tr>
    <tr>
      <th>5</th>
      <td>-19</td>
      <td>-15</td>
      <td>33</td>
      <td>-17</td>
      <td>33</td>
      <td>42</td>
      <td>-3</td>
      <td>23</td>
      <td>13</td>
      <td>41</td>
    </tr>
    <tr>
      <th>6</th>
      <td>-7</td>
      <td>27</td>
      <td>-6</td>
      <td>41</td>
      <td>19</td>
      <td>32</td>
      <td>3</td>
      <td>5</td>
      <td>39</td>
      <td>20</td>
    </tr>
    <tr>
      <th>7</th>
      <td>8</td>
      <td>-6</td>
      <td>24</td>
      <td>44</td>
      <td>-12</td>
      <td>-20</td>
      <td>-13</td>
      <td>42</td>
      <td>-10</td>
      <td>-13</td>
    </tr>
    <tr>
      <th>8</th>
      <td>14</td>
      <td>14</td>
      <td>12</td>
      <td>-16</td>
      <td>20</td>
      <td>7</td>
      <td>-14</td>
      <td>-9</td>
      <td>13</td>
      <td>12</td>
    </tr>
    <tr>
      <th>9</th>
      <td>27</td>
      <td>2</td>
      <td>41</td>
      <td>16</td>
      <td>23</td>
      <td>14</td>
      <td>44</td>
      <td>26</td>
      <td>-18</td>
      <td>-20</td>
    </tr>
  </tbody>
</table>
</div>

<h4>Desired output</h4>

<div class="language-python highlighter-rouge"><div class="highlight"><pre class="highlight"><code><span class="c1"># array([[31., 40.,  3., 32.,  9., 17., 43., 39.],
#        [12., 37., 28., 38., 21., 39., 41., 41.],
#        [26., 41., 30., 34., 43., 30., 18., 39.],
#        [32., 39., 23., 26., 14., 15., 29., 33.],
#        [33., 42., 23., 13., 41., 27., 41., 19.],
#        [32.,  3.,  5., 39., 20.,  8., 24., 44.],
#        [42., 14., 14., 12., 20.,  7., 13., 12.],
#        [27.,  2., 41., 16., 23., 14., 44., 26.]])
</span></code></pre></div></div>

<h4>Solution</h4>

<h4>Step 1: Remove the negatives</h4>

<div class="language-python highlighter-rouge"><div class="highlight"><pre class="highlight"><code><span class="n">the_arr</span> <span class="o">=</span> <span class="n">the_dataframe</span><span class="p">[</span><span class="n">the_dataframe</span> <span class="o">&gt;</span> <span class="mi">0</span><span class="p">].</span><span class="n">values</span><span class="p">.</span><span class="n">flatten</span><span class="p">()</span>
<span class="n">the_arr</span>
</code></pre></div></div>

<div class="language-plaintext highlighter-rouge"><div class="highlight"><pre class="highlight"><code>array([31., nan, 40., nan,  3., nan,  1., 32., nan,  9., 17., nan, 43.,
       39., nan, 12., 37.,  1., 28., 38., 21., 39., nan, 41., 41., 26.,
       41., 30., 34., 43., nan, 30., nan, nan, 18., nan, nan, 39., nan,
       nan, 32., nan, 39., 23., nan, 26., 14., 15., 29., nan, nan, nan,
       33., nan, 33., 42., nan, 23., 13., 41., nan, 27., nan, 41., 19.,
       32.,  3.,  5., 39., 20.,  8., nan, 24., 44., nan, nan, nan, 42.,
       nan, nan, 14., 14., 12., nan, 20.,  7., nan, nan, 13., 12., 27.,
        2., 41., 16., 23., 14., 44., 26., nan, nan])
</code></pre></div></div>

<p>We use indexing with <code class="language-plaintext highlighter-rouge">[]</code> to get all the positive elements in <code class="language-plaintext highlighter-rouge">the_dataframe</code> and reshaped them into a 1D array using <code class="language-plaintext highlighter-rouge">flatten()</code> function to finally store it into <code class="language-plaintext highlighter-rouge">the_arr</code>.</p>

<div class="language-python highlighter-rouge"><div class="highlight"><pre class="highlight"><code><span class="n">pos_arr</span> <span class="o">=</span> <span class="n">the_arr</span><span class="p">[</span><span class="o">~</span><span class="n">np</span><span class="p">.</span><span class="n">isnan</span><span class="p">(</span><span class="n">the_arr</span><span class="p">)]</span>
</code></pre></div></div>

<div class="language-python highlighter-rouge"><div class="highlight"><pre class="highlight"><code><span class="n">np</span><span class="p">.</span><span class="n">isnan</span><span class="p">(</span><span class="n">the_arr</span><span class="p">)</span>
</code></pre></div></div>

<div class="language-plaintext highlighter-rouge"><div class="highlight"><pre class="highlight"><code>array([False,  True, False,  True, False,  True, False, False,  True,
       False, False,  True, False, False,  True, False, False, False,
       False, False, False, False,  True, False, False, False, False,
       False, False, False,  True, False,  True,  True, False,  True,
        True, False,  True,  True, False,  True, False, False,  True,
       False, False, False, False,  True,  True,  True, False,  True,
       False, False,  True, False, False, False,  True, False,  True,
       False, False, False, False, False, False, False, False,  True,
       False, False,  True,  True,  True, False,  True,  True, False,
       False, False,  True, False, False,  True,  True, False, False,
       False, False, False, False, False, False, False, False,  True,
        True])
</code></pre></div></div>

<div class="language-python highlighter-rouge"><div class="highlight"><pre class="highlight"><code><span class="n">pos_arr</span>
</code></pre></div></div>

<div class="language-plaintext highlighter-rouge"><div class="highlight"><pre class="highlight"><code>array([31., 40.,  3.,  1., 32.,  9., 17., 43., 39., 12., 37.,  1., 28.,
       38., 21., 39., 41., 41., 26., 41., 30., 34., 43., 30., 18., 39.,
       32., 39., 23., 26., 14., 15., 29., 33., 33., 42., 23., 13., 41.,
       27., 41., 19., 32.,  3.,  5., 39., 20.,  8., 24., 44., 42., 14.,
       14., 12., 20.,  7., 13., 12., 27.,  2., 41., 16., 23., 14., 44.,
       26.])
</code></pre></div></div>

<p>To drop the <code class="language-plaintext highlighter-rouge">nan</code> in the array, we use indexing and <code class="language-plaintext highlighter-rouge">isnan</code> function to return a boolean array where <code class="language-plaintext highlighter-rouge">False</code> represent a non <code class="language-plaintext highlighter-rouge">nan</code> value and <code class="language-plaintext highlighter-rouge">True</code> is a position of a <code class="language-plaintext highlighter-rouge">nan</code> value. We then <code class="language-plaintext highlighter-rouge">~</code> sign to inverse the boolean to get <code class="language-plaintext highlighter-rouge">True</code> in where there is non <code class="language-plaintext highlighter-rouge">nan</code> value. Now we get a new array with no <code class="language-plaintext highlighter-rouge">nan</code> values.</p>

<h4>Step 2: Find side-length of largest possible square</h4>

<div class="language-python highlighter-rouge"><div class="highlight"><pre class="highlight"><code><span class="nb">len</span><span class="p">(</span><span class="n">pos_arr</span><span class="p">)</span>
</code></pre></div></div>

<div class="language-plaintext highlighter-rouge"><div class="highlight"><pre class="highlight"><code>66
</code></pre></div></div>

<div class="language-python highlighter-rouge"><div class="highlight"><pre class="highlight"><code><span class="n">n</span> <span class="o">=</span> <span class="nb">int</span><span class="p">(</span><span class="n">np</span><span class="p">.</span><span class="n">floor</span><span class="p">(</span><span class="n">np</span><span class="p">.</span><span class="n">sqrt</span><span class="p">(</span><span class="n">pos_arr</span><span class="p">.</span><span class="n">shape</span><span class="p">[</span><span class="mi">0</span><span class="p">])))</span>
</code></pre></div></div>

<div class="language-python highlighter-rouge"><div class="highlight"><pre class="highlight"><code><span class="n">n</span>
</code></pre></div></div>

<div class="language-plaintext highlighter-rouge"><div class="highlight"><pre class="highlight"><code>8
</code></pre></div></div>

<p>To search for the largest possible square, we get first the length of the array using <code class="language-plaintext highlighter-rouge">shape</code> function (we could also use <code class="language-plaintext highlighter-rouge">len()</code> function). We then find the square root of the number of elements in the array and remove the decimal using <code class="language-plaintext highlighter-rouge">floor</code> function cast it to an integer.</p>

<h4>Step 3: Take top n^2 items without changing positions</h4>

<div class="language-python highlighter-rouge"><div class="highlight"><pre class="highlight"><code><span class="n">top_indexes</span> <span class="o">=</span> <span class="n">np</span><span class="p">.</span><span class="n">argsort</span><span class="p">(</span><span class="n">pos_arr</span><span class="p">)[::</span><span class="o">-</span><span class="mi">1</span><span class="p">]</span>
</code></pre></div></div>

<div class="language-python highlighter-rouge"><div class="highlight"><pre class="highlight"><code><span class="n">top_indexes</span>
</code></pre></div></div>

<div class="language-plaintext highlighter-rouge"><div class="highlight"><pre class="highlight"><code>array([64, 49, 22,  7, 50, 35, 16, 40, 19, 17, 60, 38,  1, 15, 27,  8, 25,
       45, 13, 10, 21, 33, 34, 42, 26,  4,  0, 23, 20, 32, 12, 39, 58, 65,
       29, 18, 48, 62, 36, 28, 14, 54, 46, 41, 24,  6, 61, 31, 63, 51, 52,
       30, 37, 56,  9, 57, 53,  5, 47, 55, 44, 43,  2, 59, 11,  3])
</code></pre></div></div>

<div class="language-python highlighter-rouge"><div class="highlight"><pre class="highlight"><code><span class="n">np</span><span class="p">.</span><span class="n">take</span><span class="p">(</span><span class="n">pos_arr</span><span class="p">,</span> <span class="nb">sorted</span><span class="p">(</span><span class="n">top_indexes</span><span class="p">[:</span><span class="n">n</span><span class="o">**</span><span class="mi">2</span><span class="p">])).</span><span class="n">reshape</span><span class="p">(</span><span class="n">n</span><span class="p">,</span><span class="o">-</span><span class="mi">1</span><span class="p">)</span>
</code></pre></div></div>

<div class="language-plaintext highlighter-rouge"><div class="highlight"><pre class="highlight"><code>array([[31., 40.,  3., 32.,  9., 17., 43., 39.],
       [12., 37., 28., 38., 21., 39., 41., 41.],
       [26., 41., 30., 34., 43., 30., 18., 39.],
       [32., 39., 23., 26., 14., 15., 29., 33.],
       [33., 42., 23., 13., 41., 27., 41., 19.],
       [32.,  3.,  5., 39., 20.,  8., 24., 44.],
       [42., 14., 14., 12., 20.,  7., 13., 12.],
       [27.,  2., 41., 16., 23., 14., 44., 26.]])
</code></pre></div></div>

<p>We then sort the element indexes using <code class="language-plaintext highlighter-rouge">argsort</code> and reverse the order into a descending order using slicing <code class="language-plaintext highlighter-rouge">[::-1]</code> and store it in <code class="language-plaintext highlighter-rouge">top_indexes</code>.</p>

<p>Finally, we use <code class="language-plaintext highlighter-rouge">take</code> NumPy function that takes the <code class="language-plaintext highlighter-rouge">pos_arr</code> and as indices the sorted <code class="language-plaintext highlighter-rouge">top_indexes</code> (from the first indices up to <code class="language-plaintext highlighter-rouge">n</code> raised to the power of 2). Then we reshape the array using <code class="language-plaintext highlighter-rouge">(n,-1)</code> to let Pandas figure out the best reshape argument to use depending on <code class="language-plaintext highlighter-rouge">n</code> value.</p>

<h3>Ex 56: How to swap two rows of a DataFrame?</h3>

<p>Q: Swap rows 1 and 2 in <code class="language-plaintext highlighter-rouge">the_dataframe</code></p>

<div class="language-python highlighter-rouge"><div class="highlight"><pre class="highlight"><code><span class="n">the_dataframe</span> <span class="o">=</span> <span class="n">pd</span><span class="p">.</span><span class="n">DataFrame</span><span class="p">(</span><span class="n">np</span><span class="p">.</span><span class="n">arange</span><span class="p">(</span><span class="mi">25</span><span class="p">).</span><span class="n">reshape</span><span class="p">(</span><span class="mi">5</span><span class="p">,</span> <span class="o">-</span><span class="mi">1</span><span class="p">))</span>
</code></pre></div></div>

<div class="language-python highlighter-rouge"><div class="highlight"><pre class="highlight"><code><span class="n">the_dataframe</span>
</code></pre></div></div>

<div>
<style scoped="">
    .dataframe tbody tr th:only-of-type {
        vertical-align: middle;
    }

    .dataframe tbody tr th {
        vertical-align: top;
    }

    .dataframe thead th {
        text-align: right;
    }
</style>
<table border="1" class="dataframe">
  <thead>
    <tr style="text-align: right;">
      <th></th>
      <th>0</th>
      <th>1</th>
      <th>2</th>
      <th>3</th>
      <th>4</th>
    </tr>
  </thead>
  <tbody>
    <tr>
      <th>0</th>
      <td>0</td>
      <td>1</td>
      <td>2</td>
      <td>3</td>
      <td>4</td>
    </tr>
    <tr>
      <th>1</th>
      <td>5</td>
      <td>6</td>
      <td>7</td>
      <td>8</td>
      <td>9</td>
    </tr>
    <tr>
      <th>2</th>
      <td>10</td>
      <td>11</td>
      <td>12</td>
      <td>13</td>
      <td>14</td>
    </tr>
    <tr>
      <th>3</th>
      <td>15</td>
      <td>16</td>
      <td>17</td>
      <td>18</td>
      <td>19</td>
    </tr>
    <tr>
      <th>4</th>
      <td>20</td>
      <td>21</td>
      <td>22</td>
      <td>23</td>
      <td>24</td>
    </tr>
  </tbody>
</table>
</div>

<h4>Desired solution</h4>

<p><img src="/blog/assets/post_cont_image/pandas_ex56.png" alt="Pandas_ex56" /></p>

<h4>Solution</h4>

<div class="language-python highlighter-rouge"><div class="highlight"><pre class="highlight"><code><span class="k">def</span> <span class="nf">row_swap</span><span class="p">(</span><span class="n">the_dataframe</span><span class="p">,</span><span class="n">row_index_1</span><span class="p">,</span><span class="n">row_index_2</span><span class="p">):</span>
    <span class="n">row_1</span><span class="p">,</span> <span class="n">row_2</span> <span class="o">=</span> <span class="n">the_dataframe</span><span class="p">.</span><span class="n">iloc</span><span class="p">[</span><span class="n">row_index_1</span><span class="p">,:].</span><span class="n">copy</span><span class="p">(),</span> <span class="n">the_dataframe</span><span class="p">.</span><span class="n">iloc</span><span class="p">[</span><span class="n">row_index_2</span><span class="p">,:].</span><span class="n">copy</span><span class="p">()</span>
    <span class="n">the_dataframe</span><span class="p">.</span><span class="n">iloc</span><span class="p">[</span><span class="n">row_index_1</span><span class="p">,:],</span> <span class="n">the_dataframe</span><span class="p">.</span><span class="n">iloc</span><span class="p">[</span><span class="n">row_index_2</span><span class="p">,:]</span> <span class="o">=</span> <span class="n">row_2</span><span class="p">,</span> <span class="n">row_1</span>
    <span class="k">return</span> <span class="n">the_dataframe</span>
</code></pre></div></div>

<div class="language-python highlighter-rouge"><div class="highlight"><pre class="highlight"><code><span class="n">row_swap</span><span class="p">(</span><span class="n">the_dataframe</span><span class="p">,</span><span class="mi">0</span><span class="p">,</span><span class="mi">1</span><span class="p">)</span>
</code></pre></div></div>

<div>
<style scoped="">
    .dataframe tbody tr th:only-of-type {
        vertical-align: middle;
    }

    .dataframe tbody tr th {
        vertical-align: top;
    }

    .dataframe thead th {
        text-align: right;
    }
</style>
<table border="1" class="dataframe">
  <thead>
    <tr style="text-align: right;">
      <th></th>
      <th>0</th>
      <th>1</th>
      <th>2</th>
      <th>3</th>
      <th>4</th>
    </tr>
  </thead>
  <tbody>
    <tr>
      <th>0</th>
      <td>5</td>
      <td>6</td>
      <td>7</td>
      <td>8</td>
      <td>9</td>
    </tr>
    <tr>
      <th>1</th>
      <td>0</td>
      <td>1</td>
      <td>2</td>
      <td>3</td>
      <td>4</td>
    </tr>
    <tr>
      <th>2</th>
      <td>10</td>
      <td>11</td>
      <td>12</td>
      <td>13</td>
      <td>14</td>
    </tr>
    <tr>
      <th>3</th>
      <td>15</td>
      <td>16</td>
      <td>17</td>
      <td>18</td>
      <td>19</td>
    </tr>
    <tr>
      <th>4</th>
      <td>20</td>
      <td>21</td>
      <td>22</td>
      <td>23</td>
      <td>24</td>
    </tr>
  </tbody>
</table>
</div>

<p>We create a function that performs the swap it takes in the dataframe and the two indexes of the rows that need to be swap. We then copy the rows using <code class="language-plaintext highlighter-rouge">iloc</code> and store them in <code class="language-plaintext highlighter-rouge">row_1</code> and <code class="language-plaintext highlighter-rouge">row_2</code>.</p>

<p>To do the swap, we do the opposite of what we did by assigning <code class="language-plaintext highlighter-rouge">row_1</code> and <code class="language-plaintext highlighter-rouge">row_2</code> to the equivalent row index we want to change to occur. So <code class="language-plaintext highlighter-rouge">row_2</code> will be assigned to <code class="language-plaintext highlighter-rouge">row_index_1</code> and <code class="language-plaintext highlighter-rouge">row_1</code> will be assigned to <code class="language-plaintext highlighter-rouge">row_index_2</code>. Finally, we return <code class="language-plaintext highlighter-rouge">the_dataframe</code>.</p>

<h3>Ex 57: How to reverse the rows of a DataFrame?</h3>

<p>Q: Reverse all the rows of a DataFrame.</p>

<div class="language-python highlighter-rouge"><div class="highlight"><pre class="highlight"><code><span class="n">the_dataframe</span> <span class="o">=</span> <span class="n">pd</span><span class="p">.</span><span class="n">DataFrame</span><span class="p">(</span><span class="n">np</span><span class="p">.</span><span class="n">arange</span><span class="p">(</span><span class="mi">25</span><span class="p">).</span><span class="n">reshape</span><span class="p">(</span><span class="mi">5</span><span class="p">,</span> <span class="o">-</span><span class="mi">1</span><span class="p">))</span>
</code></pre></div></div>

<div class="language-python highlighter-rouge"><div class="highlight"><pre class="highlight"><code><span class="n">the_dataframe</span>
</code></pre></div></div>

<div>
<style scoped="">
    .dataframe tbody tr th:only-of-type {
        vertical-align: middle;
    }

    .dataframe tbody tr th {
        vertical-align: top;
    }

    .dataframe thead th {
        text-align: right;
    }
</style>
<table border="1" class="dataframe">
  <thead>
    <tr style="text-align: right;">
      <th></th>
      <th>0</th>
      <th>1</th>
      <th>2</th>
      <th>3</th>
      <th>4</th>
    </tr>
  </thead>
  <tbody>
    <tr>
      <th>0</th>
      <td>0</td>
      <td>1</td>
      <td>2</td>
      <td>3</td>
      <td>4</td>
    </tr>
    <tr>
      <th>1</th>
      <td>5</td>
      <td>6</td>
      <td>7</td>
      <td>8</td>
      <td>9</td>
    </tr>
    <tr>
      <th>2</th>
      <td>10</td>
      <td>11</td>
      <td>12</td>
      <td>13</td>
      <td>14</td>
    </tr>
    <tr>
      <th>3</th>
      <td>15</td>
      <td>16</td>
      <td>17</td>
      <td>18</td>
      <td>19</td>
    </tr>
    <tr>
      <th>4</th>
      <td>20</td>
      <td>21</td>
      <td>22</td>
      <td>23</td>
      <td>24</td>
    </tr>
  </tbody>
</table>
</div>

<h4>Desired output</h4>

<p><img src="/blog/assets/post_cont_image/pandas_ex57.png" alt="Pandas_ex57" /></p>

<h4>Solution</h4>

<h4>1st method</h4>

<div class="language-python highlighter-rouge"><div class="highlight"><pre class="highlight"><code><span class="n">the_dataframe</span><span class="p">.</span><span class="n">iloc</span><span class="p">[::</span><span class="o">-</span><span class="mi">1</span><span class="p">]</span>
</code></pre></div></div>

<div>
<style scoped="">
    .dataframe tbody tr th:only-of-type {
        vertical-align: middle;
    }

    .dataframe tbody tr th {
        vertical-align: top;
    }

    .dataframe thead th {
        text-align: right;
    }
</style>
<table border="1" class="dataframe">
  <thead>
    <tr style="text-align: right;">
      <th></th>
      <th>0</th>
      <th>1</th>
      <th>2</th>
      <th>3</th>
      <th>4</th>
    </tr>
  </thead>
  <tbody>
    <tr>
      <th>4</th>
      <td>20</td>
      <td>21</td>
      <td>22</td>
      <td>23</td>
      <td>24</td>
    </tr>
    <tr>
      <th>3</th>
      <td>15</td>
      <td>16</td>
      <td>17</td>
      <td>18</td>
      <td>19</td>
    </tr>
    <tr>
      <th>2</th>
      <td>10</td>
      <td>11</td>
      <td>12</td>
      <td>13</td>
      <td>14</td>
    </tr>
    <tr>
      <th>1</th>
      <td>5</td>
      <td>6</td>
      <td>7</td>
      <td>8</td>
      <td>9</td>
    </tr>
    <tr>
      <th>0</th>
      <td>0</td>
      <td>1</td>
      <td>2</td>
      <td>3</td>
      <td>4</td>
    </tr>
  </tbody>
</table>
</div>

<h4>2nd method</h4>

<div class="language-python highlighter-rouge"><div class="highlight"><pre class="highlight"><code><span class="n">the_dataframe</span><span class="p">[::</span><span class="o">-</span><span class="mi">1</span><span class="p">]</span>
</code></pre></div></div>

<div>
<style scoped="">
    .dataframe tbody tr th:only-of-type {
        vertical-align: middle;
    }

    .dataframe tbody tr th {
        vertical-align: top;
    }

    .dataframe thead th {
        text-align: right;
    }
</style>
<table border="1" class="dataframe">
  <thead>
    <tr style="text-align: right;">
      <th></th>
      <th>0</th>
      <th>1</th>
      <th>2</th>
      <th>3</th>
      <th>4</th>
    </tr>
  </thead>
  <tbody>
    <tr>
      <th>4</th>
      <td>20</td>
      <td>21</td>
      <td>22</td>
      <td>23</td>
      <td>24</td>
    </tr>
    <tr>
      <th>3</th>
      <td>15</td>
      <td>16</td>
      <td>17</td>
      <td>18</td>
      <td>19</td>
    </tr>
    <tr>
      <th>2</th>
      <td>10</td>
      <td>11</td>
      <td>12</td>
      <td>13</td>
      <td>14</td>
    </tr>
    <tr>
      <th>1</th>
      <td>5</td>
      <td>6</td>
      <td>7</td>
      <td>8</td>
      <td>9</td>
    </tr>
    <tr>
      <th>0</th>
      <td>0</td>
      <td>1</td>
      <td>2</td>
      <td>3</td>
      <td>4</td>
    </tr>
  </tbody>
</table>
</div>

<p>To reverse the dataframe row-wise, we use indexing with <code class="language-plaintext highlighter-rouge">[::-1]</code>. The second method is the short form of the first method we used <code class="language-plaintext highlighter-rouge">iloc</code>.</p>

<p>Note: In Exercise 75, we will see how to achieve the same result column-wise.</p>

<h3>Ex 58: How to create one-hot encodings of a categorical variable (dummy variables)?</h3>

<p>Q: Get one-hot encodings for column <code class="language-plaintext highlighter-rouge">a</code> in the dataframe <code class="language-plaintext highlighter-rouge">the_dataframe</code> and append it as columns.</p>

<div class="language-python highlighter-rouge"><div class="highlight"><pre class="highlight"><code><span class="n">the_dataframe</span> <span class="o">=</span> <span class="n">pd</span><span class="p">.</span><span class="n">DataFrame</span><span class="p">(</span><span class="n">np</span><span class="p">.</span><span class="n">arange</span><span class="p">(</span><span class="mi">25</span><span class="p">).</span><span class="n">reshape</span><span class="p">(</span><span class="mi">5</span><span class="p">,</span><span class="o">-</span><span class="mi">1</span><span class="p">),</span> <span class="n">columns</span><span class="o">=</span><span class="nb">list</span><span class="p">(</span><span class="s">'abcde'</span><span class="p">))</span>
<span class="n">the_dataframe</span>
</code></pre></div></div>

<div>
<style scoped="">
    .dataframe tbody tr th:only-of-type {
        vertical-align: middle;
    }

    .dataframe tbody tr th {
        vertical-align: top;
    }

    .dataframe thead th {
        text-align: right;
    }
</style>
<table border="1" class="dataframe">
  <thead>
    <tr style="text-align: right;">
      <th></th>
      <th>a</th>
      <th>b</th>
      <th>c</th>
      <th>d</th>
      <th>e</th>
    </tr>
  </thead>
  <tbody>
    <tr>
      <th>0</th>
      <td>0</td>
      <td>1</td>
      <td>2</td>
      <td>3</td>
      <td>4</td>
    </tr>
    <tr>
      <th>1</th>
      <td>5</td>
      <td>6</td>
      <td>7</td>
      <td>8</td>
      <td>9</td>
    </tr>
    <tr>
      <th>2</th>
      <td>10</td>
      <td>11</td>
      <td>12</td>
      <td>13</td>
      <td>14</td>
    </tr>
    <tr>
      <th>3</th>
      <td>15</td>
      <td>16</td>
      <td>17</td>
      <td>18</td>
      <td>19</td>
    </tr>
    <tr>
      <th>4</th>
      <td>20</td>
      <td>21</td>
      <td>22</td>
      <td>23</td>
      <td>24</td>
    </tr>
  </tbody>
</table>
</div>

<p><img src="/blog/assets/post_cont_image/pandas_ex58.png" alt="Pandas_ex58" /></p>

<h4>Desired output</h4>

<h4>Solution</h4>

<div class="language-python highlighter-rouge"><div class="highlight"><pre class="highlight"><code><span class="n">one_hot</span> <span class="o">=</span> <span class="n">pd</span><span class="p">.</span><span class="n">get_dummies</span><span class="p">(</span><span class="n">the_dataframe</span><span class="p">[</span><span class="s">"a"</span><span class="p">])</span>
</code></pre></div></div>

<div class="language-python highlighter-rouge"><div class="highlight"><pre class="highlight"><code><span class="n">one_hot</span>
</code></pre></div></div>

<div>
<style scoped="">
    .dataframe tbody tr th:only-of-type {
        vertical-align: middle;
    }

    .dataframe tbody tr th {
        vertical-align: top;
    }

    .dataframe thead th {
        text-align: right;
    }
</style>
<table border="1" class="dataframe">
  <thead>
    <tr style="text-align: right;">
      <th></th>
      <th>0</th>
      <th>5</th>
      <th>10</th>
      <th>15</th>
      <th>20</th>
    </tr>
  </thead>
  <tbody>
    <tr>
      <th>0</th>
      <td>1</td>
      <td>0</td>
      <td>0</td>
      <td>0</td>
      <td>0</td>
    </tr>
    <tr>
      <th>1</th>
      <td>0</td>
      <td>1</td>
      <td>0</td>
      <td>0</td>
      <td>0</td>
    </tr>
    <tr>
      <th>2</th>
      <td>0</td>
      <td>0</td>
      <td>1</td>
      <td>0</td>
      <td>0</td>
    </tr>
    <tr>
      <th>3</th>
      <td>0</td>
      <td>0</td>
      <td>0</td>
      <td>1</td>
      <td>0</td>
    </tr>
    <tr>
      <th>4</th>
      <td>0</td>
      <td>0</td>
      <td>0</td>
      <td>0</td>
      <td>1</td>
    </tr>
  </tbody>
</table>
</div>

<div class="language-python highlighter-rouge"><div class="highlight"><pre class="highlight"><code><span class="n">pd</span><span class="p">.</span><span class="n">concat</span><span class="p">([</span><span class="n">one_hot</span><span class="p">,</span> <span class="n">the_dataframe</span><span class="p">[[</span><span class="s">"b"</span><span class="p">,</span><span class="s">"c"</span><span class="p">,</span><span class="s">"d"</span><span class="p">,</span><span class="s">"e"</span><span class="p">]]],</span><span class="n">axis</span><span class="o">=</span><span class="mi">1</span><span class="p">)</span>
</code></pre></div></div>

<div>
<style scoped="">
    .dataframe tbody tr th:only-of-type {
        vertical-align: middle;
    }

    .dataframe tbody tr th {
        vertical-align: top;
    }

    .dataframe thead th {
        text-align: right;
    }
</style>
<table border="1" class="dataframe">
  <thead>
    <tr style="text-align: right;">
      <th></th>
      <th>0</th>
      <th>5</th>
      <th>10</th>
      <th>15</th>
      <th>20</th>
      <th>b</th>
      <th>c</th>
      <th>d</th>
      <th>e</th>
    </tr>
  </thead>
  <tbody>
    <tr>
      <th>0</th>
      <td>1</td>
      <td>0</td>
      <td>0</td>
      <td>0</td>
      <td>0</td>
      <td>1</td>
      <td>2</td>
      <td>3</td>
      <td>4</td>
    </tr>
    <tr>
      <th>1</th>
      <td>0</td>
      <td>1</td>
      <td>0</td>
      <td>0</td>
      <td>0</td>
      <td>6</td>
      <td>7</td>
      <td>8</td>
      <td>9</td>
    </tr>
    <tr>
      <th>2</th>
      <td>0</td>
      <td>0</td>
      <td>1</td>
      <td>0</td>
      <td>0</td>
      <td>11</td>
      <td>12</td>
      <td>13</td>
      <td>14</td>
    </tr>
    <tr>
      <th>3</th>
      <td>0</td>
      <td>0</td>
      <td>0</td>
      <td>1</td>
      <td>0</td>
      <td>16</td>
      <td>17</td>
      <td>18</td>
      <td>19</td>
    </tr>
    <tr>
      <th>4</th>
      <td>0</td>
      <td>0</td>
      <td>0</td>
      <td>0</td>
      <td>1</td>
      <td>21</td>
      <td>22</td>
      <td>23</td>
      <td>24</td>
    </tr>
  </tbody>
</table>
</div>

<p>We get the one-hot encoding of column <code class="language-plaintext highlighter-rouge">a</code> by using the <code class="language-plaintext highlighter-rouge">get_dummies</code> function and pass in the column <code class="language-plaintext highlighter-rouge">a</code>.</p>

<p>To append the newly created <code class="language-plaintext highlighter-rouge">one_hot</code>, we use <code class="language-plaintext highlighter-rouge">concat</code> and pass in <code class="language-plaintext highlighter-rouge">one_hot</code> and the remaining columns of <code class="language-plaintext highlighter-rouge">dataframe</code> (except column <code class="language-plaintext highlighter-rouge">a</code>). Finally, we set the axis to 1 since we want to concatenate column-wise.</p>

<h3>Ex 59: Which column contains the highest number of row-wise maximum values?</h3>

<p>Q: Obtain the column name with the highest number of row-wise in <code class="language-plaintext highlighter-rouge">the_dataframe</code>.</p>

<div class="language-python highlighter-rouge"><div class="highlight"><pre class="highlight"><code><span class="n">np</span><span class="p">.</span><span class="n">random</span><span class="p">.</span><span class="n">seed</span><span class="p">(</span><span class="mi">42</span><span class="p">)</span>
<span class="n">the_dataframe</span> <span class="o">=</span> <span class="n">pd</span><span class="p">.</span><span class="n">DataFrame</span><span class="p">(</span><span class="n">np</span><span class="p">.</span><span class="n">random</span><span class="p">.</span><span class="n">randint</span><span class="p">(</span><span class="mi">1</span><span class="p">,</span><span class="mi">100</span><span class="p">,</span> <span class="mi">40</span><span class="p">).</span><span class="n">reshape</span><span class="p">(</span><span class="mi">10</span><span class="p">,</span> <span class="o">-</span><span class="mi">1</span><span class="p">))</span>
</code></pre></div></div>

<h4>Desired output</h4>

<div class="language-python highlighter-rouge"><div class="highlight"><pre class="highlight"><code><span class="c1"># The column name with the highest number of row-wise is 0
</span></code></pre></div></div>

<h4>Solution</h4>

<div class="language-python highlighter-rouge"><div class="highlight"><pre class="highlight"><code><span class="n">row_high_num</span> <span class="o">=</span> <span class="n">the_dataframe</span><span class="p">.</span><span class="nb">sum</span><span class="p">(</span><span class="n">axis</span><span class="o">=</span><span class="mi">0</span><span class="p">).</span><span class="n">argmax</span><span class="p">()</span>
</code></pre></div></div>

<div class="language-python highlighter-rouge"><div class="highlight"><pre class="highlight"><code><span class="k">print</span><span class="p">(</span><span class="s">"The column name with the highest number of row-wise is {}"</span><span class="p">.</span><span class="nb">format</span><span class="p">(</span><span class="n">row_high_num</span><span class="p">))</span>
</code></pre></div></div>

<div class="language-plaintext highlighter-rouge"><div class="highlight"><pre class="highlight"><code>The column name with the highest number of row-wise is 0
</code></pre></div></div>

<p>To get the row with the largest sum row-wise, we use the <code class="language-plaintext highlighter-rouge">sum</code> function and pass in the axis argument set to 0 (telling Pandas to calculate the sum of elements row-wise) and then use <code class="language-plaintext highlighter-rouge">argmax</code> to get the index with the highest value in the series.</p>

<h3>Ex 60: How to know the maximum possible correlation value of each column against other columns?</h3>

<p>Q: Compute the maximum possible absolute correlation value of each column against other columns in <code class="language-plaintext highlighter-rouge">the_dataframe</code>.</p>

<div class="language-python highlighter-rouge"><div class="highlight"><pre class="highlight"><code><span class="n">np</span><span class="p">.</span><span class="n">random</span><span class="p">.</span><span class="n">seed</span><span class="p">(</span><span class="mi">42</span><span class="p">)</span>
<span class="n">the_dataframe</span> <span class="o">=</span> <span class="n">pd</span><span class="p">.</span><span class="n">DataFrame</span><span class="p">(</span><span class="n">np</span><span class="p">.</span><span class="n">random</span><span class="p">.</span><span class="n">randint</span><span class="p">(</span><span class="mi">1</span><span class="p">,</span><span class="mi">100</span><span class="p">,</span> <span class="mi">80</span><span class="p">).</span><span class="n">reshape</span><span class="p">(</span><span class="mi">8</span><span class="p">,</span> <span class="o">-</span><span class="mi">1</span><span class="p">),</span> <span class="n">columns</span><span class="o">=</span><span class="nb">list</span><span class="p">(</span><span class="s">'pqrstuvwxy'</span><span class="p">),</span> <span class="n">index</span><span class="o">=</span><span class="nb">list</span><span class="p">(</span><span class="s">'abcdefgh'</span><span class="p">))</span>
</code></pre></div></div>

<h4>Desired output</h4>

<div class="language-python highlighter-rouge"><div class="highlight"><pre class="highlight"><code><span class="c1"># array([0.81941445, 0.84466639, 0.44944264, 0.44872809, 0.81941445,
#        0.80618428, 0.44944264, 0.5434561 , 0.84466639, 0.80618428])
</span></code></pre></div></div>

<h4>Solution</h4>

<div class="language-python highlighter-rouge"><div class="highlight"><pre class="highlight"><code><span class="n">abs_corr</span> <span class="o">=</span> <span class="n">np</span><span class="p">.</span><span class="nb">abs</span><span class="p">(</span><span class="n">the_dataframe</span><span class="p">.</span><span class="n">corr</span><span class="p">())</span>
</code></pre></div></div>

<div class="language-python highlighter-rouge"><div class="highlight"><pre class="highlight"><code><span class="n">abs_corr</span>
</code></pre></div></div>

<div>
<style scoped="">
    .dataframe tbody tr th:only-of-type {
        vertical-align: middle;
    }

    .dataframe tbody tr th {
        vertical-align: top;
    }

    .dataframe thead th {
        text-align: right;
    }
</style>
<table border="1" class="dataframe">
  <thead>
    <tr style="text-align: right;">
      <th></th>
      <th>p</th>
      <th>q</th>
      <th>r</th>
      <th>s</th>
      <th>t</th>
      <th>u</th>
      <th>v</th>
      <th>w</th>
      <th>x</th>
      <th>y</th>
    </tr>
  </thead>
  <tbody>
    <tr>
      <th>p</th>
      <td>1.000000</td>
      <td>0.019359</td>
      <td>0.088207</td>
      <td>0.087366</td>
      <td>0.819414</td>
      <td>0.736955</td>
      <td>0.070727</td>
      <td>0.338139</td>
      <td>0.163112</td>
      <td>0.665627</td>
    </tr>
    <tr>
      <th>q</th>
      <td>0.019359</td>
      <td>1.000000</td>
      <td>0.280799</td>
      <td>0.121217</td>
      <td>0.172215</td>
      <td>0.262234</td>
      <td>0.304781</td>
      <td>0.042748</td>
      <td>0.844666</td>
      <td>0.243317</td>
    </tr>
    <tr>
      <th>r</th>
      <td>0.088207</td>
      <td>0.280799</td>
      <td>1.000000</td>
      <td>0.184988</td>
      <td>0.223515</td>
      <td>0.017763</td>
      <td>0.449443</td>
      <td>0.127091</td>
      <td>0.228455</td>
      <td>0.018350</td>
    </tr>
    <tr>
      <th>s</th>
      <td>0.087366</td>
      <td>0.121217</td>
      <td>0.184988</td>
      <td>1.000000</td>
      <td>0.210879</td>
      <td>0.096695</td>
      <td>0.422290</td>
      <td>0.306141</td>
      <td>0.100174</td>
      <td>0.448728</td>
    </tr>
    <tr>
      <th>t</th>
      <td>0.819414</td>
      <td>0.172215</td>
      <td>0.223515</td>
      <td>0.210879</td>
      <td>1.000000</td>
      <td>0.576720</td>
      <td>0.334690</td>
      <td>0.543456</td>
      <td>0.047136</td>
      <td>0.273478</td>
    </tr>
    <tr>
      <th>u</th>
      <td>0.736955</td>
      <td>0.262234</td>
      <td>0.017763</td>
      <td>0.096695</td>
      <td>0.576720</td>
      <td>1.000000</td>
      <td>0.137836</td>
      <td>0.352145</td>
      <td>0.363597</td>
      <td>0.806184</td>
    </tr>
    <tr>
      <th>v</th>
      <td>0.070727</td>
      <td>0.304781</td>
      <td>0.449443</td>
      <td>0.422290</td>
      <td>0.334690</td>
      <td>0.137836</td>
      <td>1.000000</td>
      <td>0.158152</td>
      <td>0.188482</td>
      <td>0.033227</td>
    </tr>
    <tr>
      <th>w</th>
      <td>0.338139</td>
      <td>0.042748</td>
      <td>0.127091</td>
      <td>0.306141</td>
      <td>0.543456</td>
      <td>0.352145</td>
      <td>0.158152</td>
      <td>1.000000</td>
      <td>0.325939</td>
      <td>0.071704</td>
    </tr>
    <tr>
      <th>x</th>
      <td>0.163112</td>
      <td>0.844666</td>
      <td>0.228455</td>
      <td>0.100174</td>
      <td>0.047136</td>
      <td>0.363597</td>
      <td>0.188482</td>
      <td>0.325939</td>
      <td>1.000000</td>
      <td>0.338705</td>
    </tr>
    <tr>
      <th>y</th>
      <td>0.665627</td>
      <td>0.243317</td>
      <td>0.018350</td>
      <td>0.448728</td>
      <td>0.273478</td>
      <td>0.806184</td>
      <td>0.033227</td>
      <td>0.071704</td>
      <td>0.338705</td>
      <td>1.000000</td>
    </tr>
  </tbody>
</table>
</div>

<div class="language-python highlighter-rouge"><div class="highlight"><pre class="highlight"><code><span class="n">max_abs_corr</span> <span class="o">=</span> <span class="n">abs_corr</span><span class="p">.</span><span class="nb">apply</span><span class="p">(</span><span class="k">lambda</span> <span class="n">x</span><span class="p">:</span> <span class="nb">sorted</span><span class="p">(</span><span class="n">x</span><span class="p">)[</span><span class="o">-</span><span class="mi">2</span><span class="p">]).</span><span class="n">values</span>
</code></pre></div></div>

<div class="language-python highlighter-rouge"><div class="highlight"><pre class="highlight"><code><span class="n">max_abs_corr</span>
</code></pre></div></div>

<div class="language-plaintext highlighter-rouge"><div class="highlight"><pre class="highlight"><code>array([0.81941445, 0.84466639, 0.44944264, 0.44872809, 0.81941445,
       0.80618428, 0.44944264, 0.5434561 , 0.84466639, 0.80618428])
</code></pre></div></div>

<p>We first calculate the absolute correlation the whole dataset. We use the <code class="language-plaintext highlighter-rouge">corr()</code> function and pass it as the argument to the NumPy function <code class="language-plaintext highlighter-rouge">abs</code> to get the absolute values (non-negative values).</p>

<p>Now that we have the absolute correction, use lambda expression with the <code class="language-plaintext highlighter-rouge">apply</code> function to find the highest correlation value in each row.</p>

<p>We sorted first each row (represented by <code class="language-plaintext highlighter-rouge">x</code> in the lambda expression), secondly get the second last element in the row using indexing. The reason why we get the second-highest value instead of the last one is because the last value is <code class="language-plaintext highlighter-rouge">1</code> (calculated from the correlation of the same column). We then form an array with the highest correlation values in each row.</p>

<h3>Ex 61: How to create a column containing the minimum by the maximum of each row?</h3>

<p>Q: Compute the minimum-by-maximum for every row of <code class="language-plaintext highlighter-rouge">the_dataframe</code>.</p>

<div class="language-python highlighter-rouge"><div class="highlight"><pre class="highlight"><code><span class="n">np</span><span class="p">.</span><span class="n">random</span><span class="p">.</span><span class="n">seed</span><span class="p">(</span><span class="mi">42</span><span class="p">)</span>
<span class="n">the_dataframe</span> <span class="o">=</span> <span class="n">pd</span><span class="p">.</span><span class="n">DataFrame</span><span class="p">(</span><span class="n">np</span><span class="p">.</span><span class="n">random</span><span class="p">.</span><span class="n">randint</span><span class="p">(</span><span class="mi">1</span><span class="p">,</span><span class="mi">100</span><span class="p">,</span> <span class="mi">80</span><span class="p">).</span><span class="n">reshape</span><span class="p">(</span><span class="mi">8</span><span class="p">,</span> <span class="o">-</span><span class="mi">1</span><span class="p">))</span>
<span class="n">the_dataframe</span>
</code></pre></div></div>

<div>
<style scoped="">
    .dataframe tbody tr th:only-of-type {
        vertical-align: middle;
    }

    .dataframe tbody tr th {
        vertical-align: top;
    }

    .dataframe thead th {
        text-align: right;
    }
</style>
<table border="1" class="dataframe">
  <thead>
    <tr style="text-align: right;">
      <th></th>
      <th>0</th>
      <th>1</th>
      <th>2</th>
      <th>3</th>
      <th>4</th>
      <th>5</th>
      <th>6</th>
      <th>7</th>
      <th>8</th>
      <th>9</th>
    </tr>
  </thead>
  <tbody>
    <tr>
      <th>0</th>
      <td>52</td>
      <td>93</td>
      <td>15</td>
      <td>72</td>
      <td>61</td>
      <td>21</td>
      <td>83</td>
      <td>87</td>
      <td>75</td>
      <td>75</td>
    </tr>
    <tr>
      <th>1</th>
      <td>88</td>
      <td>24</td>
      <td>3</td>
      <td>22</td>
      <td>53</td>
      <td>2</td>
      <td>88</td>
      <td>30</td>
      <td>38</td>
      <td>2</td>
    </tr>
    <tr>
      <th>2</th>
      <td>64</td>
      <td>60</td>
      <td>21</td>
      <td>33</td>
      <td>76</td>
      <td>58</td>
      <td>22</td>
      <td>89</td>
      <td>49</td>
      <td>91</td>
    </tr>
    <tr>
      <th>3</th>
      <td>59</td>
      <td>42</td>
      <td>92</td>
      <td>60</td>
      <td>80</td>
      <td>15</td>
      <td>62</td>
      <td>62</td>
      <td>47</td>
      <td>62</td>
    </tr>
    <tr>
      <th>4</th>
      <td>51</td>
      <td>55</td>
      <td>64</td>
      <td>3</td>
      <td>51</td>
      <td>7</td>
      <td>21</td>
      <td>73</td>
      <td>39</td>
      <td>18</td>
    </tr>
    <tr>
      <th>5</th>
      <td>4</td>
      <td>89</td>
      <td>60</td>
      <td>14</td>
      <td>9</td>
      <td>90</td>
      <td>53</td>
      <td>2</td>
      <td>84</td>
      <td>92</td>
    </tr>
    <tr>
      <th>6</th>
      <td>60</td>
      <td>71</td>
      <td>44</td>
      <td>8</td>
      <td>47</td>
      <td>35</td>
      <td>78</td>
      <td>81</td>
      <td>36</td>
      <td>50</td>
    </tr>
    <tr>
      <th>7</th>
      <td>4</td>
      <td>2</td>
      <td>6</td>
      <td>54</td>
      <td>4</td>
      <td>54</td>
      <td>93</td>
      <td>63</td>
      <td>18</td>
      <td>90</td>
    </tr>
  </tbody>
</table>
</div>

<h4>Desired output</h4>

<div class="language-python highlighter-rouge"><div class="highlight"><pre class="highlight"><code><span class="c1"># 0    0.161290
# 1    0.022727
# 2    0.230769
# 3    0.163043
# 4    0.041096
# 5    0.021739
# 6    0.098765
# 7    0.021505
# dtype: float64
</span></code></pre></div></div>

<h4>Solution</h4>

<h4>1st Method</h4>

<div class="language-python highlighter-rouge"><div class="highlight"><pre class="highlight"><code><span class="n">the_min</span> <span class="o">=</span> <span class="n">the_dataframe</span><span class="p">.</span><span class="nb">min</span><span class="p">(</span><span class="n">axis</span><span class="o">=</span><span class="mi">1</span><span class="p">)</span>
</code></pre></div></div>

<div class="language-python highlighter-rouge"><div class="highlight"><pre class="highlight"><code><span class="n">the_max</span> <span class="o">=</span> <span class="n">the_dataframe</span><span class="p">.</span><span class="nb">max</span><span class="p">(</span><span class="n">axis</span><span class="o">=</span><span class="mi">1</span><span class="p">)</span>
</code></pre></div></div>

<div class="language-python highlighter-rouge"><div class="highlight"><pre class="highlight"><code><span class="n">min_by_max</span> <span class="o">=</span> <span class="n">the_min</span><span class="o">/</span><span class="n">the_max</span>
</code></pre></div></div>

<div class="language-python highlighter-rouge"><div class="highlight"><pre class="highlight"><code><span class="n">min_by_max</span>
</code></pre></div></div>

<div class="language-plaintext highlighter-rouge"><div class="highlight"><pre class="highlight"><code>0    0.161290
1    0.022727
2    0.230769
3    0.163043
4    0.041096
5    0.021739
6    0.098765
7    0.021505
dtype: float64
</code></pre></div></div>

<p>The easiest way to solve this problem is to find the minimum values in each column using the <code class="language-plaintext highlighter-rouge">min</code> function by setting the axis to 1. We do the same for the maximum to finally divide the minimum values by the maximum values.</p>

<h4>2nd Method</h4>

<div class="language-python highlighter-rouge"><div class="highlight"><pre class="highlight"><code><span class="n">the_dataframe</span><span class="p">.</span><span class="nb">apply</span><span class="p">(</span><span class="k">lambda</span> <span class="n">x</span><span class="p">:</span> <span class="n">np</span><span class="p">.</span><span class="nb">min</span><span class="p">(</span><span class="n">x</span><span class="p">)</span><span class="o">/</span><span class="n">np</span><span class="p">.</span><span class="nb">max</span><span class="p">(</span><span class="n">x</span><span class="p">),</span> <span class="n">axis</span><span class="o">=</span><span class="mi">1</span><span class="p">)</span>
</code></pre></div></div>

<div class="language-plaintext highlighter-rouge"><div class="highlight"><pre class="highlight"><code>0    0.161290
1    0.022727
2    0.230769
3    0.163043
4    0.041096
5    0.021739
6    0.098765
7    0.021505
dtype: float64
</code></pre></div></div>

<p>The previous method uses three lines of codes we can write in one line of code.  We use the lambda expression to calculate the division of the minimum by the maximum of <code class="language-plaintext highlighter-rouge">x</code> and set axis to <code class="language-plaintext highlighter-rouge">1</code>.</p>

<h3>Ex 62: How to create a column that contains the penultimate value in each row?</h3>

<p>Q: Create a new column <code class="language-plaintext highlighter-rouge">penultimate</code> which has the second-largest value of each row of <code class="language-plaintext highlighter-rouge">the_dataframe</code>.</p>

<div class="language-python highlighter-rouge"><div class="highlight"><pre class="highlight"><code><span class="n">np</span><span class="p">.</span><span class="n">random</span><span class="p">.</span><span class="n">seed</span><span class="p">(</span><span class="mi">42</span><span class="p">)</span>
<span class="n">the_dataframe</span> <span class="o">=</span> <span class="n">pd</span><span class="p">.</span><span class="n">DataFrame</span><span class="p">(</span><span class="n">np</span><span class="p">.</span><span class="n">random</span><span class="p">.</span><span class="n">randint</span><span class="p">(</span><span class="mi">1</span><span class="p">,</span><span class="mi">100</span><span class="p">,</span> <span class="mi">80</span><span class="p">).</span><span class="n">reshape</span><span class="p">(</span><span class="mi">8</span><span class="p">,</span> <span class="o">-</span><span class="mi">1</span><span class="p">))</span>
</code></pre></div></div>

<h4>Desire output</h4>

<p><img src="/blog/assets/post_cont_image/pandas_ex62.png" alt="Pandas_ex62" /></p>

<h4>Solution</h4>

<div class="language-python highlighter-rouge"><div class="highlight"><pre class="highlight"><code><span class="n">the_dataframe</span><span class="p">[</span><span class="s">'penultimate'</span><span class="p">]</span> <span class="o">=</span> <span class="n">the_dataframe</span><span class="p">.</span><span class="nb">apply</span><span class="p">(</span><span class="k">lambda</span> <span class="n">x</span><span class="p">:</span> <span class="n">x</span><span class="p">.</span><span class="n">sort_values</span><span class="p">().</span><span class="n">unique</span><span class="p">()[</span><span class="o">-</span><span class="mi">2</span><span class="p">],</span> <span class="n">axis</span><span class="o">=</span><span class="mi">1</span><span class="p">)</span>
</code></pre></div></div>

<p>As previously seen, to solve this type of challenge, we use a lambda expression with the <code class="language-plaintext highlighter-rouge">apply</code> function. We first set <code class="language-plaintext highlighter-rouge">axis</code> to <code class="language-plaintext highlighter-rouge">1</code> as we are calculating the values row-wise and in the lambda expression, we sort <code class="language-plaintext highlighter-rouge">x</code> ignore the duplicate with <code class="language-plaintext highlighter-rouge">ignore</code> function and return the second largest value using indexing <code class="language-plaintext highlighter-rouge">[-2]</code>.</p>

<h3>Ex 63: How to normalize all columns in a dataframe?</h3>

<p>Q1: Normalize all columns of <code class="language-plaintext highlighter-rouge">the_dataframe</code> by subtracting the column mean and divide by standard deviation.</p>

<p>Q2: Range all columns values of <code class="language-plaintext highlighter-rouge">the_dataframe</code> such that the minimum value in each column is 0 and max is 1.</p>

<p>Note: Don’t use external packages like sklearn.</p>

<div class="language-python highlighter-rouge"><div class="highlight"><pre class="highlight"><code><span class="n">np</span><span class="p">.</span><span class="n">random</span><span class="p">.</span><span class="n">seed</span><span class="p">(</span><span class="mi">42</span><span class="p">)</span>
<span class="n">the_dataframe</span> <span class="o">=</span> <span class="n">pd</span><span class="p">.</span><span class="n">DataFrame</span><span class="p">(</span><span class="n">np</span><span class="p">.</span><span class="n">random</span><span class="p">.</span><span class="n">randint</span><span class="p">(</span><span class="mi">1</span><span class="p">,</span><span class="mi">100</span><span class="p">,</span> <span class="mi">80</span><span class="p">).</span><span class="n">reshape</span><span class="p">(</span><span class="mi">8</span><span class="p">,</span> <span class="o">-</span><span class="mi">1</span><span class="p">))</span>
</code></pre></div></div>

<h4>Desired output</h4>

<h4>Q1</h4>

<p><img src="/blog/assets/post_cont_image/pandas_ex6_q1.png" alt="Pandas_ex63_q1" /></p>

<h4>Q2</h4>

<p><img src="/blog/assets/post_cont_image/pandas_ex63_q2.png" alt="Pandas_ex63_q2" /></p>

<h4>Solution</h4>

<h4>Q1</h4>

<div class="language-python highlighter-rouge"><div class="highlight"><pre class="highlight"><code><span class="n">the_dataframe</span><span class="p">.</span><span class="nb">apply</span><span class="p">(</span><span class="k">lambda</span> <span class="n">x</span><span class="p">:</span> <span class="p">(</span><span class="n">x</span> <span class="o">-</span> <span class="n">x</span><span class="p">.</span><span class="n">mean</span><span class="p">())</span> <span class="o">/</span> <span class="n">x</span><span class="p">.</span><span class="n">std</span><span class="p">(),</span><span class="n">axis</span><span class="o">=</span><span class="mi">0</span><span class="p">)</span>
</code></pre></div></div>

<div>
<style scoped="">
    .dataframe tbody tr th:only-of-type {
        vertical-align: middle;
    }

    .dataframe tbody tr th {
        vertical-align: top;
    }

    .dataframe thead th {
        text-align: right;
    }
</style>
<table border="1" class="dataframe">
  <thead>
    <tr style="text-align: right;">
      <th></th>
      <th>0</th>
      <th>1</th>
      <th>2</th>
      <th>3</th>
      <th>4</th>
      <th>5</th>
      <th>6</th>
      <th>7</th>
      <th>8</th>
      <th>9</th>
    </tr>
  </thead>
  <tbody>
    <tr>
      <th>0</th>
      <td>0.144954</td>
      <td>1.233620</td>
      <td>-0.722109</td>
      <td>1.495848</td>
      <td>0.478557</td>
      <td>-0.471883</td>
      <td>0.718777</td>
      <td>0.860589</td>
      <td>1.241169</td>
      <td>0.434515</td>
    </tr>
    <tr>
      <th>1</th>
      <td>1.372799</td>
      <td>-0.977283</td>
      <td>-1.096825</td>
      <td>-0.434278</td>
      <td>0.192317</td>
      <td>-1.101061</td>
      <td>0.894088</td>
      <td>-1.017060</td>
      <td>-0.475588</td>
      <td>-1.680126</td>
    </tr>
    <tr>
      <th>2</th>
      <td>0.554235</td>
      <td>0.176231</td>
      <td>-0.534751</td>
      <td>-0.009651</td>
      <td>1.015256</td>
      <td>0.753357</td>
      <td>-1.420023</td>
      <td>0.926472</td>
      <td>0.034799</td>
      <td>0.897999</td>
    </tr>
    <tr>
      <th>3</th>
      <td>0.383701</td>
      <td>-0.400526</td>
      <td>1.682318</td>
      <td>1.032617</td>
      <td>1.158376</td>
      <td>-0.670571</td>
      <td>-0.017531</td>
      <td>0.037059</td>
      <td>-0.057999</td>
      <td>0.057935</td>
    </tr>
    <tr>
      <th>4</th>
      <td>0.110847</td>
      <td>0.016021</td>
      <td>0.807981</td>
      <td>-1.167726</td>
      <td>0.120757</td>
      <td>-0.935488</td>
      <td>-1.455085</td>
      <td>0.399412</td>
      <td>-0.429189</td>
      <td>-1.216643</td>
    </tr>
    <tr>
      <th>5</th>
      <td>-1.492172</td>
      <td>1.105451</td>
      <td>0.683076</td>
      <td>-0.743098</td>
      <td>-1.382001</td>
      <td>1.813025</td>
      <td>-0.333092</td>
      <td>-1.939414</td>
      <td>1.658759</td>
      <td>0.926966</td>
    </tr>
    <tr>
      <th>6</th>
      <td>0.417808</td>
      <td>0.528694</td>
      <td>0.183455</td>
      <td>-0.974714</td>
      <td>-0.022362</td>
      <td>-0.008279</td>
      <td>0.543466</td>
      <td>0.662942</td>
      <td>-0.568386</td>
      <td>-0.289677</td>
    </tr>
    <tr>
      <th>7</th>
      <td>-1.492172</td>
      <td>-1.682209</td>
      <td>-1.003146</td>
      <td>0.801002</td>
      <td>-1.560900</td>
      <td>0.620899</td>
      <td>1.069400</td>
      <td>0.070000</td>
      <td>-1.403565</td>
      <td>0.869031</td>
    </tr>
  </tbody>
</table>
</div>

<p>To solve this issue, we need to know the formula for normalizing. The formulation is as follow:</p>

<p><img src="/blog/assets/post_cont_image/pandas_ex63_formula.png" alt="Pandas_ex63_formular" /></p>

<p>So now we can proceed with the <code class="language-plaintext highlighter-rouge">apply</code> function and lambda expression. We set the <code class="language-plaintext highlighter-rouge">axis</code> to <code class="language-plaintext highlighter-rouge">0</code> since we are normalizing column-wise and with the lambda expression we do the calculation according to the formula above.</p>

<h4>Q2</h4>

<div class="language-python highlighter-rouge"><div class="highlight"><pre class="highlight"><code><span class="n">the_dataframe</span><span class="p">.</span><span class="nb">apply</span><span class="p">(</span><span class="k">lambda</span> <span class="n">x</span><span class="p">:</span> <span class="p">(</span><span class="n">x</span><span class="p">.</span><span class="nb">max</span><span class="p">()</span> <span class="o">-</span> <span class="n">x</span><span class="p">)</span><span class="o">/</span><span class="p">(</span><span class="n">x</span><span class="p">.</span><span class="nb">max</span><span class="p">()</span><span class="o">-</span><span class="n">x</span><span class="p">.</span><span class="nb">min</span><span class="p">()),</span><span class="n">axis</span><span class="o">=</span><span class="mi">0</span><span class="p">)</span>
</code></pre></div></div>

<div>
<style scoped="">
    .dataframe tbody tr th:only-of-type {
        vertical-align: middle;
    }

    .dataframe tbody tr th {
        vertical-align: top;
    }

    .dataframe thead th {
        text-align: right;
    }
</style>
<table border="1" class="dataframe">
  <thead>
    <tr style="text-align: right;">
      <th></th>
      <th>0</th>
      <th>1</th>
      <th>2</th>
      <th>3</th>
      <th>4</th>
      <th>5</th>
      <th>6</th>
      <th>7</th>
      <th>8</th>
      <th>9</th>
    </tr>
  </thead>
  <tbody>
    <tr>
      <th>0</th>
      <td>0.428571</td>
      <td>0.000000</td>
      <td>0.865169</td>
      <td>0.000000</td>
      <td>0.250000</td>
      <td>0.784091</td>
      <td>0.138889</td>
      <td>0.022989</td>
      <td>0.136364</td>
      <td>0.188889</td>
    </tr>
    <tr>
      <th>1</th>
      <td>0.000000</td>
      <td>0.758242</td>
      <td>1.000000</td>
      <td>0.724638</td>
      <td>0.355263</td>
      <td>1.000000</td>
      <td>0.069444</td>
      <td>0.678161</td>
      <td>0.696970</td>
      <td>1.000000</td>
    </tr>
    <tr>
      <th>2</th>
      <td>0.285714</td>
      <td>0.362637</td>
      <td>0.797753</td>
      <td>0.565217</td>
      <td>0.052632</td>
      <td>0.363636</td>
      <td>0.986111</td>
      <td>0.000000</td>
      <td>0.530303</td>
      <td>0.011111</td>
    </tr>
    <tr>
      <th>3</th>
      <td>0.345238</td>
      <td>0.560440</td>
      <td>0.000000</td>
      <td>0.173913</td>
      <td>0.000000</td>
      <td>0.852273</td>
      <td>0.430556</td>
      <td>0.310345</td>
      <td>0.560606</td>
      <td>0.333333</td>
    </tr>
    <tr>
      <th>4</th>
      <td>0.440476</td>
      <td>0.417582</td>
      <td>0.314607</td>
      <td>1.000000</td>
      <td>0.381579</td>
      <td>0.943182</td>
      <td>1.000000</td>
      <td>0.183908</td>
      <td>0.681818</td>
      <td>0.822222</td>
    </tr>
    <tr>
      <th>5</th>
      <td>1.000000</td>
      <td>0.043956</td>
      <td>0.359551</td>
      <td>0.840580</td>
      <td>0.934211</td>
      <td>0.000000</td>
      <td>0.555556</td>
      <td>1.000000</td>
      <td>0.000000</td>
      <td>0.000000</td>
    </tr>
    <tr>
      <th>6</th>
      <td>0.333333</td>
      <td>0.241758</td>
      <td>0.539326</td>
      <td>0.927536</td>
      <td>0.434211</td>
      <td>0.625000</td>
      <td>0.208333</td>
      <td>0.091954</td>
      <td>0.727273</td>
      <td>0.466667</td>
    </tr>
    <tr>
      <th>7</th>
      <td>1.000000</td>
      <td>1.000000</td>
      <td>0.966292</td>
      <td>0.260870</td>
      <td>1.000000</td>
      <td>0.409091</td>
      <td>0.000000</td>
      <td>0.298851</td>
      <td>1.000000</td>
      <td>0.022222</td>
    </tr>
  </tbody>
</table>
</div>

<p>To change the values in the dataframe to put them on a scale of <code class="language-plaintext highlighter-rouge">0</code> to <code class="language-plaintext highlighter-rouge">1</code> we use the following formula<code class="language-plaintext highlighter-rouge">MAX - Z / MAX - MIN</code> and do the same as we did in Q1.</p>

<h3>Ex 64: How to compute the correlation of each row with the succeeding row?</h3>

<p>Q: Compute the correlation of each row with its previous row, round the result by 2.</p>

<div class="language-python highlighter-rouge"><div class="highlight"><pre class="highlight"><code><span class="n">np</span><span class="p">.</span><span class="n">random</span><span class="p">.</span><span class="n">seed</span><span class="p">(</span><span class="mi">42</span><span class="p">)</span>
<span class="n">the_dataframe</span> <span class="o">=</span> <span class="n">pd</span><span class="p">.</span><span class="n">DataFrame</span><span class="p">(</span><span class="n">np</span><span class="p">.</span><span class="n">random</span><span class="p">.</span><span class="n">randint</span><span class="p">(</span><span class="mi">1</span><span class="p">,</span><span class="mi">100</span><span class="p">,</span> <span class="mi">80</span><span class="p">).</span><span class="n">reshape</span><span class="p">(</span><span class="mi">8</span><span class="p">,</span> <span class="o">-</span><span class="mi">1</span><span class="p">))</span>
</code></pre></div></div>

<h4>Desired output</h4>

<div class="language-python highlighter-rouge"><div class="highlight"><pre class="highlight"><code><span class="c1"># [0.31, -0.14, -0.15, 0.47, -0.32, -0.07, 0.12]
</span></code></pre></div></div>

<h4>Solution</h4>

<div class="language-python highlighter-rouge"><div class="highlight"><pre class="highlight"><code><span class="p">[</span><span class="n">the_dataframe</span><span class="p">.</span><span class="n">iloc</span><span class="p">[</span><span class="n">i</span><span class="p">].</span><span class="n">corr</span><span class="p">(</span><span class="n">the_dataframe</span><span class="p">.</span><span class="n">iloc</span><span class="p">[</span><span class="n">i</span><span class="o">+</span><span class="mi">1</span><span class="p">]).</span><span class="nb">round</span><span class="p">(</span><span class="mi">2</span><span class="p">)</span> <span class="k">for</span> <span class="n">i</span> <span class="ow">in</span> <span class="nb">range</span><span class="p">(</span><span class="n">the_dataframe</span><span class="p">.</span><span class="n">shape</span><span class="p">[</span><span class="mi">0</span><span class="p">]</span><span class="o">-</span><span class="mi">1</span><span class="p">)]</span>
</code></pre></div></div>

<div class="language-plaintext highlighter-rouge"><div class="highlight"><pre class="highlight"><code>[0.31, -0.14, -0.15, 0.47, -0.32, -0.07, 0.12]
</code></pre></div></div>

<p>We first loop through the range of the number of rows in the dataframe using <code class="language-plaintext highlighter-rouge">shape</code> function (excluding the last row because we are comparing a pair of rows). We then call the <code class="language-plaintext highlighter-rouge">corr</code> function on each row using the <code class="language-plaintext highlighter-rouge">iloc</code> function and pass in the <code class="language-plaintext highlighter-rouge">corr</code> function the next row location by adding <code class="language-plaintext highlighter-rouge">1</code> to <code class="language-plaintext highlighter-rouge">i</code>. Finally, we round the result by two decimal point and place it in a list comprehension.</p>

<h3>Ex 65:  How to replace both the diagonals of dataframe with 0?</h3>

<p>Q: Replace both values in both diagonals of <code class="language-plaintext highlighter-rouge">the_dataframe</code> with 0.</p>

<div class="language-python highlighter-rouge"><div class="highlight"><pre class="highlight"><code><span class="n">np</span><span class="p">.</span><span class="n">random</span><span class="p">.</span><span class="n">seed</span><span class="p">(</span><span class="mi">42</span><span class="p">)</span>
<span class="n">the_dataframe</span> <span class="o">=</span> <span class="n">pd</span><span class="p">.</span><span class="n">DataFrame</span><span class="p">(</span><span class="n">np</span><span class="p">.</span><span class="n">random</span><span class="p">.</span><span class="n">randint</span><span class="p">(</span><span class="mi">1</span><span class="p">,</span><span class="mi">100</span><span class="p">,</span> <span class="mi">100</span><span class="p">).</span><span class="n">reshape</span><span class="p">(</span><span class="mi">10</span><span class="p">,</span> <span class="o">-</span><span class="mi">1</span><span class="p">))</span>
</code></pre></div></div>

<h4>Desired output</h4>

<p><img src="/blog/assets/post_cont_image/pandas_ex65.png" alt="Pandas_ex65" /></p>

<h4>Solution</h4>

<div class="language-python highlighter-rouge"><div class="highlight"><pre class="highlight"><code><span class="k">for</span> <span class="n">i</span> <span class="ow">in</span> <span class="nb">range</span><span class="p">(</span><span class="n">the_dataframe</span><span class="p">.</span><span class="n">shape</span><span class="p">[</span><span class="mi">0</span><span class="p">]):</span>
    <span class="n">the_dataframe</span><span class="p">.</span><span class="n">iat</span><span class="p">[</span><span class="n">i</span><span class="p">,</span><span class="n">i</span><span class="p">]</span> <span class="o">=</span> <span class="mi">0</span>
    <span class="n">the_dataframe</span><span class="p">.</span><span class="n">iat</span><span class="p">[</span><span class="n">the_dataframe</span><span class="p">.</span><span class="n">shape</span><span class="p">[</span><span class="mi">0</span><span class="p">]</span><span class="o">-</span><span class="n">i</span><span class="o">-</span><span class="mi">1</span><span class="p">,</span><span class="n">i</span><span class="p">]</span> <span class="o">=</span> <span class="mi">0</span>
</code></pre></div></div>

<div class="language-python highlighter-rouge"><div class="highlight"><pre class="highlight"><code><span class="n">the_dataframe</span>
</code></pre></div></div>

<div>
<style scoped="">
    .dataframe tbody tr th:only-of-type {
        vertical-align: middle;
    }

    .dataframe tbody tr th {
        vertical-align: top;
    }

    .dataframe thead th {
        text-align: right;
    }
</style>
<table border="1" class="dataframe">
  <thead>
    <tr style="text-align: right;">
      <th></th>
      <th>0</th>
      <th>1</th>
      <th>2</th>
      <th>3</th>
      <th>4</th>
      <th>5</th>
      <th>6</th>
      <th>7</th>
      <th>8</th>
      <th>9</th>
    </tr>
  </thead>
  <tbody>
    <tr>
      <th>0</th>
      <td>0</td>
      <td>93</td>
      <td>15</td>
      <td>72</td>
      <td>61</td>
      <td>21</td>
      <td>83</td>
      <td>87</td>
      <td>75</td>
      <td>0</td>
    </tr>
    <tr>
      <th>1</th>
      <td>88</td>
      <td>0</td>
      <td>3</td>
      <td>22</td>
      <td>53</td>
      <td>2</td>
      <td>88</td>
      <td>30</td>
      <td>0</td>
      <td>2</td>
    </tr>
    <tr>
      <th>2</th>
      <td>64</td>
      <td>60</td>
      <td>0</td>
      <td>33</td>
      <td>76</td>
      <td>58</td>
      <td>22</td>
      <td>0</td>
      <td>49</td>
      <td>91</td>
    </tr>
    <tr>
      <th>3</th>
      <td>59</td>
      <td>42</td>
      <td>92</td>
      <td>0</td>
      <td>80</td>
      <td>15</td>
      <td>0</td>
      <td>62</td>
      <td>47</td>
      <td>62</td>
    </tr>
    <tr>
      <th>4</th>
      <td>51</td>
      <td>55</td>
      <td>64</td>
      <td>3</td>
      <td>0</td>
      <td>0</td>
      <td>21</td>
      <td>73</td>
      <td>39</td>
      <td>18</td>
    </tr>
    <tr>
      <th>5</th>
      <td>4</td>
      <td>89</td>
      <td>60</td>
      <td>14</td>
      <td>0</td>
      <td>0</td>
      <td>53</td>
      <td>2</td>
      <td>84</td>
      <td>92</td>
    </tr>
    <tr>
      <th>6</th>
      <td>60</td>
      <td>71</td>
      <td>44</td>
      <td>0</td>
      <td>47</td>
      <td>35</td>
      <td>0</td>
      <td>81</td>
      <td>36</td>
      <td>50</td>
    </tr>
    <tr>
      <th>7</th>
      <td>4</td>
      <td>2</td>
      <td>0</td>
      <td>54</td>
      <td>4</td>
      <td>54</td>
      <td>93</td>
      <td>0</td>
      <td>18</td>
      <td>90</td>
    </tr>
    <tr>
      <th>8</th>
      <td>44</td>
      <td>0</td>
      <td>74</td>
      <td>62</td>
      <td>14</td>
      <td>95</td>
      <td>48</td>
      <td>15</td>
      <td>0</td>
      <td>78</td>
    </tr>
    <tr>
      <th>9</th>
      <td>0</td>
      <td>62</td>
      <td>40</td>
      <td>85</td>
      <td>80</td>
      <td>82</td>
      <td>53</td>
      <td>24</td>
      <td>26</td>
      <td>0</td>
    </tr>
  </tbody>
</table>
</div>

<p>We are going to fill both diagonal (right-to-left and left-to-right) with 0. There is a NumPy function called <code class="language-plaintext highlighter-rouge">fill_diagnol</code> to replace values on the left-to-right diagonal but the issue with this function is that it does not replace the right-to-left diagonal as well. We can’t use this function, therefore.</p>

<p>To solve this challenge, we first loop through rows in the dataframe and then for each loop we are to replace two elements at a specific position with <code class="language-plaintext highlighter-rouge">0</code> row-wise.  For the left-to-right diagonal, we use the <code class="language-plaintext highlighter-rouge">iat</code> function which takes in at the first position index the row number and at the second position the column number, we use <code class="language-plaintext highlighter-rouge">i</code> for both positions. For the right-to-left diagonal, we use the <code class="language-plaintext highlighter-rouge">iat</code> function again but this time the first position we calculate the total number rows in the dataframe minus <code class="language-plaintext highlighter-rouge">i</code> (as <code class="language-plaintext highlighter-rouge">i</code> changes because of the loop) minus <code class="language-plaintext highlighter-rouge">1</code> because indexes start from 0 and for the second position corresponding to the columns we use <code class="language-plaintext highlighter-rouge">i</code>.</p>

<h3>Ex 66: How to get the particular group of a groupby dataframe by key?</h3>

<p>Q: This is a question related to the understanding of grouped dataframe. From <code class="language-plaintext highlighter-rouge">df_grouped</code>, get the group belonging to <code class="language-plaintext highlighter-rouge">apple</code> as a dataframe.</p>

<div class="language-python highlighter-rouge"><div class="highlight"><pre class="highlight"><code><span class="n">np</span><span class="p">.</span><span class="n">random</span><span class="p">.</span><span class="n">seed</span><span class="p">(</span><span class="mi">42</span><span class="p">)</span>
<span class="n">the_dataframe</span> <span class="o">=</span> <span class="n">pd</span><span class="p">.</span><span class="n">DataFrame</span><span class="p">({</span><span class="s">'col1'</span><span class="p">:</span> <span class="p">[</span><span class="s">'apple'</span><span class="p">,</span> <span class="s">'banana'</span><span class="p">,</span> <span class="s">'orange'</span><span class="p">]</span> <span class="o">*</span> <span class="mi">3</span><span class="p">,</span>
                   <span class="s">'col2'</span><span class="p">:</span> <span class="n">np</span><span class="p">.</span><span class="n">random</span><span class="p">.</span><span class="n">rand</span><span class="p">(</span><span class="mi">9</span><span class="p">),</span>
                   <span class="s">'col3'</span><span class="p">:</span> <span class="n">np</span><span class="p">.</span><span class="n">random</span><span class="p">.</span><span class="n">randint</span><span class="p">(</span><span class="mi">0</span><span class="p">,</span> <span class="mi">15</span><span class="p">,</span> <span class="mi">9</span><span class="p">)})</span>

<span class="n">df_grouped</span> <span class="o">=</span> <span class="n">the_dataframe</span><span class="p">.</span><span class="n">groupby</span><span class="p">([</span><span class="s">'col1'</span><span class="p">])</span>
</code></pre></div></div>

<div class="language-python highlighter-rouge"><div class="highlight"><pre class="highlight"><code><span class="n">the_dataframe</span>
</code></pre></div></div>

<div>
<style scoped="">
    .dataframe tbody tr th:only-of-type {
        vertical-align: middle;
    }

    .dataframe tbody tr th {
        vertical-align: top;
    }

    .dataframe thead th {
        text-align: right;
    }
</style>
<table border="1" class="dataframe">
  <thead>
    <tr style="text-align: right;">
      <th></th>
      <th>col1</th>
      <th>col2</th>
      <th>col3</th>
    </tr>
  </thead>
  <tbody>
    <tr>
      <th>0</th>
      <td>apple</td>
      <td>0.374540</td>
      <td>7</td>
    </tr>
    <tr>
      <th>1</th>
      <td>banana</td>
      <td>0.950714</td>
      <td>2</td>
    </tr>
    <tr>
      <th>2</th>
      <td>orange</td>
      <td>0.731994</td>
      <td>5</td>
    </tr>
    <tr>
      <th>3</th>
      <td>apple</td>
      <td>0.598658</td>
      <td>4</td>
    </tr>
    <tr>
      <th>4</th>
      <td>banana</td>
      <td>0.156019</td>
      <td>1</td>
    </tr>
    <tr>
      <th>5</th>
      <td>orange</td>
      <td>0.155995</td>
      <td>7</td>
    </tr>
    <tr>
      <th>6</th>
      <td>apple</td>
      <td>0.058084</td>
      <td>11</td>
    </tr>
    <tr>
      <th>7</th>
      <td>banana</td>
      <td>0.866176</td>
      <td>13</td>
    </tr>
    <tr>
      <th>8</th>
      <td>orange</td>
      <td>0.601115</td>
      <td>5</td>
    </tr>
  </tbody>
</table>
</div>

<div class="language-python highlighter-rouge"><div class="highlight"><pre class="highlight"><code><span class="n">df_grouped</span>
</code></pre></div></div>

<div class="language-plaintext highlighter-rouge"><div class="highlight"><pre class="highlight"><code>&lt;pandas.core.groupby.generic.DataFrameGroupBy object at 0x7fd121fc30d0&gt;
</code></pre></div></div>

<h4>Desired output</h4>

<div class="language-python highlighter-rouge"><div class="highlight"><pre class="highlight"><code><span class="c1">#     col1      col2  col3
# 0  apple  0.374540     7
# 3  apple  0.598658     4
# 6  apple  0.058084    11
</span></code></pre></div></div>

<h4>Solution</h4>

<h4>1st Method</h4>

<div class="language-python highlighter-rouge"><div class="highlight"><pre class="highlight"><code><span class="n">df_grouped</span><span class="p">.</span><span class="n">get_group</span><span class="p">(</span><span class="s">"apple"</span><span class="p">)</span>
</code></pre></div></div>

<div>
<style scoped="">
    .dataframe tbody tr th:only-of-type {
        vertical-align: middle;
    }

    .dataframe tbody tr th {
        vertical-align: top;
    }

    .dataframe thead th {
        text-align: right;
    }
</style>
<table border="1" class="dataframe">
  <thead>
    <tr style="text-align: right;">
      <th></th>
      <th>col1</th>
      <th>col2</th>
      <th>col3</th>
    </tr>
  </thead>
  <tbody>
    <tr>
      <th>0</th>
      <td>apple</td>
      <td>0.374540</td>
      <td>7</td>
    </tr>
    <tr>
      <th>3</th>
      <td>apple</td>
      <td>0.598658</td>
      <td>4</td>
    </tr>
    <tr>
      <th>6</th>
      <td>apple</td>
      <td>0.058084</td>
      <td>11</td>
    </tr>
  </tbody>
</table>
</div>

<p>To get the group belonging to <code class="language-plaintext highlighter-rouge">apple</code> we call <code class="language-plaintext highlighter-rouge">get_group</code> on the <code class="language-plaintext highlighter-rouge">df_grouped</code>.</p>

<h4>2nd Method</h4>

<div class="language-python highlighter-rouge"><div class="highlight"><pre class="highlight"><code><span class="k">for</span> <span class="n">i</span><span class="p">,</span> <span class="n">grp_val</span> <span class="ow">in</span> <span class="n">df_grouped</span><span class="p">:</span>
    <span class="k">if</span> <span class="n">i</span> <span class="o">==</span> <span class="s">"apple"</span><span class="p">:</span>
        <span class="k">print</span><span class="p">(</span><span class="n">grp_val</span><span class="p">)</span>
</code></pre></div></div>

<div class="language-plaintext highlighter-rouge"><div class="highlight"><pre class="highlight"><code>    col1      col2  col3
0  apple  0.374540     7
3  apple  0.598658     4
6  apple  0.058084    11
</code></pre></div></div>

<p>Alternatively, we loop through all the elements in <code class="language-plaintext highlighter-rouge">df_grouped</code> and use the if statement to print the columns in the <code class="language-plaintext highlighter-rouge">apple</code> group.</p>

<h3>Ex 67: How to get the nth largest value of a column when grouped by another column?</h3>

<p>Q: In <code class="language-plaintext highlighter-rouge">the_dataframe</code>, find the second largest value of <code class="language-plaintext highlighter-rouge">taste</code> for <code class="language-plaintext highlighter-rouge">banana</code>.</p>

<div class="language-python highlighter-rouge"><div class="highlight"><pre class="highlight"><code><span class="n">np</span><span class="p">.</span><span class="n">random</span><span class="p">.</span><span class="n">seed</span><span class="p">(</span><span class="mi">42</span><span class="p">)</span>
<span class="n">the_dataframe</span> <span class="o">=</span> <span class="n">pd</span><span class="p">.</span><span class="n">DataFrame</span><span class="p">({</span><span class="s">'fruit'</span><span class="p">:</span> <span class="p">[</span><span class="s">'apple'</span><span class="p">,</span> <span class="s">'banana'</span><span class="p">,</span> <span class="s">'orange'</span><span class="p">]</span> <span class="o">*</span> <span class="mi">3</span><span class="p">,</span>
                   <span class="s">'taste'</span><span class="p">:</span> <span class="n">np</span><span class="p">.</span><span class="n">random</span><span class="p">.</span><span class="n">rand</span><span class="p">(</span><span class="mi">9</span><span class="p">),</span>
                   <span class="s">'price'</span><span class="p">:</span> <span class="n">np</span><span class="p">.</span><span class="n">random</span><span class="p">.</span><span class="n">randint</span><span class="p">(</span><span class="mi">0</span><span class="p">,</span> <span class="mi">15</span><span class="p">,</span> <span class="mi">9</span><span class="p">)})</span>
</code></pre></div></div>

<h4>Desired output</h4>

<div class="language-python highlighter-rouge"><div class="highlight"><pre class="highlight"><code><span class="c1"># 0.8661761457749352
</span></code></pre></div></div>

<h4>Solution</h4>

<div class="language-python highlighter-rouge"><div class="highlight"><pre class="highlight"><code><span class="n">the_dataframe</span>
</code></pre></div></div>

<div>
<style scoped="">
    .dataframe tbody tr th:only-of-type {
        vertical-align: middle;
    }

    .dataframe tbody tr th {
        vertical-align: top;
    }

    .dataframe thead th {
        text-align: right;
    }
</style>
<table border="1" class="dataframe">
  <thead>
    <tr style="text-align: right;">
      <th></th>
      <th>fruit</th>
      <th>taste</th>
      <th>price</th>
    </tr>
  </thead>
  <tbody>
    <tr>
      <th>0</th>
      <td>apple</td>
      <td>0.374540</td>
      <td>7</td>
    </tr>
    <tr>
      <th>1</th>
      <td>banana</td>
      <td>0.950714</td>
      <td>2</td>
    </tr>
    <tr>
      <th>2</th>
      <td>orange</td>
      <td>0.731994</td>
      <td>5</td>
    </tr>
    <tr>
      <th>3</th>
      <td>apple</td>
      <td>0.598658</td>
      <td>4</td>
    </tr>
    <tr>
      <th>4</th>
      <td>banana</td>
      <td>0.156019</td>
      <td>1</td>
    </tr>
    <tr>
      <th>5</th>
      <td>orange</td>
      <td>0.155995</td>
      <td>7</td>
    </tr>
    <tr>
      <th>6</th>
      <td>apple</td>
      <td>0.058084</td>
      <td>11</td>
    </tr>
    <tr>
      <th>7</th>
      <td>banana</td>
      <td>0.866176</td>
      <td>13</td>
    </tr>
    <tr>
      <th>8</th>
      <td>orange</td>
      <td>0.601115</td>
      <td>5</td>
    </tr>
  </tbody>
</table>
</div>

<div class="language-python highlighter-rouge"><div class="highlight"><pre class="highlight"><code><span class="n">df_grouped</span> <span class="o">=</span> <span class="n">the_dataframe</span><span class="p">.</span><span class="n">groupby</span><span class="p">(</span><span class="n">by</span><span class="o">=</span><span class="s">"fruit"</span><span class="p">)</span>
</code></pre></div></div>

<div class="language-python highlighter-rouge"><div class="highlight"><pre class="highlight"><code><span class="nb">sorted</span><span class="p">(</span><span class="n">df_grouped</span><span class="p">.</span><span class="n">get_group</span><span class="p">(</span><span class="s">"banana"</span><span class="p">)[</span><span class="s">"taste"</span><span class="p">])[</span><span class="o">-</span><span class="mi">2</span><span class="p">]</span>
</code></pre></div></div>

<div class="language-plaintext highlighter-rouge"><div class="highlight"><pre class="highlight"><code>0.8661761457749352
</code></pre></div></div>

<p>Just like we did in the previous exercise, we first group the dataframe using the values in the <code class="language-plaintext highlighter-rouge">fruit</code> column and store it in <code class="language-plaintext highlighter-rouge">df_grouped</code>. Then we get <code class="language-plaintext highlighter-rouge">taste</code> column for <code class="language-plaintext highlighter-rouge">banana</code> using <code class="language-plaintext highlighter-rouge">get_group</code> function and sort it out. Finally, to get the second largest element, we use indexing <code class="language-plaintext highlighter-rouge">[-2]</code>.</p>

<h3>Ex 68: How to compute grouped mean on pandas DataFrame and keep the grouped column as another column (not index)?</h3>

<p>Q: In <code class="language-plaintext highlighter-rouge">the_dataframe</code>, Compute the mean price of every fruit, while keeping the fruit as another column instead of an index.</p>

<div class="language-python highlighter-rouge"><div class="highlight"><pre class="highlight"><code><span class="n">np</span><span class="p">.</span><span class="n">random</span><span class="p">.</span><span class="n">seed</span><span class="p">(</span><span class="mi">42</span><span class="p">)</span>
<span class="n">the_dataframe</span> <span class="o">=</span> <span class="n">pd</span><span class="p">.</span><span class="n">DataFrame</span><span class="p">({</span><span class="s">'fruit'</span><span class="p">:</span> <span class="p">[</span><span class="s">'apple'</span><span class="p">,</span> <span class="s">'banana'</span><span class="p">,</span> <span class="s">'orange'</span><span class="p">]</span> <span class="o">*</span> <span class="mi">3</span><span class="p">,</span>
                   <span class="s">'taste'</span><span class="p">:</span> <span class="n">np</span><span class="p">.</span><span class="n">random</span><span class="p">.</span><span class="n">rand</span><span class="p">(</span><span class="mi">9</span><span class="p">),</span>
                   <span class="s">'price'</span><span class="p">:</span> <span class="n">np</span><span class="p">.</span><span class="n">random</span><span class="p">.</span><span class="n">randint</span><span class="p">(</span><span class="mi">0</span><span class="p">,</span> <span class="mi">15</span><span class="p">,</span> <span class="mi">9</span><span class="p">)})</span>
</code></pre></div></div>

<h4>Desired output</h4>

<p><img src="/blog/assets/post_cont_image/pandas_ex69.png" alt="Pandas_ex69" /></p>

<h4>Solution</h4>

<h4>1st Method</h4>

<div class="language-python highlighter-rouge"><div class="highlight"><pre class="highlight"><code><span class="n">the_dataframe</span><span class="p">.</span><span class="n">groupby</span><span class="p">(</span><span class="n">by</span><span class="o">=</span><span class="s">"fruit"</span><span class="p">).</span><span class="n">mean</span><span class="p">()[</span><span class="s">"price"</span><span class="p">].</span><span class="n">reset_index</span><span class="p">()</span>
</code></pre></div></div>

<div>
<style scoped="">
    .dataframe tbody tr th:only-of-type {
        vertical-align: middle;
    }

    .dataframe tbody tr th {
        vertical-align: top;
    }

    .dataframe thead th {
        text-align: right;
    }
</style>
<table border="1" class="dataframe">
  <thead>
    <tr style="text-align: right;">
      <th></th>
      <th>fruit</th>
      <th>price</th>
    </tr>
  </thead>
  <tbody>
    <tr>
      <th>0</th>
      <td>apple</td>
      <td>7.333333</td>
    </tr>
    <tr>
      <th>1</th>
      <td>banana</td>
      <td>5.333333</td>
    </tr>
    <tr>
      <th>2</th>
      <td>orange</td>
      <td>5.666667</td>
    </tr>
  </tbody>
</table>
</div>

<p>The most straightforward way to go about this exercise is to group the dataframe by <code class="language-plaintext highlighter-rouge">fruit</code> and get the mean of the numerical columns grouped by <code class="language-plaintext highlighter-rouge">price</code> and reset the index using <code class="language-plaintext highlighter-rouge">reset_index</code> which will change the index from <code class="language-plaintext highlighter-rouge">fruit</code> column to regular ascending numerical index.</p>

<h4>2nd Method</h4>

<div class="language-python highlighter-rouge"><div class="highlight"><pre class="highlight"><code><span class="n">the_dataframe</span><span class="p">.</span><span class="n">groupby</span><span class="p">(</span><span class="n">by</span><span class="o">=</span><span class="s">"fruit"</span><span class="p">,</span><span class="n">as_index</span><span class="o">=</span><span class="bp">False</span><span class="p">)[</span><span class="s">"price"</span><span class="p">].</span><span class="n">mean</span><span class="p">()</span>
</code></pre></div></div>

<div>
<style scoped="">
    .dataframe tbody tr th:only-of-type {
        vertical-align: middle;
    }

    .dataframe tbody tr th {
        vertical-align: top;
    }

    .dataframe thead th {
        text-align: right;
    }
</style>
<table border="1" class="dataframe">
  <thead>
    <tr style="text-align: right;">
      <th></th>
      <th>fruit</th>
      <th>price</th>
    </tr>
  </thead>
  <tbody>
    <tr>
      <th>0</th>
      <td>apple</td>
      <td>7.333333</td>
    </tr>
    <tr>
      <th>1</th>
      <td>banana</td>
      <td>5.333333</td>
    </tr>
    <tr>
      <th>2</th>
      <td>orange</td>
      <td>5.666667</td>
    </tr>
  </tbody>
</table>
</div>

<p>Alternatively, we can reset the index using the <code class="language-plaintext highlighter-rouge">as_index</code> parameter from the <code class="language-plaintext highlighter-rouge">groupby</code> function.</p>

<h3>Ex 69: How to join two DataFrames by 2 columns so that they have only the common rows?</h3>

<p>Q: Join dataframes <code class="language-plaintext highlighter-rouge">the_dataframe_1</code> and <code class="language-plaintext highlighter-rouge">the_dataframe_2</code> by <code class="language-plaintext highlighter-rouge">fruit-pazham</code> and <code class="language-plaintext highlighter-rouge">weight-kilo</code>.</p>

<div class="language-python highlighter-rouge"><div class="highlight"><pre class="highlight"><code><span class="n">the_dataframe_1</span> <span class="o">=</span> <span class="n">pd</span><span class="p">.</span><span class="n">DataFrame</span><span class="p">({</span><span class="s">'fruit'</span><span class="p">:</span> <span class="p">[</span><span class="s">'apple'</span><span class="p">,</span> <span class="s">'banana'</span><span class="p">,</span> <span class="s">'orange'</span><span class="p">]</span> <span class="o">*</span> <span class="mi">3</span><span class="p">,</span>
                    <span class="s">'weight'</span><span class="p">:</span> <span class="p">[</span><span class="s">'high'</span><span class="p">,</span> <span class="s">'medium'</span><span class="p">,</span> <span class="s">'low'</span><span class="p">]</span> <span class="o">*</span> <span class="mi">3</span><span class="p">,</span>
                    <span class="s">'price'</span><span class="p">:</span> <span class="n">np</span><span class="p">.</span><span class="n">random</span><span class="p">.</span><span class="n">randint</span><span class="p">(</span><span class="mi">0</span><span class="p">,</span> <span class="mi">15</span><span class="p">,</span> <span class="mi">9</span><span class="p">)})</span>

<span class="n">the_dataframe_2</span> <span class="o">=</span> <span class="n">pd</span><span class="p">.</span><span class="n">DataFrame</span><span class="p">({</span><span class="s">'pazham'</span><span class="p">:</span> <span class="p">[</span><span class="s">'apple'</span><span class="p">,</span> <span class="s">'orange'</span><span class="p">,</span> <span class="s">'pine'</span><span class="p">]</span> <span class="o">*</span> <span class="mi">2</span><span class="p">,</span>
                    <span class="s">'kilo'</span><span class="p">:</span> <span class="p">[</span><span class="s">'high'</span><span class="p">,</span> <span class="s">'low'</span><span class="p">]</span> <span class="o">*</span> <span class="mi">3</span><span class="p">,</span>
                    <span class="s">'price'</span><span class="p">:</span> <span class="n">np</span><span class="p">.</span><span class="n">random</span><span class="p">.</span><span class="n">randint</span><span class="p">(</span><span class="mi">0</span><span class="p">,</span> <span class="mi">15</span><span class="p">,</span> <span class="mi">6</span><span class="p">)})</span>
</code></pre></div></div>

<h4>Desire output</h4>

<p><img src="/blog/assets/post_cont_image/pandas_ex69.png" alt="Pandas_ex69" /></p>

<h4>Solution</h4>

<div class="language-python highlighter-rouge"><div class="highlight"><pre class="highlight"><code><span class="n">the_dataframe_1</span>
</code></pre></div></div>

<div>
<style scoped="">
    .dataframe tbody tr th:only-of-type {
        vertical-align: middle;
    }

    .dataframe tbody tr th {
        vertical-align: top;
    }

    .dataframe thead th {
        text-align: right;
    }
</style>
<table border="1" class="dataframe">
  <thead>
    <tr style="text-align: right;">
      <th></th>
      <th>fruit</th>
      <th>weight</th>
      <th>price</th>
    </tr>
  </thead>
  <tbody>
    <tr>
      <th>0</th>
      <td>apple</td>
      <td>high</td>
      <td>1</td>
    </tr>
    <tr>
      <th>1</th>
      <td>banana</td>
      <td>medium</td>
      <td>11</td>
    </tr>
    <tr>
      <th>2</th>
      <td>orange</td>
      <td>low</td>
      <td>4</td>
    </tr>
    <tr>
      <th>3</th>
      <td>apple</td>
      <td>high</td>
      <td>0</td>
    </tr>
    <tr>
      <th>4</th>
      <td>banana</td>
      <td>medium</td>
      <td>11</td>
    </tr>
    <tr>
      <th>5</th>
      <td>orange</td>
      <td>low</td>
      <td>9</td>
    </tr>
    <tr>
      <th>6</th>
      <td>apple</td>
      <td>high</td>
      <td>5</td>
    </tr>
    <tr>
      <th>7</th>
      <td>banana</td>
      <td>medium</td>
      <td>12</td>
    </tr>
    <tr>
      <th>8</th>
      <td>orange</td>
      <td>low</td>
      <td>11</td>
    </tr>
  </tbody>
</table>
</div>

<div class="language-python highlighter-rouge"><div class="highlight"><pre class="highlight"><code><span class="n">the_dataframe_2</span>
</code></pre></div></div>

<div>
<style scoped="">
    .dataframe tbody tr th:only-of-type {
        vertical-align: middle;
    }

    .dataframe tbody tr th {
        vertical-align: top;
    }

    .dataframe thead th {
        text-align: right;
    }
</style>
<table border="1" class="dataframe">
  <thead>
    <tr style="text-align: right;">
      <th></th>
      <th>pazham</th>
      <th>kilo</th>
      <th>price</th>
    </tr>
  </thead>
  <tbody>
    <tr>
      <th>0</th>
      <td>apple</td>
      <td>high</td>
      <td>8</td>
    </tr>
    <tr>
      <th>1</th>
      <td>orange</td>
      <td>low</td>
      <td>0</td>
    </tr>
    <tr>
      <th>2</th>
      <td>pine</td>
      <td>high</td>
      <td>10</td>
    </tr>
    <tr>
      <th>3</th>
      <td>apple</td>
      <td>low</td>
      <td>10</td>
    </tr>
    <tr>
      <th>4</th>
      <td>orange</td>
      <td>high</td>
      <td>14</td>
    </tr>
    <tr>
      <th>5</th>
      <td>pine</td>
      <td>low</td>
      <td>9</td>
    </tr>
  </tbody>
</table>
</div>

<div class="language-python highlighter-rouge"><div class="highlight"><pre class="highlight"><code><span class="n">pd</span><span class="p">.</span><span class="n">merge</span><span class="p">(</span><span class="n">the_dataframe_1</span><span class="p">,</span> <span class="n">the_dataframe_2</span><span class="p">,</span> <span class="n">how</span><span class="o">=</span><span class="s">"inner"</span><span class="p">,</span> <span class="n">left_on</span><span class="o">=</span><span class="p">[</span><span class="s">"fruit"</span><span class="p">,</span><span class="s">"weight"</span><span class="p">],</span> <span class="n">right_on</span><span class="o">=</span><span class="p">[</span><span class="s">"pazham"</span><span class="p">,</span><span class="s">"kilo"</span><span class="p">],</span> <span class="n">suffixes</span><span class="o">=</span><span class="p">[</span><span class="s">"_left"</span><span class="p">,</span><span class="s">"_right"</span><span class="p">])</span>
</code></pre></div></div>

<div>
<style scoped="">
    .dataframe tbody tr th:only-of-type {
        vertical-align: middle;
    }

    .dataframe tbody tr th {
        vertical-align: top;
    }

    .dataframe thead th {
        text-align: right;
    }
</style>
<table border="1" class="dataframe">
  <thead>
    <tr style="text-align: right;">
      <th></th>
      <th>fruit</th>
      <th>weight</th>
      <th>price_left</th>
      <th>pazham</th>
      <th>kilo</th>
      <th>price_right</th>
    </tr>
  </thead>
  <tbody>
    <tr>
      <th>0</th>
      <td>apple</td>
      <td>high</td>
      <td>1</td>
      <td>apple</td>
      <td>high</td>
      <td>8</td>
    </tr>
    <tr>
      <th>1</th>
      <td>apple</td>
      <td>high</td>
      <td>0</td>
      <td>apple</td>
      <td>high</td>
      <td>8</td>
    </tr>
    <tr>
      <th>2</th>
      <td>apple</td>
      <td>high</td>
      <td>5</td>
      <td>apple</td>
      <td>high</td>
      <td>8</td>
    </tr>
    <tr>
      <th>3</th>
      <td>orange</td>
      <td>low</td>
      <td>4</td>
      <td>orange</td>
      <td>low</td>
      <td>0</td>
    </tr>
    <tr>
      <th>4</th>
      <td>orange</td>
      <td>low</td>
      <td>9</td>
      <td>orange</td>
      <td>low</td>
      <td>0</td>
    </tr>
    <tr>
      <th>5</th>
      <td>orange</td>
      <td>low</td>
      <td>11</td>
      <td>orange</td>
      <td>low</td>
      <td>0</td>
    </tr>
  </tbody>
</table>
</div>

<p>We use the <code class="language-plaintext highlighter-rouge">merge</code> to combine the two dataframes, and set <code class="language-plaintext highlighter-rouge">how</code> parameter to <code class="language-plaintext highlighter-rouge">inner</code> which means that we are only interested in rows with the same value in <code class="language-plaintext highlighter-rouge">fruit</code> and <code class="language-plaintext highlighter-rouge">weight</code> column on the left and <code class="language-plaintext highlighter-rouge">pazham</code> and <code class="language-plaintext highlighter-rouge">kilo</code> column on the right. Finally, we add suffix “_left” and “_right” on those columns.</p>

<h3>Ex 70: How to remove rows from a DataFrame that are present in another DataFrame?</h3>

<p>Q: From <code class="language-plaintext highlighter-rouge">the_dataframe_1</code>, remove the rows present in <code class="language-plaintext highlighter-rouge">the_dataframe_2</code>. All three columns values must be the same for the row to be drop.</p>

<div class="language-python highlighter-rouge"><div class="highlight"><pre class="highlight"><code><span class="n">np</span><span class="p">.</span><span class="n">random</span><span class="p">.</span><span class="n">seed</span><span class="p">(</span><span class="mi">42</span><span class="p">)</span>
<span class="n">the_dataframe_1</span> <span class="o">=</span> <span class="n">pd</span><span class="p">.</span><span class="n">DataFrame</span><span class="p">({</span><span class="s">'fruit'</span><span class="p">:</span> <span class="p">[</span><span class="s">'apple'</span><span class="p">,</span> <span class="s">'banana'</span><span class="p">,</span> <span class="s">'orange'</span><span class="p">]</span> <span class="o">*</span> <span class="mi">3</span><span class="p">,</span>
                    <span class="s">'weight'</span><span class="p">:</span> <span class="p">[</span><span class="s">'high'</span><span class="p">,</span> <span class="s">'medium'</span><span class="p">,</span> <span class="s">'low'</span><span class="p">]</span> <span class="o">*</span> <span class="mi">3</span><span class="p">,</span>
                    <span class="s">'price'</span><span class="p">:</span> <span class="n">np</span><span class="p">.</span><span class="n">random</span><span class="p">.</span><span class="n">randint</span><span class="p">(</span><span class="mi">0</span><span class="p">,</span> <span class="mi">15</span><span class="p">,</span> <span class="mi">9</span><span class="p">)})</span>

<span class="n">the_dataframe_2</span> <span class="o">=</span> <span class="n">pd</span><span class="p">.</span><span class="n">DataFrame</span><span class="p">({</span><span class="s">'pazham'</span><span class="p">:</span> <span class="p">[</span><span class="s">'apple'</span><span class="p">,</span> <span class="s">'orange'</span><span class="p">,</span> <span class="s">'pine'</span><span class="p">]</span> <span class="o">*</span> <span class="mi">2</span><span class="p">,</span>
                    <span class="s">'kilo'</span><span class="p">:</span> <span class="p">[</span><span class="s">'high'</span><span class="p">,</span> <span class="s">'low'</span><span class="p">]</span> <span class="o">*</span> <span class="mi">3</span><span class="p">,</span>
                    <span class="s">'price'</span><span class="p">:</span> <span class="n">np</span><span class="p">.</span><span class="n">random</span><span class="p">.</span><span class="n">randint</span><span class="p">(</span><span class="mi">0</span><span class="p">,</span> <span class="mi">15</span><span class="p">,</span> <span class="mi">6</span><span class="p">)})</span>
</code></pre></div></div>

<h4>Desired output</h4>

<p><img src="/blog/assets/post_cont_image/pandas_ex70.png" alt="Pandas_ex70" /></p>

<h4>Solution</h4>

<div class="language-python highlighter-rouge"><div class="highlight"><pre class="highlight"><code><span class="n">the_dataframe_1</span>
</code></pre></div></div>

<div>
<style scoped="">
    .dataframe tbody tr th:only-of-type {
        vertical-align: middle;
    }

    .dataframe tbody tr th {
        vertical-align: top;
    }

    .dataframe thead th {
        text-align: right;
    }
</style>
<table border="1" class="dataframe">
  <thead>
    <tr style="text-align: right;">
      <th></th>
      <th>fruit</th>
      <th>weight</th>
      <th>price</th>
    </tr>
  </thead>
  <tbody>
    <tr>
      <th>0</th>
      <td>apple</td>
      <td>high</td>
      <td>6</td>
    </tr>
    <tr>
      <th>1</th>
      <td>banana</td>
      <td>medium</td>
      <td>3</td>
    </tr>
    <tr>
      <th>2</th>
      <td>orange</td>
      <td>low</td>
      <td>12</td>
    </tr>
    <tr>
      <th>3</th>
      <td>apple</td>
      <td>high</td>
      <td>14</td>
    </tr>
    <tr>
      <th>4</th>
      <td>banana</td>
      <td>medium</td>
      <td>10</td>
    </tr>
    <tr>
      <th>5</th>
      <td>orange</td>
      <td>low</td>
      <td>7</td>
    </tr>
    <tr>
      <th>6</th>
      <td>apple</td>
      <td>high</td>
      <td>12</td>
    </tr>
    <tr>
      <th>7</th>
      <td>banana</td>
      <td>medium</td>
      <td>4</td>
    </tr>
    <tr>
      <th>8</th>
      <td>orange</td>
      <td>low</td>
      <td>6</td>
    </tr>
  </tbody>
</table>
</div>

<div class="language-python highlighter-rouge"><div class="highlight"><pre class="highlight"><code><span class="n">the_dataframe_2</span>
</code></pre></div></div>

<div>
<style scoped="">
    .dataframe tbody tr th:only-of-type {
        vertical-align: middle;
    }

    .dataframe tbody tr th {
        vertical-align: top;
    }

    .dataframe thead th {
        text-align: right;
    }
</style>
<table border="1" class="dataframe">
  <thead>
    <tr style="text-align: right;">
      <th></th>
      <th>pazham</th>
      <th>kilo</th>
      <th>price</th>
    </tr>
  </thead>
  <tbody>
    <tr>
      <th>0</th>
      <td>apple</td>
      <td>high</td>
      <td>9</td>
    </tr>
    <tr>
      <th>1</th>
      <td>orange</td>
      <td>low</td>
      <td>2</td>
    </tr>
    <tr>
      <th>2</th>
      <td>pine</td>
      <td>high</td>
      <td>6</td>
    </tr>
    <tr>
      <th>3</th>
      <td>apple</td>
      <td>low</td>
      <td>10</td>
    </tr>
    <tr>
      <th>4</th>
      <td>orange</td>
      <td>high</td>
      <td>10</td>
    </tr>
    <tr>
      <th>5</th>
      <td>pine</td>
      <td>low</td>
      <td>7</td>
    </tr>
  </tbody>
</table>
</div>

<div class="language-python highlighter-rouge"><div class="highlight"><pre class="highlight"><code><span class="n">the_dataframe_1</span><span class="p">[</span><span class="o">~</span><span class="n">the_dataframe_1</span><span class="p">.</span><span class="n">isin</span><span class="p">(</span><span class="n">the_dataframe_2</span><span class="p">).</span><span class="nb">all</span><span class="p">(</span><span class="n">axis</span><span class="o">=</span><span class="mi">1</span><span class="p">)]</span>
</code></pre></div></div>

<div>
<style scoped="">
    .dataframe tbody tr th:only-of-type {
        vertical-align: middle;
    }

    .dataframe tbody tr th {
        vertical-align: top;
    }

    .dataframe thead th {
        text-align: right;
    }
</style>
<table border="1" class="dataframe">
  <thead>
    <tr style="text-align: right;">
      <th></th>
      <th>fruit</th>
      <th>weight</th>
      <th>price</th>
    </tr>
  </thead>
  <tbody>
    <tr>
      <th>0</th>
      <td>apple</td>
      <td>high</td>
      <td>6</td>
    </tr>
    <tr>
      <th>1</th>
      <td>banana</td>
      <td>medium</td>
      <td>3</td>
    </tr>
    <tr>
      <th>2</th>
      <td>orange</td>
      <td>low</td>
      <td>12</td>
    </tr>
    <tr>
      <th>3</th>
      <td>apple</td>
      <td>high</td>
      <td>14</td>
    </tr>
    <tr>
      <th>4</th>
      <td>banana</td>
      <td>medium</td>
      <td>10</td>
    </tr>
    <tr>
      <th>5</th>
      <td>orange</td>
      <td>low</td>
      <td>7</td>
    </tr>
    <tr>
      <th>6</th>
      <td>apple</td>
      <td>high</td>
      <td>12</td>
    </tr>
    <tr>
      <th>7</th>
      <td>banana</td>
      <td>medium</td>
      <td>4</td>
    </tr>
    <tr>
      <th>8</th>
      <td>orange</td>
      <td>low</td>
      <td>6</td>
    </tr>
  </tbody>
</table>
</div>

<p>We first get the element in <code class="language-plaintext highlighter-rouge">the_dataframe_1</code> that are present in <code class="language-plaintext highlighter-rouge">the_dataframe_2</code> using the <code class="language-plaintext highlighter-rouge">isin</code> function. A new dataframe with boolean values will is return where <code class="language-plaintext highlighter-rouge">True</code> represent a similar value between <code class="language-plaintext highlighter-rouge">the_dataframe_1</code> and <code class="language-plaintext highlighter-rouge">the_dataframe_2</code> and <code class="language-plaintext highlighter-rouge">False</code> represent a different value. We use <code class="language-plaintext highlighter-rouge">all</code> to get an AND operator function between the boolean values row-wise(<code class="language-plaintext highlighter-rouge">axis</code> set to <code class="language-plaintext highlighter-rouge">1</code>). For example, in row 4, we’ll have “False” AND “False” AND “True” = “False”.</p>

<p>Finally, we use <code class="language-plaintext highlighter-rouge">~</code> to reverse all the boolean value (“False” becomes “True” and “True” becomes “False”) and use indexing into <code class="language-plaintext highlighter-rouge">the_dataframe_1</code>. We find out that we are keeping all the rows in <code class="language-plaintext highlighter-rouge">the_dataframe_1</code> meaning that no row that is identical in <code class="language-plaintext highlighter-rouge">the_dataframe_1</code> and <code class="language-plaintext highlighter-rouge">the_dataframe_2</code>.</p>

<h3>Ex 71: How to get the positions where values of two columns match?</h3>

<p>Q: Get the positions where values of two columns match</p>

<div class="language-python highlighter-rouge"><div class="highlight"><pre class="highlight"><code><span class="n">np</span><span class="p">.</span><span class="n">random</span><span class="p">.</span><span class="n">seed</span><span class="p">(</span><span class="mi">42</span><span class="p">)</span>
<span class="n">the_dataframe</span> <span class="o">=</span> <span class="n">pd</span><span class="p">.</span><span class="n">DataFrame</span><span class="p">({</span><span class="s">'fruit1'</span><span class="p">:</span> <span class="n">np</span><span class="p">.</span><span class="n">random</span><span class="p">.</span><span class="n">choice</span><span class="p">([</span><span class="s">'apple'</span><span class="p">,</span> <span class="s">'orange'</span><span class="p">,</span> <span class="s">'banana'</span><span class="p">],</span> <span class="mi">10</span><span class="p">),</span>
                    <span class="s">'fruit2'</span><span class="p">:</span> <span class="n">np</span><span class="p">.</span><span class="n">random</span><span class="p">.</span><span class="n">choice</span><span class="p">([</span><span class="s">'apple'</span><span class="p">,</span> <span class="s">'orange'</span><span class="p">,</span> <span class="s">'banana'</span><span class="p">],</span> <span class="mi">10</span><span class="p">)})</span>
<span class="n">the_dataframe</span>
</code></pre></div></div>

<div>
<style scoped="">
    .dataframe tbody tr th:only-of-type {
        vertical-align: middle;
    }

    .dataframe tbody tr th {
        vertical-align: top;
    }

    .dataframe thead th {
        text-align: right;
    }
</style>
<table border="1" class="dataframe">
  <thead>
    <tr style="text-align: right;">
      <th></th>
      <th>fruit1</th>
      <th>fruit2</th>
    </tr>
  </thead>
  <tbody>
    <tr>
      <th>0</th>
      <td>banana</td>
      <td>banana</td>
    </tr>
    <tr>
      <th>1</th>
      <td>apple</td>
      <td>banana</td>
    </tr>
    <tr>
      <th>2</th>
      <td>banana</td>
      <td>apple</td>
    </tr>
    <tr>
      <th>3</th>
      <td>banana</td>
      <td>banana</td>
    </tr>
    <tr>
      <th>4</th>
      <td>apple</td>
      <td>orange</td>
    </tr>
    <tr>
      <th>5</th>
      <td>apple</td>
      <td>apple</td>
    </tr>
    <tr>
      <th>6</th>
      <td>banana</td>
      <td>orange</td>
    </tr>
    <tr>
      <th>7</th>
      <td>orange</td>
      <td>orange</td>
    </tr>
    <tr>
      <th>8</th>
      <td>banana</td>
      <td>orange</td>
    </tr>
    <tr>
      <th>9</th>
      <td>banana</td>
      <td>orange</td>
    </tr>
  </tbody>
</table>
</div>

<h4>Desired output</h4>

<div class="language-python highlighter-rouge"><div class="highlight"><pre class="highlight"><code><span class="c1"># [0, 3, 5, 7]
</span></code></pre></div></div>

<h4>Solution</h4>

<h4>1st Method</h4>

<div class="language-python highlighter-rouge"><div class="highlight"><pre class="highlight"><code><span class="n">the_dataframe</span><span class="p">.</span><span class="n">where</span><span class="p">(</span><span class="n">the_dataframe</span><span class="p">[</span><span class="s">"fruit1"</span><span class="p">]</span> <span class="o">==</span> <span class="n">the_dataframe</span><span class="p">[</span><span class="s">"fruit2"</span><span class="p">])</span>
</code></pre></div></div>

<div>
<style scoped="">
    .dataframe tbody tr th:only-of-type {
        vertical-align: middle;
    }

    .dataframe tbody tr th {
        vertical-align: top;
    }

    .dataframe thead th {
        text-align: right;
    }
</style>
<table border="1" class="dataframe">
  <thead>
    <tr style="text-align: right;">
      <th></th>
      <th>fruit1</th>
      <th>fruit2</th>
    </tr>
  </thead>
  <tbody>
    <tr>
      <th>0</th>
      <td>banana</td>
      <td>banana</td>
    </tr>
    <tr>
      <th>1</th>
      <td>NaN</td>
      <td>NaN</td>
    </tr>
    <tr>
      <th>2</th>
      <td>NaN</td>
      <td>NaN</td>
    </tr>
    <tr>
      <th>3</th>
      <td>banana</td>
      <td>banana</td>
    </tr>
    <tr>
      <th>4</th>
      <td>NaN</td>
      <td>NaN</td>
    </tr>
    <tr>
      <th>5</th>
      <td>apple</td>
      <td>apple</td>
    </tr>
    <tr>
      <th>6</th>
      <td>NaN</td>
      <td>NaN</td>
    </tr>
    <tr>
      <th>7</th>
      <td>orange</td>
      <td>orange</td>
    </tr>
    <tr>
      <th>8</th>
      <td>NaN</td>
      <td>NaN</td>
    </tr>
    <tr>
      <th>9</th>
      <td>NaN</td>
      <td>NaN</td>
    </tr>
  </tbody>
</table>
</div>

<div class="language-python highlighter-rouge"><div class="highlight"><pre class="highlight"><code><span class="nb">list</span><span class="p">(</span><span class="n">the_dataframe</span><span class="p">.</span><span class="n">where</span><span class="p">(</span><span class="n">the_dataframe</span><span class="p">[</span><span class="s">"fruit1"</span><span class="p">]</span> <span class="o">==</span> <span class="n">the_dataframe</span><span class="p">[</span><span class="s">"fruit2"</span><span class="p">]).</span><span class="n">dropna</span><span class="p">().</span><span class="n">index</span><span class="p">)</span>
</code></pre></div></div>

<div class="language-plaintext highlighter-rouge"><div class="highlight"><pre class="highlight"><code>[0, 3, 5, 7]
</code></pre></div></div>

<p>We first call the <code class="language-plaintext highlighter-rouge">where</code> function the <code class="language-plaintext highlighter-rouge">the_dataframe</code> with the condition that we need to the same fruit in column <code class="language-plaintext highlighter-rouge">fruit1</code> and <code class="language-plaintext highlighter-rouge">fruit2</code>.  We get boolean values dataframe with the rows where the values are the same and <code class="language-plaintext highlighter-rouge">NaN</code> where the values are different. We drop <code class="language-plaintext highlighter-rouge">NaN</code> using <code class="language-plaintext highlighter-rouge">dropna</code> function and extract the indexes. Finally, place the array into a list et voila!</p>

<h4>2nd Method</h4>

<div class="language-python highlighter-rouge"><div class="highlight"><pre class="highlight"><code><span class="nb">list</span><span class="p">(</span><span class="n">np</span><span class="p">.</span><span class="n">where</span><span class="p">(</span><span class="n">the_dataframe</span><span class="p">[</span><span class="s">"fruit1"</span><span class="p">]</span> <span class="o">==</span> <span class="n">the_dataframe</span><span class="p">[</span><span class="s">"fruit2"</span><span class="p">])[</span><span class="mi">0</span><span class="p">])</span>
</code></pre></div></div>

<div class="language-plaintext highlighter-rouge"><div class="highlight"><pre class="highlight"><code>[0, 3, 5, 7]
</code></pre></div></div>

<div class="language-python highlighter-rouge"><div class="highlight"><pre class="highlight"><code><span class="n">Alternatevely</span> <span class="n">w</span>
</code></pre></div></div>

<div class="language-python highlighter-rouge"><div class="highlight"><pre class="highlight"><code><span class="nb">list</span><span class="p">(</span><span class="n">np</span><span class="p">.</span><span class="n">where</span><span class="p">(</span><span class="n">the_dataframe</span><span class="p">[</span><span class="s">"fruit1"</span><span class="p">]</span> <span class="o">==</span> <span class="n">the_dataframe</span><span class="p">[</span><span class="s">"fruit2"</span><span class="p">])[</span><span class="mi">0</span><span class="p">])</span>
</code></pre></div></div>

<div class="language-plaintext highlighter-rouge"><div class="highlight"><pre class="highlight"><code>[0, 3, 5, 7]
</code></pre></div></div>

<div class="language-python highlighter-rouge"><div class="highlight"><pre class="highlight"><code><span class="n">np</span><span class="p">.</span><span class="n">where</span><span class="p">(</span><span class="n">the_dataframe</span><span class="p">[</span><span class="s">"fruit1"</span><span class="p">]</span> <span class="o">==</span> <span class="n">the_dataframe</span><span class="p">[</span><span class="s">"fruit2"</span><span class="p">])</span>
</code></pre></div></div>

<div class="language-plaintext highlighter-rouge"><div class="highlight"><pre class="highlight"><code>(array([0, 3, 5, 7]),)
</code></pre></div></div>

<p>Alternatively, we can use the <code class="language-plaintext highlighter-rouge">where</code> function which returns a tuple with first element an array of the indexes where the condition is satisfied. We extract that array and cast it into a list. I prefer this second method as it is more concise.</p>

<h3>Ex 72: How to create lags and leads of a column in a DataFrame?</h3>

<p>Q: Create two new columns in <code class="language-plaintext highlighter-rouge">the_dataframe</code>, one of which is a <code class="language-plaintext highlighter-rouge">lag1</code> (shift column a down by 1 row) of column <code class="language-plaintext highlighter-rouge">a</code> and the other is a <code class="language-plaintext highlighter-rouge">lead1</code> (shift column b up by 1 row).</p>

<div class="language-python highlighter-rouge"><div class="highlight"><pre class="highlight"><code><span class="n">np</span><span class="p">.</span><span class="n">random</span><span class="p">.</span><span class="n">seed</span><span class="p">(</span><span class="mi">42</span><span class="p">)</span>
<span class="n">the_dataframe</span> <span class="o">=</span> <span class="n">pd</span><span class="p">.</span><span class="n">DataFrame</span><span class="p">(</span><span class="n">np</span><span class="p">.</span><span class="n">random</span><span class="p">.</span><span class="n">randint</span><span class="p">(</span><span class="mi">1</span><span class="p">,</span> <span class="mi">100</span><span class="p">,</span> <span class="mi">20</span><span class="p">).</span><span class="n">reshape</span><span class="p">(</span><span class="o">-</span><span class="mi">1</span><span class="p">,</span> <span class="mi">4</span><span class="p">),</span> <span class="n">columns</span> <span class="o">=</span> <span class="nb">list</span><span class="p">(</span><span class="s">'abcd'</span><span class="p">))</span>
</code></pre></div></div>

<h4>Desired output</h4>

<p><img src="/blog/assets/post_cont_image/pandas_ex72.png" alt="Pandas_ex72" /></p>

<h4>Solution</h4>

<div class="language-python highlighter-rouge"><div class="highlight"><pre class="highlight"><code><span class="n">the_dataframe</span>
</code></pre></div></div>

<div>
<style scoped="">
    .dataframe tbody tr th:only-of-type {
        vertical-align: middle;
    }

    .dataframe tbody tr th {
        vertical-align: top;
    }

    .dataframe thead th {
        text-align: right;
    }
</style>
<table border="1" class="dataframe">
  <thead>
    <tr style="text-align: right;">
      <th></th>
      <th>a</th>
      <th>b</th>
      <th>c</th>
      <th>d</th>
    </tr>
  </thead>
  <tbody>
    <tr>
      <th>0</th>
      <td>52</td>
      <td>93</td>
      <td>15</td>
      <td>72</td>
    </tr>
    <tr>
      <th>1</th>
      <td>61</td>
      <td>21</td>
      <td>83</td>
      <td>87</td>
    </tr>
    <tr>
      <th>2</th>
      <td>75</td>
      <td>75</td>
      <td>88</td>
      <td>24</td>
    </tr>
    <tr>
      <th>3</th>
      <td>3</td>
      <td>22</td>
      <td>53</td>
      <td>2</td>
    </tr>
    <tr>
      <th>4</th>
      <td>88</td>
      <td>30</td>
      <td>38</td>
      <td>2</td>
    </tr>
  </tbody>
</table>
</div>

<div class="language-python highlighter-rouge"><div class="highlight"><pre class="highlight"><code><span class="n">the_dataframe</span><span class="p">[</span><span class="s">"lag1"</span><span class="p">]</span> <span class="o">=</span> <span class="n">the_dataframe</span><span class="p">[</span><span class="s">"a"</span><span class="p">].</span><span class="n">shift</span><span class="p">(</span><span class="n">periods</span><span class="o">=</span><span class="mi">1</span><span class="p">)</span>
<span class="n">the_dataframe</span><span class="p">[</span><span class="s">"lead1"</span><span class="p">]</span> <span class="o">=</span> <span class="n">the_dataframe</span><span class="p">[</span><span class="s">"a"</span><span class="p">].</span><span class="n">shift</span><span class="p">(</span><span class="n">periods</span><span class="o">=-</span><span class="mi">1</span><span class="p">)</span>
</code></pre></div></div>

<div class="language-python highlighter-rouge"><div class="highlight"><pre class="highlight"><code><span class="n">the_dataframe</span>
</code></pre></div></div>

<div>
<style scoped="">
    .dataframe tbody tr th:only-of-type {
        vertical-align: middle;
    }

    .dataframe tbody tr th {
        vertical-align: top;
    }

    .dataframe thead th {
        text-align: right;
    }
</style>
<table border="1" class="dataframe">
  <thead>
    <tr style="text-align: right;">
      <th></th>
      <th>a</th>
      <th>b</th>
      <th>c</th>
      <th>d</th>
      <th>lag1</th>
      <th>lead1</th>
    </tr>
  </thead>
  <tbody>
    <tr>
      <th>0</th>
      <td>52</td>
      <td>93</td>
      <td>15</td>
      <td>72</td>
      <td>NaN</td>
      <td>61.0</td>
    </tr>
    <tr>
      <th>1</th>
      <td>61</td>
      <td>21</td>
      <td>83</td>
      <td>87</td>
      <td>52.0</td>
      <td>75.0</td>
    </tr>
    <tr>
      <th>2</th>
      <td>75</td>
      <td>75</td>
      <td>88</td>
      <td>24</td>
      <td>61.0</td>
      <td>3.0</td>
    </tr>
    <tr>
      <th>3</th>
      <td>3</td>
      <td>22</td>
      <td>53</td>
      <td>2</td>
      <td>75.0</td>
      <td>88.0</td>
    </tr>
    <tr>
      <th>4</th>
      <td>88</td>
      <td>30</td>
      <td>38</td>
      <td>2</td>
      <td>3.0</td>
      <td>NaN</td>
    </tr>
  </tbody>
</table>
</div>

<p>To create a shift of values in a column upward or downward, we use the <code class="language-plaintext highlighter-rouge">shift</code> function on the desired column and pass in as the <code class="language-plaintext highlighter-rouge">periods</code> number <code class="language-plaintext highlighter-rouge">1</code> to shift upward or <code class="language-plaintext highlighter-rouge">-1</code> to shift downward.</p>

<h3>Ex 73: How to get the frequency of unique values in the entire DataFrame?</h3>

<p>Q: Get the frequency of unique values in the entire DataFrame.</p>

<div class="language-python highlighter-rouge"><div class="highlight"><pre class="highlight"><code><span class="n">np</span><span class="p">.</span><span class="n">random</span><span class="p">.</span><span class="n">seed</span><span class="p">(</span><span class="mi">42</span><span class="p">)</span>
<span class="n">the_dataframe</span> <span class="o">=</span> <span class="n">pd</span><span class="p">.</span><span class="n">DataFrame</span><span class="p">(</span><span class="n">np</span><span class="p">.</span><span class="n">random</span><span class="p">.</span><span class="n">randint</span><span class="p">(</span><span class="mi">1</span><span class="p">,</span> <span class="mi">10</span><span class="p">,</span> <span class="mi">20</span><span class="p">).</span><span class="n">reshape</span><span class="p">(</span><span class="o">-</span><span class="mi">1</span><span class="p">,</span> <span class="mi">4</span><span class="p">),</span> <span class="n">columns</span> <span class="o">=</span> <span class="nb">list</span><span class="p">(</span><span class="s">'abcd'</span><span class="p">))</span>
</code></pre></div></div>

<h4>Desired output</h4>

<div class="language-python highlighter-rouge"><div class="highlight"><pre class="highlight"><code><span class="c1"># 8    5
# 5    4
# 7    3
# 6    2
# 4    2
# 3    2
# 2    2
# dtype: int64
</span></code></pre></div></div>

<h4>Solution</h4>

<div class="language-python highlighter-rouge"><div class="highlight"><pre class="highlight"><code><span class="n">the_dataframe</span>
</code></pre></div></div>

<div>
<style scoped="">
    .dataframe tbody tr th:only-of-type {
        vertical-align: middle;
    }

    .dataframe tbody tr th {
        vertical-align: top;
    }

    .dataframe thead th {
        text-align: right;
    }
</style>
<table border="1" class="dataframe">
  <thead>
    <tr style="text-align: right;">
      <th></th>
      <th>a</th>
      <th>b</th>
      <th>c</th>
      <th>d</th>
    </tr>
  </thead>
  <tbody>
    <tr>
      <th>0</th>
      <td>7</td>
      <td>4</td>
      <td>8</td>
      <td>5</td>
    </tr>
    <tr>
      <th>1</th>
      <td>7</td>
      <td>3</td>
      <td>7</td>
      <td>8</td>
    </tr>
    <tr>
      <th>2</th>
      <td>5</td>
      <td>4</td>
      <td>8</td>
      <td>8</td>
    </tr>
    <tr>
      <th>3</th>
      <td>3</td>
      <td>6</td>
      <td>5</td>
      <td>2</td>
    </tr>
    <tr>
      <th>4</th>
      <td>8</td>
      <td>6</td>
      <td>2</td>
      <td>5</td>
    </tr>
  </tbody>
</table>
</div>

<div class="language-python highlighter-rouge"><div class="highlight"><pre class="highlight"><code><span class="n">pd</span><span class="p">.</span><span class="n">value_counts</span><span class="p">(</span><span class="n">the_dataframe</span><span class="p">.</span><span class="n">values</span><span class="p">.</span><span class="n">flatten</span><span class="p">())</span>
</code></pre></div></div>

<div class="language-plaintext highlighter-rouge"><div class="highlight"><pre class="highlight"><code>8    5
5    4
7    3
6    2
4    2
3    2
2    2
dtype: int64
</code></pre></div></div>

<p>To get the frequency of unique values or how many time one value is repeated in the dataframe, we use <code class="language-plaintext highlighter-rouge">value_counts</code> and pass in the values of <code class="language-plaintext highlighter-rouge">the_dataframe</code> flattened which transform the dataframe from an n-dimensional dataframe into a 1D array.</p>

<h3>Ex 74: How to split a text column into two separate columns?</h3>

<p>Q: Split the string column in <code class="language-plaintext highlighter-rouge">the_dataframe</code> to form a dataframe with 3 columns as shown.</p>

<div class="language-python highlighter-rouge"><div class="highlight"><pre class="highlight"><code><span class="n">the_dataframe</span> <span class="o">=</span> <span class="n">pd</span><span class="p">.</span><span class="n">DataFrame</span><span class="p">([</span><span class="s">"Temperature, City    Province"</span><span class="p">,</span>
                              <span class="s">"33, Bujumbura    Bujumbura"</span><span class="p">,</span>
                              <span class="s">"30, Buganda    Cibitoke"</span><span class="p">,</span>
                              <span class="s">"25, Ncendajuru    Cankuzo"</span><span class="p">,</span>
                              <span class="s">"35, Giheta    Gitega"</span><span class="p">],</span> 
                              <span class="n">columns</span><span class="o">=</span><span class="p">[</span><span class="s">'row'</span><span class="p">]</span>
                            <span class="p">)</span>
</code></pre></div></div>

<h4>Desired output</h4>

<p><img src="/blog/assets/post_cont_image/pandas_ex74.png" alt="Pandas_ex74" /></p>

<h4>Solution</h4>

<h4>Step 1: split the string data</h4>

<div class="language-python highlighter-rouge"><div class="highlight"><pre class="highlight"><code><span class="n">the_dataframe</span>
</code></pre></div></div>

<div>
<style scoped="">
    .dataframe tbody tr th:only-of-type {
        vertical-align: middle;
    }

    .dataframe tbody tr th {
        vertical-align: top;
    }

    .dataframe thead th {
        text-align: right;
    }
</style>
<table border="1" class="dataframe">
  <thead>
    <tr style="text-align: right;">
      <th></th>
      <th>row</th>
    </tr>
  </thead>
  <tbody>
    <tr>
      <th>0</th>
      <td>Temperature, City    Province</td>
    </tr>
    <tr>
      <th>1</th>
      <td>33, Bujumbura    Bujumbura</td>
    </tr>
    <tr>
      <th>2</th>
      <td>30, Buganda    Cibitoke</td>
    </tr>
    <tr>
      <th>3</th>
      <td>25, Ncendajuru    Cankuzo</td>
    </tr>
    <tr>
      <th>4</th>
      <td>35, Giheta    Gitega</td>
    </tr>
  </tbody>
</table>
</div>

<div class="language-python highlighter-rouge"><div class="highlight"><pre class="highlight"><code><span class="n">df_splitted</span> <span class="o">=</span> <span class="n">the_dataframe</span><span class="p">.</span><span class="n">row</span><span class="p">.</span><span class="nb">str</span><span class="p">.</span><span class="n">split</span><span class="p">(</span><span class="n">pat</span><span class="o">=</span><span class="s">",|</span><span class="se">\t</span><span class="s">|    "</span><span class="p">,</span> <span class="n">expand</span><span class="o">=</span><span class="bp">True</span><span class="p">)</span>
</code></pre></div></div>

<div class="language-python highlighter-rouge"><div class="highlight"><pre class="highlight"><code><span class="n">df_splitted</span>
</code></pre></div></div>

<div>
<style scoped="">
    .dataframe tbody tr th:only-of-type {
        vertical-align: middle;
    }

    .dataframe tbody tr th {
        vertical-align: top;
    }

    .dataframe thead th {
        text-align: right;
    }
</style>
<table border="1" class="dataframe">
  <thead>
    <tr style="text-align: right;">
      <th></th>
      <th>0</th>
      <th>1</th>
      <th>2</th>
    </tr>
  </thead>
  <tbody>
    <tr>
      <th>0</th>
      <td>Temperature</td>
      <td>City</td>
      <td>Province</td>
    </tr>
    <tr>
      <th>1</th>
      <td>33</td>
      <td>Bujumbura</td>
      <td>Bujumbura</td>
    </tr>
    <tr>
      <th>2</th>
      <td>30</td>
      <td>Buganda</td>
      <td>Cibitoke</td>
    </tr>
    <tr>
      <th>3</th>
      <td>25</td>
      <td>Ncendajuru</td>
      <td>Cankuzo</td>
    </tr>
    <tr>
      <th>4</th>
      <td>35</td>
      <td>Giheta</td>
      <td>Gitega</td>
    </tr>
  </tbody>
</table>
</div>

<p>In this first step, we split the strings in the one column into three different columns. We call the <code class="language-plaintext highlighter-rouge">split</code> function on the <code class="language-plaintext highlighter-rouge">str</code> function from the <code class="language-plaintext highlighter-rouge">row</code> dataframe. We pass in as the pattern a regular expression that targets <code class="language-plaintext highlighter-rouge">,</code> or <code class="language-plaintext highlighter-rouge">\t</code> (tab) and <code class="language-plaintext highlighter-rouge">   </code> (4 spaces) and set <code class="language-plaintext highlighter-rouge">expand</code> to <code class="language-plaintext highlighter-rouge">True</code> which expand the split strings into separate columns.</p>

<h4>Step 2: Rename the columns</h4>

<div class="language-python highlighter-rouge"><div class="highlight"><pre class="highlight"><code><span class="n">new_header</span> <span class="o">=</span> <span class="n">df_splitted</span><span class="p">.</span><span class="n">iloc</span><span class="p">[</span><span class="mi">0</span><span class="p">]</span>
</code></pre></div></div>

<div class="language-python highlighter-rouge"><div class="highlight"><pre class="highlight"><code><span class="n">new_header</span>
</code></pre></div></div>

<div class="language-plaintext highlighter-rouge"><div class="highlight"><pre class="highlight"><code>0    Temperature
1           City
2       Province
Name: 0, dtype: object
</code></pre></div></div>

<div class="language-python highlighter-rouge"><div class="highlight"><pre class="highlight"><code><span class="n">df_splitted</span><span class="p">.</span><span class="n">columns</span> <span class="o">=</span> <span class="n">new_header</span>
</code></pre></div></div>

<div class="language-python highlighter-rouge"><div class="highlight"><pre class="highlight"><code><span class="n">df_splitted</span>
</code></pre></div></div>

<div>
<style scoped="">
    .dataframe tbody tr th:only-of-type {
        vertical-align: middle;
    }

    .dataframe tbody tr th {
        vertical-align: top;
    }

    .dataframe thead th {
        text-align: right;
    }
</style>
<table border="1" class="dataframe">
  <thead>
    <tr style="text-align: right;">
      <th></th>
      <th>Temperature</th>
      <th>City</th>
      <th>Province</th>
    </tr>
  </thead>
  <tbody>
    <tr>
      <th>0</th>
      <td>Temperature</td>
      <td>City</td>
      <td>Province</td>
    </tr>
    <tr>
      <th>1</th>
      <td>33</td>
      <td>Bujumbura</td>
      <td>Bujumbura</td>
    </tr>
    <tr>
      <th>2</th>
      <td>30</td>
      <td>Buganda</td>
      <td>Cibitoke</td>
    </tr>
    <tr>
      <th>3</th>
      <td>25</td>
      <td>Ncendajuru</td>
      <td>Cankuzo</td>
    </tr>
    <tr>
      <th>4</th>
      <td>35</td>
      <td>Giheta</td>
      <td>Gitega</td>
    </tr>
  </tbody>
</table>
</div>

<p>In step 2, we are going to use the first row strings as the column names. We first extract the row using <code class="language-plaintext highlighter-rouge">iloc</code> and store it in the <code class="language-plaintext highlighter-rouge">new_header</code>, Then assign it to <code class="language-plaintext highlighter-rouge">columns</code> of the dataframe.</p>

<h4>Step 3: Drop the first row</h4>

<div class="language-python highlighter-rouge"><div class="highlight"><pre class="highlight"><code><span class="n">df_splitted</span><span class="p">.</span><span class="n">drop</span><span class="p">(</span><span class="n">labels</span><span class="o">=</span><span class="mi">0</span><span class="p">,</span><span class="n">axis</span><span class="o">=</span><span class="s">"index"</span><span class="p">,</span><span class="n">inplace</span><span class="o">=</span><span class="bp">True</span><span class="p">)</span>
</code></pre></div></div>

<div class="language-python highlighter-rouge"><div class="highlight"><pre class="highlight"><code><span class="n">df_splitted</span>
</code></pre></div></div>

<div>
<style scoped="">
    .dataframe tbody tr th:only-of-type {
        vertical-align: middle;
    }

    .dataframe tbody tr th {
        vertical-align: top;
    }

    .dataframe thead th {
        text-align: right;
    }
</style>
<table border="1" class="dataframe">
  <thead>
    <tr style="text-align: right;">
      <th></th>
      <th>Temperature</th>
      <th>City</th>
      <th>Province</th>
    </tr>
  </thead>
  <tbody>
    <tr>
      <th>1</th>
      <td>33</td>
      <td>Bujumbura</td>
      <td>Bujumbura</td>
    </tr>
    <tr>
      <th>2</th>
      <td>30</td>
      <td>Buganda</td>
      <td>Cibitoke</td>
    </tr>
    <tr>
      <th>3</th>
      <td>25</td>
      <td>Ncendajuru</td>
      <td>Cankuzo</td>
    </tr>
    <tr>
      <th>4</th>
      <td>35</td>
      <td>Giheta</td>
      <td>Gitega</td>
    </tr>
  </tbody>
</table>
</div>

<p>Now that we have the column names all set, we no longer need that first row, so we are dropping it. We call the <code class="language-plaintext highlighter-rouge">drop</code> function on the dataframe and pass in as parameters <code class="language-plaintext highlighter-rouge">label</code> set to <code class="language-plaintext highlighter-rouge">0</code> to tell Pandas that we want to drop a row not a column, then set <code class="language-plaintext highlighter-rouge">axis</code> to <code class="language-plaintext highlighter-rouge">index</code> (We could also have used <code class="language-plaintext highlighter-rouge">0</code>) to tell Pandas that we want to drop labels from the index. Finally set <code class="language-plaintext highlighter-rouge">inplace</code> to <code class="language-plaintext highlighter-rouge">True</code> to tell Pandas we don’t want a copy of the dataframe that instead, we want the change to occur in the original dataframe.</p>

<h3>Ex 75: How to reverse the columns of a DataFrame?</h3>

<p>Q: Reverse all the columns of a DataFrame.</p>

<div class="language-python highlighter-rouge"><div class="highlight"><pre class="highlight"><code><span class="n">np</span><span class="p">.</span><span class="n">random</span><span class="p">.</span><span class="n">seed</span><span class="p">(</span><span class="mi">42</span><span class="p">)</span>
<span class="n">the_dataframe</span> <span class="o">=</span> <span class="n">pd</span><span class="p">.</span><span class="n">DataFrame</span><span class="p">(</span><span class="n">np</span><span class="p">.</span><span class="n">arange</span><span class="p">(</span><span class="mi">25</span><span class="p">).</span><span class="n">reshape</span><span class="p">(</span><span class="mi">5</span><span class="p">,</span> <span class="o">-</span><span class="mi">1</span><span class="p">))</span>
</code></pre></div></div>

<h4>Desired output</h4>

<p><img src="/blog/assets/post_cont_image/pandas_ex75.png" alt="Pandas_ex75" /></p>

<h4>Solution</h4>

<div class="language-python highlighter-rouge"><div class="highlight"><pre class="highlight"><code><span class="n">the_dataframe</span><span class="p">[</span><span class="n">the_dataframe</span><span class="p">.</span><span class="n">columns</span><span class="p">[::</span><span class="o">-</span><span class="mi">1</span><span class="p">]]</span>
</code></pre></div></div>

<div>
<style scoped="">
    .dataframe tbody tr th:only-of-type {
        vertical-align: middle;
    }

    .dataframe tbody tr th {
        vertical-align: top;
    }

    .dataframe thead th {
        text-align: right;
    }
</style>
<table border="1" class="dataframe">
  <thead>
    <tr style="text-align: right;">
      <th></th>
      <th>4</th>
      <th>3</th>
      <th>2</th>
      <th>1</th>
      <th>0</th>
    </tr>
  </thead>
  <tbody>
    <tr>
      <th>0</th>
      <td>4</td>
      <td>3</td>
      <td>2</td>
      <td>1</td>
      <td>0</td>
    </tr>
    <tr>
      <th>1</th>
      <td>9</td>
      <td>8</td>
      <td>7</td>
      <td>6</td>
      <td>5</td>
    </tr>
    <tr>
      <th>2</th>
      <td>14</td>
      <td>13</td>
      <td>12</td>
      <td>11</td>
      <td>10</td>
    </tr>
    <tr>
      <th>3</th>
      <td>19</td>
      <td>18</td>
      <td>17</td>
      <td>16</td>
      <td>15</td>
    </tr>
    <tr>
      <th>4</th>
      <td>24</td>
      <td>23</td>
      <td>22</td>
      <td>21</td>
      <td>20</td>
    </tr>
  </tbody>
</table>
</div>

<p>This exercise is similar to exercise 57 the difference is that this time we are reversing columns instead of rows. To do the reversal, we first extract the columns and reverse them using indexing <code class="language-plaintext highlighter-rouge">[::-1]</code> and place it into the original dataframe using again indexing.</p>

<h3>Conclusion</h3>

<p>Yaaayy! We made it finally. In the last posts, we have explored more than 150 exercises on NumPy and Pandas. I am very confident that after going through all these exercises, you are ready to tackle the next step: Machine Learning with Scikit-learn. We will continue using NumPy in end-to-end Machine Learning projects coming in the next blog posts.</p>

<p>In the next post, we will introduce the common jargon used in Machine Learning, code our first Machine Learning algorithm and after that post we will start working on machine learning projects finally. I am super duper excited for the upcoming posts. Remember, practice makes perfect! Find the jupyter notebook version of this post on my GitHub profile <a href="https://github.com/semasuka/blog/blob/gh-pages/ipynb/Pandas%20Exercise%20Part%203.ipynb" target="_blank">here</a>.</p>

<p>Thank you again for doing these exercises with me. I hope you have learned one or two things. If you like this post, please subscribe to stay updated with new posts, and if you have a thought or a question, I would love to hear it by commenting below. Cheers, and keep learning!</p>]]></content><author><name>Stern Semasuka</name></author><category term="python" /><category term="exercises" /><category term="pandas" /><summary type="html"><![CDATA[Great to see you again here! In this last post of the Pandas series, we will continue exploring advanced DataFrame exercises. Pandas is easer to learn than NumPy, in my opinion. Its documentation is well written, so don’t be shy! Read its documentation throughout if you get stuck here.]]></summary><media:thumbnail xmlns:media="http://search.yahoo.com/mrss/" url="https://semasuka.github.io/blog/blog/assets/post_images/pandas.jpg" /><media:content medium="image" url="https://semasuka.github.io/blog/blog/assets/post_images/pandas.jpg" xmlns:media="http://search.yahoo.com/mrss/" /></entry><entry><title type="html">Pandas Exercises Part 2</title><link href="https://semasuka.github.io/blog/blog/2020/10/19/pandas-exercise-part-2.html" rel="alternate" type="text/html" title="Pandas Exercises Part 2" /><published>2020-10-19T00:00:00+00:00</published><updated>2020-10-19T00:00:00+00:00</updated><id>https://semasuka.github.io/blog/blog/2020/10/19/pandas-exercise-part-2</id><content type="html" xml:base="https://semasuka.github.io/blog/blog/2020/10/19/pandas-exercise-part-2.html"><![CDATA[<p>Welcome back, guys! We will continue with part 2 in this series of Pandas exercise. I am very excited about this post because we will introducing DataFrame, the most used Pandas data structure. I hope you guys will enjoy this post.<!-- more --></p>

<p>With no further due, let’s get started.</p>

<p>We will start by importing Pandas and NumPy</p>

<div class="language-python highlighter-rouge"><div class="highlight"><pre class="highlight"><code><span class="kn">import</span> <span class="nn">pandas</span> <span class="k">as</span> <span class="n">pd</span>
<span class="kn">import</span> <span class="nn">numpy</span> <span class="k">as</span> <span class="n">np</span>
</code></pre></div></div>

<h3>Ex 26: How to get the mean of a series grouped by another series?</h3>

<p>Q: Compute the mean of weights of each fruit.</p>

<div class="language-python highlighter-rouge"><div class="highlight"><pre class="highlight"><code><span class="n">fruits</span> <span class="o">=</span> <span class="n">pd</span><span class="p">.</span><span class="n">Series</span><span class="p">(</span><span class="n">np</span><span class="p">.</span><span class="n">random</span><span class="p">.</span><span class="n">choice</span><span class="p">([</span><span class="s">'apple'</span><span class="p">,</span> <span class="s">'banana'</span><span class="p">,</span> <span class="s">'carrot'</span><span class="p">],</span> <span class="mi">10</span><span class="p">))</span>
<span class="n">weights</span> <span class="o">=</span> <span class="n">pd</span><span class="p">.</span><span class="n">Series</span><span class="p">(</span><span class="n">np</span><span class="p">.</span><span class="n">linspace</span><span class="p">(</span><span class="mi">1</span><span class="p">,</span> <span class="mi">10</span><span class="p">,</span> <span class="mi">10</span><span class="p">))</span>
</code></pre></div></div>

<h4>Desired output</h4>

<div class="language-python highlighter-rouge"><div class="highlight"><pre class="highlight"><code><span class="c1"># Keep in mind that your values will be different from mine and you might only randomly select only 2 fruits instead of 3.
</span></code></pre></div></div>

<p><img src="/blog/assets/post_cont_image/pandas_ex26.png" alt="Pandas_ex26" /></p>

<h4>Solution</h4>

<div class="language-python highlighter-rouge"><div class="highlight"><pre class="highlight"><code><span class="n">fruits_weights</span> <span class="o">=</span> <span class="n">pd</span><span class="p">.</span><span class="n">concat</span><span class="p">({</span><span class="s">"fruits"</span><span class="p">:</span><span class="n">fruits</span><span class="p">,</span><span class="s">"weights"</span><span class="p">:</span><span class="n">weights</span><span class="p">},</span><span class="n">axis</span><span class="o">=</span><span class="mi">1</span><span class="p">)</span>
</code></pre></div></div>

<div class="language-python highlighter-rouge"><div class="highlight"><pre class="highlight"><code><span class="n">fruits_weights</span><span class="p">.</span><span class="n">groupby</span><span class="p">(</span><span class="n">by</span><span class="o">=</span><span class="s">"fruits"</span><span class="p">).</span><span class="n">mean</span><span class="p">()</span>
</code></pre></div></div>

<div>
<style scoped="">
    .dataframe tbody tr th:only-of-type {
        vertical-align: middle;
    }

    .dataframe tbody tr th {
        vertical-align: top;
    }

    .dataframe thead th {
        text-align: right;
    }
</style>
<table border="1" class="dataframe">
  <thead>
    <tr style="text-align: right;">
      <th></th>
      <th>weights</th>
    </tr>
    <tr>
      <th>fruits</th>
      <th></th>
    </tr>
  </thead>
  <tbody>
    <tr>
      <th>apple</th>
      <td>5.4</td>
    </tr>
    <tr>
      <th>banana</th>
      <td>6.5</td>
    </tr>
    <tr>
      <th>carrot</th>
      <td>2.0</td>
    </tr>
  </tbody>
</table>
</div>

<p>We concatenate horizontally (by setting the axis = 1) the two series into a dataframe by using the concat function and use that dataframe to group the fruits by the name of the fruit. After the grouping the dataframe, we get the mean of each fruit using the mean function.</p>

<h3>Ex 27: How to compute the euclidean distance between two series?</h3>

<p>Q: Compute the <a href="https://en.wikipedia.org/wiki/Euclidean_distance" target="_blank">Euclidean distance</a> between series (points) p and q, using a packaged formula and another solution without.</p>

<p>Euclidean distance formular:</p>

<p><img src="/blog/assets/post_cont_image/pandas_ex27.png" alt="Pandas_ex27" /></p>

<div class="language-python highlighter-rouge"><div class="highlight"><pre class="highlight"><code><span class="n">p</span> <span class="o">=</span> <span class="n">pd</span><span class="p">.</span><span class="n">Series</span><span class="p">([</span><span class="mi">1</span><span class="p">,</span> <span class="mi">2</span><span class="p">,</span> <span class="mi">3</span><span class="p">,</span> <span class="mi">4</span><span class="p">,</span> <span class="mi">5</span><span class="p">,</span> <span class="mi">6</span><span class="p">,</span> <span class="mi">7</span><span class="p">,</span> <span class="mi">8</span><span class="p">,</span> <span class="mi">9</span><span class="p">,</span> <span class="mi">10</span><span class="p">])</span>
<span class="n">q</span> <span class="o">=</span> <span class="n">pd</span><span class="p">.</span><span class="n">Series</span><span class="p">([</span><span class="mi">10</span><span class="p">,</span> <span class="mi">9</span><span class="p">,</span> <span class="mi">8</span><span class="p">,</span> <span class="mi">7</span><span class="p">,</span> <span class="mi">6</span><span class="p">,</span> <span class="mi">5</span><span class="p">,</span> <span class="mi">4</span><span class="p">,</span> <span class="mi">3</span><span class="p">,</span> <span class="mi">2</span><span class="p">,</span> <span class="mi">1</span><span class="p">])</span>
</code></pre></div></div>

<h4>Desired output</h4>

<div class="language-python highlighter-rouge"><div class="highlight"><pre class="highlight"><code><span class="c1"># 18.165
</span></code></pre></div></div>

<h4>Solution</h4>

<h4>1st Method using a built-in function</h4>

<div class="language-python highlighter-rouge"><div class="highlight"><pre class="highlight"><code><span class="n">np</span><span class="p">.</span><span class="n">linalg</span><span class="p">.</span><span class="n">norm</span><span class="p">(</span><span class="n">p</span><span class="o">-</span><span class="n">q</span><span class="p">)</span>
</code></pre></div></div>

<div class="language-plaintext highlighter-rouge"><div class="highlight"><pre class="highlight"><code>18.16590212458495
</code></pre></div></div>

<p>We can get the Euclidean distance by calling the NumPy function linalg.norm function and pass in the difference in the two series.</p>

<h4>2nd Method without using a built-in function</h4>

<div class="language-python highlighter-rouge"><div class="highlight"><pre class="highlight"><code><span class="nb">sum</span><span class="p">((</span><span class="n">p</span> <span class="o">-</span> <span class="n">q</span><span class="p">)</span><span class="o">**</span><span class="mi">2</span><span class="p">)</span><span class="o">**</span><span class="p">.</span><span class="mi">5</span>
</code></pre></div></div>

<div class="language-plaintext highlighter-rouge"><div class="highlight"><pre class="highlight"><code>18.16590212458495
</code></pre></div></div>

<p>Using the Euclidean formula provided, we can use operators to find the Euclidean distance. We first subtract the corresponding elements in the two series and apply 2 as an exponent then sum it up and finally get the square root.</p>

<h3>Ex 28: How to find all the local maxima (or peaks) in a numeric series?</h3>

<p>Q: Get the positions of peaks (values surrounded by smaller values on both sides) in ser.</p>

<div class="language-python highlighter-rouge"><div class="highlight"><pre class="highlight"><code><span class="n">ser</span> <span class="o">=</span> <span class="n">pd</span><span class="p">.</span><span class="n">Series</span><span class="p">([</span><span class="mi">2</span><span class="p">,</span> <span class="mi">10</span><span class="p">,</span> <span class="mi">3</span><span class="p">,</span> <span class="mi">4</span><span class="p">,</span> <span class="mi">9</span><span class="p">,</span> <span class="mi">10</span><span class="p">,</span> <span class="mi">2</span><span class="p">,</span> <span class="mi">7</span><span class="p">,</span> <span class="mi">3</span><span class="p">])</span>
</code></pre></div></div>

<h4>Desired output</h4>

<div class="language-python highlighter-rouge"><div class="highlight"><pre class="highlight"><code><span class="c1"># array([1, 5, 7])
</span></code></pre></div></div>

<h4>Solution</h4>

<div class="language-python highlighter-rouge"><div class="highlight"><pre class="highlight"><code><span class="kn">from</span> <span class="nn">scipy.signal</span> <span class="kn">import</span> <span class="n">argrelextrema</span>

<span class="n">argrelextrema</span><span class="p">(</span><span class="n">ser</span><span class="p">.</span><span class="n">values</span><span class="p">,</span> <span class="n">np</span><span class="p">.</span><span class="n">greater</span><span class="p">)</span>
</code></pre></div></div>

<div class="language-plaintext highlighter-rouge"><div class="highlight"><pre class="highlight"><code>(array([1, 5, 7]),)
</code></pre></div></div>

<p>To calculate the relative extrema of the series, we use argrelextrema function from the scipy (Scientific Python) which is a Python library close to NumPy used for mathematics, science, and engineering.</p>

<p>In that function, we pass in the series and the comparator. Since we are looking for the maxima, in this case, the comparator will be np.greater.</p>

<h3>Ex 29: How to replace missing spaces in a string with the least frequent character?</h3>

<p>Q: Replace the spaces in my_str with the least frequent character.</p>

<div class="language-python highlighter-rouge"><div class="highlight"><pre class="highlight"><code><span class="n">ser</span> <span class="o">=</span> <span class="n">pd</span><span class="p">.</span><span class="n">Series</span><span class="p">(</span><span class="nb">list</span><span class="p">(</span><span class="s">'dbc deb abed gagde'</span><span class="p">))</span>
</code></pre></div></div>

<h4>Desired output</h4>

<div class="language-python highlighter-rouge"><div class="highlight"><pre class="highlight"><code><span class="c1"># least frequent element is c
</span>
<span class="c1"># ['d',
#  'b',
#  'c',
#  'c',
#  'd',
#  'e',
#  'b',
#  'c',
#  'a',
#  'b',
#  'e',
#  'd',
#  'c',
#  'g',
#  'a',
#  'g',
#  'd',
#  'e']
</span></code></pre></div></div>

<h4>Solution</h4>

<div class="language-python highlighter-rouge"><div class="highlight"><pre class="highlight"><code><span class="kn">from</span> <span class="nn">collections</span> <span class="kn">import</span> <span class="n">Counter</span>

<span class="n">least_common_char</span> <span class="o">=</span> <span class="n">Counter</span><span class="p">(</span><span class="n">ser</span><span class="p">.</span><span class="n">replace</span><span class="p">(</span><span class="s">" "</span><span class="p">,</span><span class="s">""</span><span class="p">)).</span><span class="n">most_common</span><span class="p">()[</span><span class="o">-</span><span class="mi">1</span><span class="p">][</span><span class="mi">0</span><span class="p">]</span>
</code></pre></div></div>

<div class="language-python highlighter-rouge"><div class="highlight"><pre class="highlight"><code><span class="n">Counter</span><span class="p">(</span><span class="n">ser</span><span class="p">.</span><span class="n">replace</span><span class="p">(</span><span class="s">" "</span><span class="p">,</span><span class="s">""</span><span class="p">)).</span><span class="n">most_common</span><span class="p">()</span>
</code></pre></div></div>

<div class="language-plaintext highlighter-rouge"><div class="highlight"><pre class="highlight"><code>[('d', 4), ('b', 3), ('', 3), ('e', 3), ('a', 2), ('g', 2), ('c', 1)]
</code></pre></div></div>

<div class="language-python highlighter-rouge"><div class="highlight"><pre class="highlight"><code><span class="n">least_common_char</span>
</code></pre></div></div>

<div class="language-plaintext highlighter-rouge"><div class="highlight"><pre class="highlight"><code>'c'
</code></pre></div></div>

<div class="language-python highlighter-rouge"><div class="highlight"><pre class="highlight"><code><span class="n">ser</span><span class="p">.</span><span class="n">replace</span><span class="p">(</span><span class="s">" "</span><span class="p">,</span><span class="n">least_common_char</span><span class="p">)</span>
</code></pre></div></div>

<div class="language-plaintext highlighter-rouge"><div class="highlight"><pre class="highlight"><code>['d',
 'b',
 'c',
 'c',
 'd',
 'e',
 'b',
 'c',
 'a',
 'b',
 'e',
 'd',
 'c',
 'g',
 'a',
 'g',
 'd',
 'e']
</code></pre></div></div>

<p>To replace the white space with the most common element in the series, we need first to find the most common character in the series.</p>

<p>To find it, we use the counter function from the collection library. We pass in the series without the white space (by replacing “ “ by “”) and apply to the counter function, the most_common function. We will get back a list of tuples will all characters and their counts in decreasing order. We use -1 to target the last tuple and 0 to get the character in that tuple.</p>

<p>Now that we have the least common character, we can replace all the instances of white space by the least common character.</p>

<h3>Ex 30: How to create a TimeSeries starting ‘2000-01-01’ and 10 weekends (Saturdays) and have random numbers as values?</h3>

<p>Q: Create a TimeSeries starting ‘2000-01-01’ and 10 weekends (Saturdays) and have random numbers as values?</p>

<h4>Desired output</h4>

<div class="language-python highlighter-rouge"><div class="highlight"><pre class="highlight"><code><span class="c1"># values will be different due to randomness
</span>
<span class="c1"># 2000-01-01    4
# 2000-01-08    1
# 2000-01-15    8
# 2000-01-22    4
# 2000-01-29    4
# 2000-02-05    2
# 2000-02-12    4
# 2000-02-19    9
# 2000-02-26    6
# 2000-03-04    6
</span></code></pre></div></div>

<h4>Solution</h4>

<div class="language-python highlighter-rouge"><div class="highlight"><pre class="highlight"><code><span class="n">pd</span><span class="p">.</span><span class="n">Series</span><span class="p">(</span><span class="n">np</span><span class="p">.</span><span class="n">random</span><span class="p">.</span><span class="n">randint</span><span class="p">(</span><span class="mi">1</span><span class="p">,</span><span class="n">high</span><span class="o">=</span><span class="mi">10</span><span class="p">,</span><span class="n">size</span><span class="o">=</span><span class="mi">10</span><span class="p">),</span><span class="n">pd</span><span class="p">.</span><span class="n">date_range</span><span class="p">(</span><span class="n">start</span><span class="o">=</span><span class="s">"2000-01-01"</span><span class="p">,</span><span class="n">periods</span><span class="o">=</span><span class="mi">10</span><span class="p">,</span><span class="n">freq</span><span class="o">=</span><span class="s">"W-SAT"</span><span class="p">))</span>
</code></pre></div></div>

<div class="language-plaintext highlighter-rouge"><div class="highlight"><pre class="highlight"><code>2000-01-01    1
2000-01-08    9
2000-01-15    1
2000-01-22    3
2000-01-29    8
2000-02-05    7
2000-02-12    3
2000-02-19    8
2000-02-26    4
2000-03-04    7
Freq: W-SAT, dtype: int64
</code></pre></div></div>

<p>We create as the values of the series, the ten random numbers from 1 to 10 and as indexes, we create a date_range function which returns a date rage starting from 2000-01-01 and set the number of periods to generate to 10 with the frequency set to Saturday weekly. To get the list of all the frequencies, visit <a href="https://pandas.pydata.org/pandas-docs/stable/user_guide/timeseries.html#timeseries-offset-aliases" target="_blank">this link.</a></p>

<h3>31: How to fill an intermittent time series so all missing dates show up with values of previous non-missing date?</h3>

<p>Q:
<code class="language-plaintext highlighter-rouge">ser</code> has missing dates and values. Make all missing dates appear and fill up with value from previous date.</p>

<div class="language-python highlighter-rouge"><div class="highlight"><pre class="highlight"><code><span class="kn">import</span> <span class="nn">pandas</span> <span class="k">as</span> <span class="n">pd</span> 
<span class="kn">import</span> <span class="nn">numpy</span> <span class="k">as</span> <span class="n">np</span>
</code></pre></div></div>

<div class="language-python highlighter-rouge"><div class="highlight"><pre class="highlight"><code><span class="n">ser</span> <span class="o">=</span> <span class="n">pd</span><span class="p">.</span><span class="n">Series</span><span class="p">([</span><span class="mi">1</span><span class="p">,</span><span class="mi">10</span><span class="p">,</span><span class="mi">3</span><span class="p">,</span><span class="n">np</span><span class="p">.</span><span class="n">nan</span><span class="p">],</span> <span class="n">index</span><span class="o">=</span><span class="n">pd</span><span class="p">.</span><span class="n">to_datetime</span><span class="p">([</span><span class="s">'2000-01-01'</span><span class="p">,</span> <span class="s">'2000-01-03'</span><span class="p">,</span> <span class="s">'2000-01-06'</span><span class="p">,</span> <span class="s">'2000-01-08'</span><span class="p">]))</span>
</code></pre></div></div>

<h4>Desired output</h4>

<div class="language-python highlighter-rouge"><div class="highlight"><pre class="highlight"><code><span class="c1"># 2000-01-01     1.0
# 2000-01-02     1.0
# 2000-01-03    10.0
# 2000-01-04    10.0
# 2000-01-05    10.0
# 2000-01-06     3.0
# 2000-01-07     3.0
# 2000-01-08     NaN
</span></code></pre></div></div>

<h4>Solution</h4>

<div class="language-python highlighter-rouge"><div class="highlight"><pre class="highlight"><code><span class="n">ser</span><span class="p">.</span><span class="n">resample</span><span class="p">(</span><span class="s">"D"</span><span class="p">).</span><span class="n">ffill</span><span class="p">()</span>
</code></pre></div></div>

<div class="language-plaintext highlighter-rouge"><div class="highlight"><pre class="highlight"><code>2000-01-01     1.0
2000-01-02     1.0
2000-01-03    10.0
2000-01-04    10.0
2000-01-05    10.0
2000-01-06     3.0
2000-01-07     3.0
2000-01-08     NaN
Freq: D, dtype: float64
</code></pre></div></div>

<p>We use the resample function to fill up all the days that are missing starting from <code class="language-plaintext highlighter-rouge">2000-01-01</code> to <code class="language-plaintext highlighter-rouge">2000-01-08</code> and uses the character <code class="language-plaintext highlighter-rouge">D</code> to specify that we want days as the interval. We then use <code class="language-plaintext highlighter-rouge">ffill</code> function to fill up the missing values from the previous row et voila!</p>

<h3>32: How to compute the autocorrelations of a numeric series?</h3>

<p>Q: Compute autocorrelations for the first 10 lags of ser. Find out which lag has the largest correlation.</p>

<div class="language-python highlighter-rouge"><div class="highlight"><pre class="highlight"><code><span class="n">ser</span> <span class="o">=</span> <span class="n">pd</span><span class="p">.</span><span class="n">Series</span><span class="p">(</span><span class="n">np</span><span class="p">.</span><span class="n">arange</span><span class="p">(</span><span class="mi">20</span><span class="p">)</span> <span class="o">+</span> <span class="n">np</span><span class="p">.</span><span class="n">random</span><span class="p">.</span><span class="n">normal</span><span class="p">(</span><span class="mi">1</span><span class="p">,</span> <span class="mi">10</span><span class="p">,</span> <span class="mi">20</span><span class="p">))</span>
</code></pre></div></div>

<h4>Desired output</h4>

<div class="language-python highlighter-rouge"><div class="highlight"><pre class="highlight"><code><span class="c1"># values will change due to randomness
</span>
<span class="c1"># [-0.462232351922819,
#  0.24702149262453904,
#  -0.3667824631718427,
#  0.09378057953432406,
#  0.3382941938771548,
#  -0.04450324725676436,
#  0.16361925861505003,
#  -0.5351035019540977,
#  0.26359968436232056,
#  0.03944833988252732]
# the lag with the highest correlation is 8
</span></code></pre></div></div>

<h4>Solution</h4>

<div class="language-python highlighter-rouge"><div class="highlight"><pre class="highlight"><code><span class="n">autocorr</span> <span class="o">=</span> <span class="p">[</span><span class="n">ser</span><span class="p">.</span><span class="n">autocorr</span><span class="p">(</span><span class="n">lag</span><span class="o">=</span><span class="n">i</span><span class="p">)</span> <span class="k">for</span> <span class="n">i</span> <span class="ow">in</span> <span class="nb">range</span><span class="p">(</span><span class="mi">11</span><span class="p">)][</span><span class="mi">1</span><span class="p">:]</span>
</code></pre></div></div>

<div class="language-python highlighter-rouge"><div class="highlight"><pre class="highlight"><code><span class="n">autocorr</span>
</code></pre></div></div>

<div class="language-plaintext highlighter-rouge"><div class="highlight"><pre class="highlight"><code>[-0.462232351922819,
 0.24702149262453904,
 -0.3667824631718427,
 0.09378057953432406,
 0.3382941938771548,
 -0.04450324725676436,
 0.16361925861505003,
 -0.5351035019540977,
 0.26359968436232056,
 0.03944833988252732]
</code></pre></div></div>

<div class="language-python highlighter-rouge"><div class="highlight"><pre class="highlight"><code><span class="k">print</span><span class="p">(</span><span class="s">"the lag with the highest correlation is {}"</span><span class="p">.</span><span class="nb">format</span><span class="p">(</span><span class="n">np</span><span class="p">.</span><span class="n">argmax</span><span class="p">(</span><span class="n">np</span><span class="p">.</span><span class="nb">abs</span><span class="p">(</span><span class="n">autocorr</span><span class="p">))</span><span class="o">+</span><span class="mi">1</span><span class="p">))</span>
</code></pre></div></div>

<div class="language-plaintext highlighter-rouge"><div class="highlight"><pre class="highlight"><code>the lag with the highest correlation is 8
</code></pre></div></div>

<p>We first have to calculate the correlation between each consecutive number and to do that we loop through all the elements in the series using range and list comprehension. We use indexing to ignore the first correlation since the correction with the same element is 1.</p>

<p>After finding all the correlation, it is time to find the position of the largest correlation. To do this, we use the NumPy function <code class="language-plaintext highlighter-rouge">argmax</code> to get back the position of the largest absolute (by changing negative correlation to positive) correlation number and add 1 since the count starts from 0.</p>

<h3>Ex 33: How to import only every nth row from a csv file to create a dataframe?</h3>

<p>Q: Import every 50th row of <a href="&quot;https://raw.githubusercontent.com/selva86/datasets/master/BostonHousing.csv&quot;" target="_blank">BostonHousing dataset</a> as a dataframe.</p>

<h4>Desired output</h4>

<p><img src="/blog/assets/post_cont_image/pandas_ex33.png" alt="Pandas_ex33" /></p>

<h4>Solution</h4>

<div class="language-python highlighter-rouge"><div class="highlight"><pre class="highlight"><code><span class="n">boston_housing_dataset</span> <span class="o">=</span> <span class="n">pd</span><span class="p">.</span><span class="n">read_csv</span><span class="p">(</span><span class="s">"https://raw.githubusercontent.com/selva86/datasets/master/BostonHousing.csv"</span><span class="p">)</span>
</code></pre></div></div>

<div class="language-python highlighter-rouge"><div class="highlight"><pre class="highlight"><code><span class="n">boston_housing_dataset</span><span class="p">.</span><span class="n">head</span><span class="p">()</span>
</code></pre></div></div>

<div>
<style scoped="">
    .dataframe tbody tr th:only-of-type {
        vertical-align: middle;
    }

    .dataframe tbody tr th {
        vertical-align: top;
    }

    .dataframe thead th {
        text-align: right;
    }
</style>
<table border="1" class="dataframe">
  <thead>
    <tr style="text-align: right;">
      <th></th>
      <th>crim</th>
      <th>zn</th>
      <th>indus</th>
      <th>chas</th>
      <th>nox</th>
      <th>rm</th>
      <th>age</th>
      <th>dis</th>
      <th>rad</th>
      <th>tax</th>
      <th>ptratio</th>
      <th>b</th>
      <th>lstat</th>
      <th>medv</th>
    </tr>
  </thead>
  <tbody>
    <tr>
      <th>0</th>
      <td>0.00632</td>
      <td>18.0</td>
      <td>2.31</td>
      <td>0</td>
      <td>0.538</td>
      <td>6.575</td>
      <td>65.2</td>
      <td>4.0900</td>
      <td>1</td>
      <td>296</td>
      <td>15.3</td>
      <td>396.90</td>
      <td>4.98</td>
      <td>24.0</td>
    </tr>
    <tr>
      <th>1</th>
      <td>0.02731</td>
      <td>0.0</td>
      <td>7.07</td>
      <td>0</td>
      <td>0.469</td>
      <td>6.421</td>
      <td>78.9</td>
      <td>4.9671</td>
      <td>2</td>
      <td>242</td>
      <td>17.8</td>
      <td>396.90</td>
      <td>9.14</td>
      <td>21.6</td>
    </tr>
    <tr>
      <th>2</th>
      <td>0.02729</td>
      <td>0.0</td>
      <td>7.07</td>
      <td>0</td>
      <td>0.469</td>
      <td>7.185</td>
      <td>61.1</td>
      <td>4.9671</td>
      <td>2</td>
      <td>242</td>
      <td>17.8</td>
      <td>392.83</td>
      <td>4.03</td>
      <td>34.7</td>
    </tr>
    <tr>
      <th>3</th>
      <td>0.03237</td>
      <td>0.0</td>
      <td>2.18</td>
      <td>0</td>
      <td>0.458</td>
      <td>6.998</td>
      <td>45.8</td>
      <td>6.0622</td>
      <td>3</td>
      <td>222</td>
      <td>18.7</td>
      <td>394.63</td>
      <td>2.94</td>
      <td>33.4</td>
    </tr>
    <tr>
      <th>4</th>
      <td>0.06905</td>
      <td>0.0</td>
      <td>2.18</td>
      <td>0</td>
      <td>0.458</td>
      <td>7.147</td>
      <td>54.2</td>
      <td>6.0622</td>
      <td>3</td>
      <td>222</td>
      <td>18.7</td>
      <td>396.90</td>
      <td>5.33</td>
      <td>36.2</td>
    </tr>
  </tbody>
</table>
</div>

<div class="language-python highlighter-rouge"><div class="highlight"><pre class="highlight"><code><span class="n">boston_housing_dataset</span><span class="p">[::</span><span class="mi">50</span><span class="p">]</span>
</code></pre></div></div>

<div>
<style scoped="">
    .dataframe tbody tr th:only-of-type {
        vertical-align: middle;
    }

    .dataframe tbody tr th {
        vertical-align: top;
    }

    .dataframe thead th {
        text-align: right;
    }
</style>
<table border="1" class="dataframe">
  <thead>
    <tr style="text-align: right;">
      <th></th>
      <th>crim</th>
      <th>zn</th>
      <th>indus</th>
      <th>chas</th>
      <th>nox</th>
      <th>rm</th>
      <th>age</th>
      <th>dis</th>
      <th>rad</th>
      <th>tax</th>
      <th>ptratio</th>
      <th>b</th>
      <th>lstat</th>
      <th>medv</th>
    </tr>
  </thead>
  <tbody>
    <tr>
      <th>0</th>
      <td>0.00632</td>
      <td>18.0</td>
      <td>2.31</td>
      <td>0</td>
      <td>0.538</td>
      <td>6.575</td>
      <td>65.2</td>
      <td>4.0900</td>
      <td>1</td>
      <td>296</td>
      <td>15.3</td>
      <td>396.90</td>
      <td>4.98</td>
      <td>24.0</td>
    </tr>
    <tr>
      <th>50</th>
      <td>0.08873</td>
      <td>21.0</td>
      <td>5.64</td>
      <td>0</td>
      <td>0.439</td>
      <td>5.963</td>
      <td>45.7</td>
      <td>6.8147</td>
      <td>4</td>
      <td>243</td>
      <td>16.8</td>
      <td>395.56</td>
      <td>13.45</td>
      <td>19.7</td>
    </tr>
    <tr>
      <th>100</th>
      <td>0.14866</td>
      <td>0.0</td>
      <td>8.56</td>
      <td>0</td>
      <td>0.520</td>
      <td>6.727</td>
      <td>79.9</td>
      <td>2.7778</td>
      <td>5</td>
      <td>384</td>
      <td>20.9</td>
      <td>394.76</td>
      <td>9.42</td>
      <td>27.5</td>
    </tr>
    <tr>
      <th>150</th>
      <td>1.65660</td>
      <td>0.0</td>
      <td>19.58</td>
      <td>0</td>
      <td>0.871</td>
      <td>6.122</td>
      <td>97.3</td>
      <td>1.6180</td>
      <td>5</td>
      <td>403</td>
      <td>14.7</td>
      <td>372.80</td>
      <td>14.10</td>
      <td>21.5</td>
    </tr>
    <tr>
      <th>200</th>
      <td>0.01778</td>
      <td>95.0</td>
      <td>1.47</td>
      <td>0</td>
      <td>0.403</td>
      <td>7.135</td>
      <td>13.9</td>
      <td>7.6534</td>
      <td>3</td>
      <td>402</td>
      <td>17.0</td>
      <td>384.30</td>
      <td>4.45</td>
      <td>32.9</td>
    </tr>
    <tr>
      <th>250</th>
      <td>0.14030</td>
      <td>22.0</td>
      <td>5.86</td>
      <td>0</td>
      <td>0.431</td>
      <td>6.487</td>
      <td>13.0</td>
      <td>7.3967</td>
      <td>7</td>
      <td>330</td>
      <td>19.1</td>
      <td>396.28</td>
      <td>5.90</td>
      <td>24.4</td>
    </tr>
    <tr>
      <th>300</th>
      <td>0.04417</td>
      <td>70.0</td>
      <td>2.24</td>
      <td>0</td>
      <td>0.400</td>
      <td>6.871</td>
      <td>47.4</td>
      <td>7.8278</td>
      <td>5</td>
      <td>358</td>
      <td>14.8</td>
      <td>390.86</td>
      <td>6.07</td>
      <td>24.8</td>
    </tr>
    <tr>
      <th>350</th>
      <td>0.06211</td>
      <td>40.0</td>
      <td>1.25</td>
      <td>0</td>
      <td>0.429</td>
      <td>6.490</td>
      <td>44.4</td>
      <td>8.7921</td>
      <td>1</td>
      <td>335</td>
      <td>19.7</td>
      <td>396.90</td>
      <td>5.98</td>
      <td>22.9</td>
    </tr>
    <tr>
      <th>400</th>
      <td>25.04610</td>
      <td>0.0</td>
      <td>18.10</td>
      <td>0</td>
      <td>0.693</td>
      <td>5.987</td>
      <td>100.0</td>
      <td>1.5888</td>
      <td>24</td>
      <td>666</td>
      <td>20.2</td>
      <td>396.90</td>
      <td>26.77</td>
      <td>5.6</td>
    </tr>
    <tr>
      <th>450</th>
      <td>6.71772</td>
      <td>0.0</td>
      <td>18.10</td>
      <td>0</td>
      <td>0.713</td>
      <td>6.749</td>
      <td>92.6</td>
      <td>2.3236</td>
      <td>24</td>
      <td>666</td>
      <td>20.2</td>
      <td>0.32</td>
      <td>17.44</td>
      <td>13.4</td>
    </tr>
    <tr>
      <th>500</th>
      <td>0.22438</td>
      <td>0.0</td>
      <td>9.69</td>
      <td>0</td>
      <td>0.585</td>
      <td>6.027</td>
      <td>79.7</td>
      <td>2.4982</td>
      <td>6</td>
      <td>391</td>
      <td>19.2</td>
      <td>396.90</td>
      <td>14.33</td>
      <td>16.8</td>
    </tr>
  </tbody>
</table>
</div>

<p>To import a csv(comma-separated value) dataset, we use the <code class="language-plaintext highlighter-rouge">read_csv</code> function and pass in the link to the csv file. Now we have the dataset imported and stored in the <code class="language-plaintext highlighter-rouge">boston_housing_dataset</code>.</p>

<p>To get every 50th row in the dataset, we use indexing with a step of 50.</p>

<h3>Ex 34: How to change column values when importing csv to a dataframe?</h3>

<p>Q: Import <a href="&quot;https://raw.githubusercontent.com/selva86/datasets/master/BostonHousing.csv&quot;" target="_blank">the  BostonHousing dataset</a> dataset, but while importing change the ‘medv’ (median house value) column so that values &lt; 25 becomes ‘Low’ and &gt; 25 becomes ‘High’.</p>

<h4>Desired output</h4>

<p><img src="/blog/assets/post_cont_image/pandas_ex34.png" alt="Pandas_ex34" /></p>

<h4>Solution</h4>

<div class="language-python highlighter-rouge"><div class="highlight"><pre class="highlight"><code><span class="n">boston_housing_dataset</span> <span class="o">=</span> <span class="n">pd</span><span class="p">.</span><span class="n">read_csv</span><span class="p">(</span><span class="s">"https://raw.githubusercontent.com/selva86/datasets/master/BostonHousing.csv"</span><span class="p">,</span><span class="n">converters</span><span class="o">=</span><span class="p">{</span><span class="s">"medv"</span><span class="p">:</span> <span class="k">lambda</span> <span class="n">x</span><span class="p">:</span> <span class="s">"High"</span> <span class="k">if</span> <span class="nb">float</span><span class="p">(</span><span class="n">x</span><span class="p">)</span> <span class="o">&gt;</span> <span class="mi">25</span> <span class="k">else</span> <span class="s">"Low"</span><span class="p">})</span>
</code></pre></div></div>

<div class="language-python highlighter-rouge"><div class="highlight"><pre class="highlight"><code><span class="n">boston_housing_dataset</span><span class="p">.</span><span class="n">head</span><span class="p">()</span>
</code></pre></div></div>

<div>
<style scoped="">
    .dataframe tbody tr th:only-of-type {
        vertical-align: middle;
    }

    .dataframe tbody tr th {
        vertical-align: top;
    }

    .dataframe thead th {
        text-align: right;
    }
</style>
<table border="1" class="dataframe">
  <thead>
    <tr style="text-align: right;">
      <th></th>
      <th>crim</th>
      <th>zn</th>
      <th>indus</th>
      <th>chas</th>
      <th>nox</th>
      <th>rm</th>
      <th>age</th>
      <th>dis</th>
      <th>rad</th>
      <th>tax</th>
      <th>ptratio</th>
      <th>b</th>
      <th>lstat</th>
      <th>medv</th>
    </tr>
  </thead>
  <tbody>
    <tr>
      <th>0</th>
      <td>0.00632</td>
      <td>18.0</td>
      <td>2.31</td>
      <td>0</td>
      <td>0.538</td>
      <td>6.575</td>
      <td>65.2</td>
      <td>4.0900</td>
      <td>1</td>
      <td>296</td>
      <td>15.3</td>
      <td>396.90</td>
      <td>4.98</td>
      <td>Low</td>
    </tr>
    <tr>
      <th>1</th>
      <td>0.02731</td>
      <td>0.0</td>
      <td>7.07</td>
      <td>0</td>
      <td>0.469</td>
      <td>6.421</td>
      <td>78.9</td>
      <td>4.9671</td>
      <td>2</td>
      <td>242</td>
      <td>17.8</td>
      <td>396.90</td>
      <td>9.14</td>
      <td>Low</td>
    </tr>
    <tr>
      <th>2</th>
      <td>0.02729</td>
      <td>0.0</td>
      <td>7.07</td>
      <td>0</td>
      <td>0.469</td>
      <td>7.185</td>
      <td>61.1</td>
      <td>4.9671</td>
      <td>2</td>
      <td>242</td>
      <td>17.8</td>
      <td>392.83</td>
      <td>4.03</td>
      <td>High</td>
    </tr>
    <tr>
      <th>3</th>
      <td>0.03237</td>
      <td>0.0</td>
      <td>2.18</td>
      <td>0</td>
      <td>0.458</td>
      <td>6.998</td>
      <td>45.8</td>
      <td>6.0622</td>
      <td>3</td>
      <td>222</td>
      <td>18.7</td>
      <td>394.63</td>
      <td>2.94</td>
      <td>High</td>
    </tr>
    <tr>
      <th>4</th>
      <td>0.06905</td>
      <td>0.0</td>
      <td>2.18</td>
      <td>0</td>
      <td>0.458</td>
      <td>7.147</td>
      <td>54.2</td>
      <td>6.0622</td>
      <td>3</td>
      <td>222</td>
      <td>18.7</td>
      <td>396.90</td>
      <td>5.33</td>
      <td>High</td>
    </tr>
  </tbody>
</table>
</div>

<p>To change the value of a column while importing the dataset, we use the parameter converters from the read_csv function. We pass in a dictionary with a key corresponding to the name of the column we want to change and value to be a lambda expression where “High” is for the value greater than 25 and “Low” is for the value less than 25.</p>

<h3>Ex 35: How to create a dataframe with rows as strides from a given series?</h3>

<p>Q: Create a dataframe with rows as strides from a given series with 2 as the stride length and 4 as length of each row.</p>

<div class="language-python highlighter-rouge"><div class="highlight"><pre class="highlight"><code><span class="n">the_series</span> <span class="o">=</span> <span class="n">pd</span><span class="p">.</span><span class="n">Series</span><span class="p">(</span><span class="nb">range</span><span class="p">(</span><span class="mi">15</span><span class="p">))</span>
</code></pre></div></div>

<h4>Desired output</h4>

<div class="language-python highlighter-rouge"><div class="highlight"><pre class="highlight"><code><span class="c1"># array([[ 0,  1,  2,  3],
#        [ 2,  3,  4,  5],
#        [ 4,  5,  6,  7],
#        [ 6,  7,  8,  9],
#        [ 8,  9, 10, 11],
#        [10, 11, 12, 13]])
</span></code></pre></div></div>

<h4>Solution</h4>

<div class="language-python highlighter-rouge"><div class="highlight"><pre class="highlight"><code><span class="k">def</span> <span class="nf">gen_strides</span><span class="p">(</span><span class="n">the_series</span><span class="p">,</span> <span class="n">stride_len</span><span class="o">=</span><span class="mi">2</span><span class="p">,</span> <span class="n">window_len</span><span class="o">=</span><span class="mi">4</span><span class="p">):</span>
    <span class="n">n_strides</span> <span class="o">=</span> <span class="p">((</span><span class="n">the_series</span><span class="p">.</span><span class="n">size</span> <span class="o">-</span> <span class="n">window_len</span><span class="p">)</span><span class="o">//</span><span class="n">stride_len</span><span class="p">)</span> <span class="o">+</span> <span class="mi">1</span>
    <span class="k">return</span> <span class="n">np</span><span class="p">.</span><span class="n">array</span><span class="p">([</span><span class="n">the_series</span><span class="p">[</span><span class="n">i</span><span class="p">:(</span><span class="n">i</span><span class="o">+</span><span class="n">window_len</span><span class="p">)]</span> <span class="k">for</span> <span class="n">i</span> <span class="ow">in</span> <span class="n">np</span><span class="p">.</span><span class="n">arange</span><span class="p">(</span><span class="mi">0</span><span class="p">,</span><span class="n">the_series</span><span class="p">.</span><span class="n">size</span><span class="p">,</span><span class="n">stride_len</span><span class="p">)[:</span><span class="n">n_strides</span><span class="p">]])</span>

<span class="n">gen_strides</span><span class="p">(</span><span class="n">the_series</span><span class="p">)</span>

</code></pre></div></div>

<div class="language-plaintext highlighter-rouge"><div class="highlight"><pre class="highlight"><code>[0 2 4]
</code></pre></div></div>

<p>Strides are used in CNN (convolutional neural network), which will be covered in a future post. To get the stride, we first create a function that takes in the stride length 2 (which mean that the two last elements in the row will be the same as the first two elements in the following row) and a window length of 4 (corresponding to the number of elements in the row or the number of columns).</p>

<p>We need first to get the numbers of rows by subtracting the size of the series by the number of element desired in a row and floor divide with the stride length and finally add 1.</p>

<p>We proceed by using the list comprehension by looping through an array that starts from 0, step by <code class="language-plaintext highlighter-rouge">stride_len</code> and stops at <code class="language-plaintext highlighter-rouge">the_series.size</code>. We use indexing with <code class="language-plaintext highlighter-rouge">n_stride</code> to get the first six elements because we only have six rows.</p>

<p>Now it is time to populate the rows, for each row we use the original series and start from index <code class="language-plaintext highlighter-rouge">i</code> to index <code class="language-plaintext highlighter-rouge">i + window_len</code> to get the strides.</p>

<h3>Ex 36: How to import only specified columns from a csv file?</h3>

<p>Q: Import <code class="language-plaintext highlighter-rouge">crim</code> and <code class="language-plaintext highlighter-rouge">medv</code> columns of the <a href="https://raw.githubusercontent.com/selva86/datasets/master/BostonHousing.csv" target="_blank">BostonHousing dataset</a> as a dataframe.</p>

<h4>Desired output</h4>

<p><img src="/blog/assets/post_cont_image/pandas_ex36.png" alt="Pandas_ex36" /></p>

<h4>Solution</h4>

<div class="language-python highlighter-rouge"><div class="highlight"><pre class="highlight"><code><span class="n">pd</span><span class="p">.</span><span class="n">read_csv</span><span class="p">(</span><span class="s">"https://raw.githubusercontent.com/selva86/datasets/master/BostonHousing.csv"</span><span class="p">,</span><span class="n">usecols</span><span class="o">=</span><span class="p">[</span><span class="s">"crim"</span><span class="p">,</span><span class="s">"medv"</span><span class="p">]).</span><span class="n">head</span><span class="p">()</span>
</code></pre></div></div>

<div>
<style scoped="">
    .dataframe tbody tr th:only-of-type {
        vertical-align: middle;
    }

    .dataframe tbody tr th {
        vertical-align: top;
    }

    .dataframe thead th {
        text-align: right;
    }
</style>
<table border="1" class="dataframe">
  <thead>
    <tr style="text-align: right;">
      <th></th>
      <th>crim</th>
      <th>medv</th>
    </tr>
  </thead>
  <tbody>
    <tr>
      <th>0</th>
      <td>0.00632</td>
      <td>24.0</td>
    </tr>
    <tr>
      <th>1</th>
      <td>0.02731</td>
      <td>21.6</td>
    </tr>
    <tr>
      <th>2</th>
      <td>0.02729</td>
      <td>34.7</td>
    </tr>
    <tr>
      <th>3</th>
      <td>0.03237</td>
      <td>33.4</td>
    </tr>
    <tr>
      <th>4</th>
      <td>0.06905</td>
      <td>36.2</td>
    </tr>
  </tbody>
</table>
</div>

<p>To import only the <code class="language-plaintext highlighter-rouge">crim</code> and the <code class="language-plaintext highlighter-rouge">medv</code> column, we pass a list of the names of those two columns the <code class="language-plaintext highlighter-rouge">usecols</code> parameter.</p>

<h3>Ex 37: How to get the nrows, ncolumns, datatype, summary stats of each column of a dataframe? Also, get the array and list equivalent.</h3>

<p>Q: Get the number of rows, columns, datatype, columns for  each datatype and statistical summary of each column of the <a href="&quot;https://raw.githubusercontent.com/selva86/datasets/master/Cars93_miss.csv&quot;" target="_blank">Cars93</a> dataset. Also, get the numpy array and list equivalent of the dataframe.</p>

<h4>Desired output</h4>

<div class="language-python highlighter-rouge"><div class="highlight"><pre class="highlight"><code><span class="c1"># Rows and columns
</span>
<span class="c1">#(93, 27)
</span>
<span class="c1"># Datatype
</span>
<span class="c1"># Manufacturer           object
# Model                  object
# Type                   object
# Min.Price             float64
# Price                 float64
# Max.Price             float64
# MPG.city              float64
# MPG.highway           float64
# AirBags                object
# DriveTrain             object
# Cylinders              object
# EngineSize            float64
# Horsepower            float64
# RPM                   float64
# Rev.per.mile          float64
# Man.trans.avail        object
# Fuel.tank.capacity    float64
# Passengers            float64
# Length                float64
# Wheelbase             float64
# Width                 float64
# Turn.circle           float64
# Rear.seat.room        float64
# Luggage.room          float64
# Weight                float64
# Origin                 object
# Make                   object
# dtype: object
</span>
<span class="c1"># Columns for each datatype
</span>
<span class="c1"># float64    18
# object      9
# dtype: int64
</span>
<span class="c1"># Statistical summary
</span>
<span class="c1"># Min.Price	Price	Max.Price	MPG.city	MPG.highway	EngineSize	Horsepower	RPM	Rev.per.mile	Fuel.tank.capacity	Passengers	Length	Wheelbase	Width	Turn.circle	Rear.seat.room	Luggage.room	Weight
# count	86.000000	91.000000	88.000000	84.000000	91.000000	91.000000	86.000000	90.000000	87.000000	85.000000	91.000000	89.000000	92.000000	87.000000	88.000000	89.000000	74.000000	86.000000
# mean	17.118605	19.616484	21.459091	22.404762	29.065934	2.658242	144.000000	5276.666667	2355.000000	16.683529	5.076923	182.865169	103.956522	69.448276	38.954545	27.853933	13.986486	3104.593023
# std	8.828290	9.724280	10.696563	5.841520	5.370293	1.045845	53.455204	605.554811	486.916616	3.375748	1.045953	14.792651	6.856317	3.778023	3.304157	3.018129	3.120824	600.129993
# min	6.700000	7.400000	7.900000	15.000000	20.000000	1.000000	55.000000	3800.000000	1320.000000	9.200000	2.000000	141.000000	90.000000	60.000000	32.000000	19.000000	6.000000	1695.000000
# 25%	10.825000	12.350000	14.575000	18.000000	26.000000	1.800000	100.750000	4800.000000	2017.500000	14.500000	4.000000	174.000000	98.000000	67.000000	36.000000	26.000000	12.000000	2647.500000
# 50%	14.600000	17.700000	19.150000	21.000000	28.000000	2.300000	140.000000	5200.000000	2360.000000	16.500000	5.000000	181.000000	103.000000	69.000000	39.000000	27.500000	14.000000	3085.000000
# 75%	20.250000	23.500000	24.825000	25.000000	31.000000	3.250000	170.000000	5787.500000	2565.000000	19.000000	6.000000	192.000000	110.000000	72.000000	42.000000	30.000000	16.000000	3567.500000
# max	45.400000	61.900000	80.000000	46.000000	50.000000	5.700000	300.000000	6500.000000	3755.000000	27.000000	8.000000	219.000000	119.000000	78.000000	45.000000	36.000000	22.000000	4105.000000
</span>
<span class="c1"># NumPy array
</span>
<span class="c1"># array(['Acura', 'Integra', 'Small', 12.9, 15.9, 18.8, 25.0, 31.0, 'None',
#        'Front', '4', 1.8, 140.0, 6300.0, 2890.0, 'Yes', 13.2, 5.0, 177.0,
#        102.0, 68.0, 37.0, 26.5, nan, 2705.0, 'non-USA', 'Acura Integra'],
#       dtype=object)
</span>
<span class="c1"># List
</span>
<span class="c1"># ['Acura',
#   'Integra',
#   'Small',
#   12.9,
#   15.9,
#   18.8,
#   25.0,
#   31.0,
#   'None',
#   'Front',
#   '4',
#   1.8,
#   140.0,
#   6300.0,
#   2890.0,
#   'Yes',
#   13.2,
#   5.0,
#   177.0,
#   102.0,
#   68.0,
#   37.0,
#   26.5,
#   nan,
#   2705.0,
#   'non-USA',
#   'Acura Integra']
</span>
</code></pre></div></div>

<h4>Solution</h4>

<div class="language-python highlighter-rouge"><div class="highlight"><pre class="highlight"><code><span class="n">cars_dataset</span> <span class="o">=</span> <span class="n">pd</span><span class="p">.</span><span class="n">read_csv</span><span class="p">(</span><span class="s">"https://raw.githubusercontent.com/selva86/datasets/master/Cars93_miss.csv"</span><span class="p">)</span>
</code></pre></div></div>

<h4>Shape</h4>

<div class="language-python highlighter-rouge"><div class="highlight"><pre class="highlight"><code><span class="n">cars_dataset</span><span class="p">.</span><span class="n">shape</span>
</code></pre></div></div>

<div class="language-plaintext highlighter-rouge"><div class="highlight"><pre class="highlight"><code>(93, 27)
</code></pre></div></div>

<p>We call the shape function on the dataset, we back a tuple with the first element as the number of rows and the second element is the number of columns in the dataframe.</p>

<h4>Datatype</h4>

<div class="language-python highlighter-rouge"><div class="highlight"><pre class="highlight"><code><span class="n">cars_dataset</span><span class="p">.</span><span class="n">dtypes</span>
</code></pre></div></div>

<div class="language-plaintext highlighter-rouge"><div class="highlight"><pre class="highlight"><code>Manufacturer           object
Model                  object
Type                   object
Min.Price             float64
Price                 float64
Max.Price             float64
MPG.city              float64
MPG.highway           float64
AirBags                object
DriveTrain             object
Cylinders              object
EngineSize            float64
Horsepower            float64
RPM                   float64
Rev.per.mile          float64
Man.trans.avail        object
Fuel.tank.capacity    float64
Passengers            float64
Length                float64
Wheelbase             float64
Width                 float64
Turn.circle           float64
Rear.seat.room        float64
Luggage.room          float64
Weight                float64
Origin                 object
Make                   object
dtype: object
</code></pre></div></div>

<p>To get the datatype for each column, we call the <code class="language-plaintext highlighter-rouge">dtypes</code> function on the dataset.</p>

<h4>Columns for each datatype</h4>

<div class="language-python highlighter-rouge"><div class="highlight"><pre class="highlight"><code><span class="n">cars_dataset</span><span class="p">.</span><span class="n">dtypes</span><span class="p">.</span><span class="n">value_counts</span><span class="p">()</span>
</code></pre></div></div>

<div class="language-plaintext highlighter-rouge"><div class="highlight"><pre class="highlight"><code>float64    18
object      9
dtype: int64
</code></pre></div></div>

<p>To get the columns count for each datatype, we call the <code class="language-plaintext highlighter-rouge">value_counts</code> on the <code class="language-plaintext highlighter-rouge">dtype</code> function.</p>

<h4>Statistical summary</h4>

<div class="language-python highlighter-rouge"><div class="highlight"><pre class="highlight"><code><span class="n">cars_dataset</span><span class="p">.</span><span class="n">describe</span><span class="p">()</span>
</code></pre></div></div>

<div>
<style scoped="">
    .dataframe tbody tr th:only-of-type {
        vertical-align: middle;
    }

    .dataframe tbody tr th {
        vertical-align: top;
    }

    .dataframe thead th {
        text-align: right;
    }
</style>
<table border="1" class="dataframe">
  <thead>
    <tr style="text-align: right;">
      <th></th>
      <th>Min.Price</th>
      <th>Price</th>
      <th>Max.Price</th>
      <th>MPG.city</th>
      <th>MPG.highway</th>
      <th>EngineSize</th>
      <th>Horsepower</th>
      <th>RPM</th>
      <th>Rev.per.mile</th>
      <th>Fuel.tank.capacity</th>
      <th>Passengers</th>
      <th>Length</th>
      <th>Wheelbase</th>
      <th>Width</th>
      <th>Turn.circle</th>
      <th>Rear.seat.room</th>
      <th>Luggage.room</th>
      <th>Weight</th>
    </tr>
  </thead>
  <tbody>
    <tr>
      <th>count</th>
      <td>86.000000</td>
      <td>91.000000</td>
      <td>88.000000</td>
      <td>84.000000</td>
      <td>91.000000</td>
      <td>91.000000</td>
      <td>86.000000</td>
      <td>90.000000</td>
      <td>87.000000</td>
      <td>85.000000</td>
      <td>91.000000</td>
      <td>89.000000</td>
      <td>92.000000</td>
      <td>87.000000</td>
      <td>88.000000</td>
      <td>89.000000</td>
      <td>74.000000</td>
      <td>86.000000</td>
    </tr>
    <tr>
      <th>mean</th>
      <td>17.118605</td>
      <td>19.616484</td>
      <td>21.459091</td>
      <td>22.404762</td>
      <td>29.065934</td>
      <td>2.658242</td>
      <td>144.000000</td>
      <td>5276.666667</td>
      <td>2355.000000</td>
      <td>16.683529</td>
      <td>5.076923</td>
      <td>182.865169</td>
      <td>103.956522</td>
      <td>69.448276</td>
      <td>38.954545</td>
      <td>27.853933</td>
      <td>13.986486</td>
      <td>3104.593023</td>
    </tr>
    <tr>
      <th>std</th>
      <td>8.828290</td>
      <td>9.724280</td>
      <td>10.696563</td>
      <td>5.841520</td>
      <td>5.370293</td>
      <td>1.045845</td>
      <td>53.455204</td>
      <td>605.554811</td>
      <td>486.916616</td>
      <td>3.375748</td>
      <td>1.045953</td>
      <td>14.792651</td>
      <td>6.856317</td>
      <td>3.778023</td>
      <td>3.304157</td>
      <td>3.018129</td>
      <td>3.120824</td>
      <td>600.129993</td>
    </tr>
    <tr>
      <th>min</th>
      <td>6.700000</td>
      <td>7.400000</td>
      <td>7.900000</td>
      <td>15.000000</td>
      <td>20.000000</td>
      <td>1.000000</td>
      <td>55.000000</td>
      <td>3800.000000</td>
      <td>1320.000000</td>
      <td>9.200000</td>
      <td>2.000000</td>
      <td>141.000000</td>
      <td>90.000000</td>
      <td>60.000000</td>
      <td>32.000000</td>
      <td>19.000000</td>
      <td>6.000000</td>
      <td>1695.000000</td>
    </tr>
    <tr>
      <th>25%</th>
      <td>10.825000</td>
      <td>12.350000</td>
      <td>14.575000</td>
      <td>18.000000</td>
      <td>26.000000</td>
      <td>1.800000</td>
      <td>100.750000</td>
      <td>4800.000000</td>
      <td>2017.500000</td>
      <td>14.500000</td>
      <td>4.000000</td>
      <td>174.000000</td>
      <td>98.000000</td>
      <td>67.000000</td>
      <td>36.000000</td>
      <td>26.000000</td>
      <td>12.000000</td>
      <td>2647.500000</td>
    </tr>
    <tr>
      <th>50%</th>
      <td>14.600000</td>
      <td>17.700000</td>
      <td>19.150000</td>
      <td>21.000000</td>
      <td>28.000000</td>
      <td>2.300000</td>
      <td>140.000000</td>
      <td>5200.000000</td>
      <td>2360.000000</td>
      <td>16.500000</td>
      <td>5.000000</td>
      <td>181.000000</td>
      <td>103.000000</td>
      <td>69.000000</td>
      <td>39.000000</td>
      <td>27.500000</td>
      <td>14.000000</td>
      <td>3085.000000</td>
    </tr>
    <tr>
      <th>75%</th>
      <td>20.250000</td>
      <td>23.500000</td>
      <td>24.825000</td>
      <td>25.000000</td>
      <td>31.000000</td>
      <td>3.250000</td>
      <td>170.000000</td>
      <td>5787.500000</td>
      <td>2565.000000</td>
      <td>19.000000</td>
      <td>6.000000</td>
      <td>192.000000</td>
      <td>110.000000</td>
      <td>72.000000</td>
      <td>42.000000</td>
      <td>30.000000</td>
      <td>16.000000</td>
      <td>3567.500000</td>
    </tr>
    <tr>
      <th>max</th>
      <td>45.400000</td>
      <td>61.900000</td>
      <td>80.000000</td>
      <td>46.000000</td>
      <td>50.000000</td>
      <td>5.700000</td>
      <td>300.000000</td>
      <td>6500.000000</td>
      <td>3755.000000</td>
      <td>27.000000</td>
      <td>8.000000</td>
      <td>219.000000</td>
      <td>119.000000</td>
      <td>78.000000</td>
      <td>45.000000</td>
      <td>36.000000</td>
      <td>22.000000</td>
      <td>4105.000000</td>
    </tr>
  </tbody>
</table>
</div>

<p>To get the statistical summary (mean, std, percentile, min, max and count), we call the <code class="language-plaintext highlighter-rouge">describe</code> function on the dataset.</p>

<h4>Dataframe to NumPy</h4>

<div class="language-python highlighter-rouge"><div class="highlight"><pre class="highlight"><code><span class="n">cars_dataset</span><span class="p">.</span><span class="n">iloc</span><span class="p">[</span><span class="mi">0</span><span class="p">].</span><span class="n">to_numpy</span><span class="p">()</span>
</code></pre></div></div>

<div class="language-plaintext highlighter-rouge"><div class="highlight"><pre class="highlight"><code>array(['Acura', 'Integra', 'Small', 12.9, 15.9, 18.8, 25.0, 31.0, 'None',
       'Front', '4', 1.8, 140.0, 6300.0, 2890.0, 'Yes', 13.2, 5.0, 177.0,
       102.0, 68.0, 37.0, 26.5, nan, 2705.0, 'non-USA', 'Acura Integra'],
      dtype=object)
</code></pre></div></div>

<p>We extract the first row and call the <code class="language-plaintext highlighter-rouge">to_numpy</code> function to cast the row to a NumPy array. It is also possible to cast the whole dataframe to an array.</p>

<h4>Dataframe to list</h4>

<div class="language-python highlighter-rouge"><div class="highlight"><pre class="highlight"><code><span class="n">cars_dataset</span><span class="p">.</span><span class="n">iloc</span><span class="p">[</span><span class="mi">0</span><span class="p">].</span><span class="n">values</span><span class="p">.</span><span class="n">tolist</span><span class="p">()</span>
</code></pre></div></div>

<div class="language-plaintext highlighter-rouge"><div class="highlight"><pre class="highlight"><code>['Acura',
 'Integra',
 'Small',
 12.9,
 15.9,
 18.8,
 25.0,
 31.0,
 'None',
 'Front',
 '4',
 1.8,
 140.0,
 6300.0,
 2890.0,
 'Yes',
 13.2,
 5.0,
 177.0,
 102.0,
 68.0,
 37.0,
 26.5,
 nan,
 2705.0,
 'non-USA',
 'Acura Integra']
</code></pre></div></div>

<p>We extract the first row and call the <code class="language-plaintext highlighter-rouge">tolist</code> function on the <code class="language-plaintext highlighter-rouge">values</code> function to cast the row to a list. It is also possible to cast the whole dataframe to a list.</p>

<h3>Ex 38: How to extract the row and column number of a particular cell with a given criterion?</h3>

<p>Q: Which manufacturer, model and type have the highest Price? What are the row and column number of the cell with the highest Price value?</p>

<div class="language-python highlighter-rouge"><div class="highlight"><pre class="highlight"><code><span class="n">cars_dataset</span> <span class="o">=</span> <span class="n">pd</span><span class="p">.</span><span class="n">read_csv</span><span class="p">(</span><span class="s">'https://raw.githubusercontent.com/selva86/datasets/master/Cars93_miss.csv'</span><span class="p">)</span>
</code></pre></div></div>

<h4>Desired output</h4>

<div class="language-python highlighter-rouge"><div class="highlight"><pre class="highlight"><code><span class="c1"># Manufacturer with the highest price
</span>
<span class="c1"># 'Mercedes-Benz'
</span>
<span class="c1"># Model with the highest price
</span>
<span class="c1"># '300E'
</span>
<span class="c1"># Type with the highest price
</span>
<span class="c1"># 'Midsize'
</span>
<span class="c1"># row and column number of the cell with the highest Price value
</span>
<span class="c1"># (array([58]), array([4]))
</span></code></pre></div></div>

<h4>Solution</h4>

<h4>Manufacturer, model and midsize with the highest price</h4>

<div class="language-python highlighter-rouge"><div class="highlight"><pre class="highlight"><code><span class="n">cars_dataset</span><span class="p">.</span><span class="n">iloc</span><span class="p">[</span><span class="n">np</span><span class="p">.</span><span class="n">argmax</span><span class="p">(</span><span class="n">cars_dataset</span><span class="p">[</span><span class="s">"Price"</span><span class="p">])][</span><span class="s">"Manufacturer"</span><span class="p">]</span>
</code></pre></div></div>

<div class="language-plaintext highlighter-rouge"><div class="highlight"><pre class="highlight"><code>'Mercedes-Benz'
</code></pre></div></div>

<div class="language-python highlighter-rouge"><div class="highlight"><pre class="highlight"><code><span class="n">cars_dataset</span><span class="p">.</span><span class="n">iloc</span><span class="p">[</span><span class="n">np</span><span class="p">.</span><span class="n">argmax</span><span class="p">(</span><span class="n">cars_dataset</span><span class="p">[</span><span class="s">"Price"</span><span class="p">])][</span><span class="s">"Model"</span><span class="p">]</span>
</code></pre></div></div>

<div class="language-plaintext highlighter-rouge"><div class="highlight"><pre class="highlight"><code>'300E'
</code></pre></div></div>

<div class="language-python highlighter-rouge"><div class="highlight"><pre class="highlight"><code><span class="n">cars_dataset</span><span class="p">.</span><span class="n">iloc</span><span class="p">[</span><span class="n">np</span><span class="p">.</span><span class="n">argmax</span><span class="p">(</span><span class="n">cars_dataset</span><span class="p">[</span><span class="s">"Price"</span><span class="p">])][</span><span class="s">"Type"</span><span class="p">]</span>
</code></pre></div></div>

<div class="language-plaintext highlighter-rouge"><div class="highlight"><pre class="highlight"><code>'Midsize'
</code></pre></div></div>

<p>We first find the row with the highest price using the NumPy <code class="language-plaintext highlighter-rouge">argmax</code> function by passing in the price column as an argument. With the index number of the row with the highest price, we use <code class="language-plaintext highlighter-rouge">iloc</code> to get all the columns of that row as Series and then use indexing on that Series to get the manufacturer, model and type.</p>

<h4>Row and column with the highest price</h4>

<div class="language-python highlighter-rouge"><div class="highlight"><pre class="highlight"><code><span class="n">np</span><span class="p">.</span><span class="n">where</span><span class="p">(</span><span class="n">cars_dataset</span><span class="p">.</span><span class="n">values</span> <span class="o">==</span> <span class="n">np</span><span class="p">.</span><span class="nb">max</span><span class="p">(</span><span class="n">cars_dataset</span><span class="p">[</span><span class="s">"Price"</span><span class="p">]))</span>
</code></pre></div></div>

<div class="language-plaintext highlighter-rouge"><div class="highlight"><pre class="highlight"><code>(array([58]), array([4]))
</code></pre></div></div>

<p>We use the NumPy <code class="language-plaintext highlighter-rouge">where</code> function to compares all the values in the dataset with the highest price and returns a tuple with the row and column.</p>

<h3>Ex 39: How to rename a specific column in a dataframe?</h3>

<p>Q: Rename the column Type as CarType in df and replace the ‘.’ in column names with ‘_’.</p>

<div class="language-python highlighter-rouge"><div class="highlight"><pre class="highlight"><code><span class="n">cars_dataset</span> <span class="o">=</span> <span class="n">pd</span><span class="p">.</span><span class="n">read_csv</span><span class="p">(</span><span class="s">'https://raw.githubusercontent.com/selva86/datasets/master/Cars93_miss.csv'</span><span class="p">)</span>
</code></pre></div></div>

<div class="language-python highlighter-rouge"><div class="highlight"><pre class="highlight"><code><span class="n">cars_dataset</span><span class="p">.</span><span class="n">columns</span>
</code></pre></div></div>

<div class="language-plaintext highlighter-rouge"><div class="highlight"><pre class="highlight"><code>Index(['Manufacturer', 'Model', 'Type', 'Min.Price', 'Price', 'Max.Price',
       'MPG.city', 'MPG.highway', 'AirBags', 'DriveTrain', 'Cylinders',
       'EngineSize', 'Horsepower', 'RPM', 'Rev.per.mile', 'Man.trans.avail',
       'Fuel.tank.capacity', 'Passengers', 'Length', 'Wheelbase', 'Width',
       'Turn.circle', 'Rear.seat.room', 'Luggage.room', 'Weight', 'Origin',
       'Make'],
      dtype='object')
</code></pre></div></div>

<h4>Desired output</h4>

<div class="language-python highlighter-rouge"><div class="highlight"><pre class="highlight"><code><span class="c1"># Index(['Manufacturer', 'Model', 'Type', 'Min_Price', 'Price', 'Max_Price',
#        'MPG_city', 'MPG_highway', 'AirBags', 'DriveTrain', 'Cylinders',
#        'EngineSize', 'Horsepower', 'RPM', 'Rev_per_mile', 'Man_trans_avail',
#        'Fuel_tank_capacity', 'Passengers', 'Length', 'Wheelbase', 'Width',
#        'Turn_circle', 'Rear_seat_room', 'Luggage_room', 'Weight', 'Origin',
#        'Make'],
#       dtype='object')
</span></code></pre></div></div>

<h4>Solution</h4>

<div class="language-python highlighter-rouge"><div class="highlight"><pre class="highlight"><code><span class="n">cars_dataset</span><span class="p">.</span><span class="n">columns</span><span class="p">.</span><span class="nb">str</span><span class="p">.</span><span class="n">replace</span><span class="p">(</span><span class="s">"."</span><span class="p">,</span><span class="s">"_"</span><span class="p">)</span>
</code></pre></div></div>

<div class="language-plaintext highlighter-rouge"><div class="highlight"><pre class="highlight"><code>Index(['Manufacturer', 'Model', 'Type', 'Min_Price', 'Price', 'Max_Price',
       'MPG_city', 'MPG_highway', 'AirBags', 'DriveTrain', 'Cylinders',
       'EngineSize', 'Horsepower', 'RPM', 'Rev_per_mile', 'Man_trans_avail',
       'Fuel_tank_capacity', 'Passengers', 'Length', 'Wheelbase', 'Width',
       'Turn_circle', 'Rear_seat_room', 'Luggage_room', 'Weight', 'Origin',
       'Make'],
      dtype='object')
</code></pre></div></div>

<p>To replace all the occurrences of <code class="language-plaintext highlighter-rouge">.</code> by <code class="language-plaintext highlighter-rouge">_</code> we use the <code class="language-plaintext highlighter-rouge">str</code> function which captures the columns as string data type and uses the <code class="language-plaintext highlighter-rouge">replace</code> function to achieve the column’s name change.</p>

<h3>Ex 40: How to check if a dataframe has any missing values?</h3>

<p>Q: Check if <code class="language-plaintext highlighter-rouge">cars_dataset</code> has any missing values.</p>

<div class="language-python highlighter-rouge"><div class="highlight"><pre class="highlight"><code><span class="n">cars_dataset</span> <span class="o">=</span> <span class="n">pd</span><span class="p">.</span><span class="n">read_csv</span><span class="p">(</span><span class="s">'https://raw.githubusercontent.com/selva86/datasets/master/Cars93_miss.csv'</span><span class="p">)</span>
</code></pre></div></div>

<h4>Desired output</h4>

<div class="language-python highlighter-rouge"><div class="highlight"><pre class="highlight"><code><span class="c1"># There are nan values in the dataset, so true has to be returned
</span>
<span class="c1"># True
</span></code></pre></div></div>

<h4>Solution</h4>

<div class="language-python highlighter-rouge"><div class="highlight"><pre class="highlight"><code><span class="n">cars_dataset</span><span class="p">.</span><span class="n">isnull</span><span class="p">().</span><span class="n">values</span><span class="p">.</span><span class="nb">any</span><span class="p">()</span>
</code></pre></div></div>

<div class="language-plaintext highlighter-rouge"><div class="highlight"><pre class="highlight"><code>True
</code></pre></div></div>

<p>To check if there is any <code class="language-plaintext highlighter-rouge">nan</code> value in the whole dataset, we first use the <code class="language-plaintext highlighter-rouge">isnull</code> function to return booleans in each cell of the dataframe. <code class="language-plaintext highlighter-rouge">true</code> will be returned in a cell with a <code class="language-plaintext highlighter-rouge">nan</code> value and <code class="language-plaintext highlighter-rouge">false</code> will be a cell without a <code class="language-plaintext highlighter-rouge">nan</code> value. So to check if there any <code class="language-plaintext highlighter-rouge">nan</code> in the dataset, we use <code class="language-plaintext highlighter-rouge">any</code> on the values in the dataset. If there is at least one <code class="language-plaintext highlighter-rouge">nan</code> value <code class="language-plaintext highlighter-rouge">true</code> will be returned otherwise it will be<code class="language-plaintext highlighter-rouge">false</code>.</p>

<h3>Ex 41: How to count the number of missing values in each column?</h3>

<p>Q: Count the number of missing values in each column of df. Which column has the maximum number of missing values?</p>

<div class="language-python highlighter-rouge"><div class="highlight"><pre class="highlight"><code><span class="n">cars_dataset</span> <span class="o">=</span> <span class="n">pd</span><span class="p">.</span><span class="n">read_csv</span><span class="p">(</span><span class="s">'https://raw.githubusercontent.com/selva86/datasets/master/Cars93_miss.csv'</span><span class="p">)</span>
</code></pre></div></div>

<h4>Desired output</h4>

<div class="language-python highlighter-rouge"><div class="highlight"><pre class="highlight"><code><span class="c1"># Count of missing values in each column
</span>
<span class="c1"># Manufacturer           4
# Model                  1
# Type                   3
# Min.Price              7
# Price                  2
# Max.Price              5
# MPG.city               9
# MPG.highway            2
# AirBags                6
# DriveTrain             7
# Cylinders              5
# EngineSize             2
# Horsepower             7
# RPM                    3
# Rev.per.mile           6
# Man.trans.avail        5
# Fuel.tank.capacity     8
# Passengers             2
# Length                 4
# Wheelbase              1
# Width                  6
# Turn.circle            5
# Rear.seat.room         4
# Luggage.room          19
# Weight                 7
# Origin                 5
# Make                   3
# dtype: int64
</span>
<span class="c1"># column with the maximum number of missing values
</span>
<span class="c1"># 'Luggage.room'
</span></code></pre></div></div>

<h4>Solution</h4>

<div class="language-python highlighter-rouge"><div class="highlight"><pre class="highlight"><code><span class="n">nan_per_column</span> <span class="o">=</span> <span class="n">cars_dataset</span><span class="p">.</span><span class="n">isnull</span><span class="p">().</span><span class="nb">sum</span><span class="p">()</span>
</code></pre></div></div>

<div class="language-python highlighter-rouge"><div class="highlight"><pre class="highlight"><code><span class="n">nan_per_column</span>
</code></pre></div></div>

<div class="language-plaintext highlighter-rouge"><div class="highlight"><pre class="highlight"><code>Manufacturer           4
Model                  1
Type                   3
Min.Price              7
Price                  2
Max.Price              5
MPG.city               9
MPG.highway            2
AirBags                6
DriveTrain             7
Cylinders              5
EngineSize             2
Horsepower             7
RPM                    3
Rev.per.mile           6
Man.trans.avail        5
Fuel.tank.capacity     8
Passengers             2
Length                 4
Wheelbase              1
Width                  6
Turn.circle            5
Rear.seat.room         4
Luggage.room          19
Weight                 7
Origin                 5
Make                   3
dtype: int64
</code></pre></div></div>

<div class="language-python highlighter-rouge"><div class="highlight"><pre class="highlight"><code><span class="n">cars_data</span><span class="p">.</span><span class="n">columns</span><span class="p">[</span><span class="n">nan_per_column</span><span class="p">.</span><span class="n">argmax</span><span class="p">()]</span>
</code></pre></div></div>

<div class="language-plaintext highlighter-rouge"><div class="highlight"><pre class="highlight"><code>'Luggage.room'
</code></pre></div></div>

<p>To get the count of <code class="language-plaintext highlighter-rouge">nan</code> values in each column, we use the <code class="language-plaintext highlighter-rouge">isnull</code> function. This function will return <code class="language-plaintext highlighter-rouge">True</code> in each cell where there is a <code class="language-plaintext highlighter-rouge">nan</code> value or <code class="language-plaintext highlighter-rouge">False</code> where there is any other value other than <code class="language-plaintext highlighter-rouge">nan</code>. Finally, we apply the <code class="language-plaintext highlighter-rouge">sum</code> function, to get back a series where the indexes are the column names and the values are the count of <code class="language-plaintext highlighter-rouge">nan</code> value in each column.</p>

<p>To know which column has the highest number of <code class="language-plaintext highlighter-rouge">nan</code>, we use the <code class="language-plaintext highlighter-rouge">argmax</code> function which will return the index (column name in this case) with the highest count.</p>

<h3>Ex 42: How to replace missing values of multiple numeric columns with the mean?</h3>

<p>Q: Replace missing values in <code class="language-plaintext highlighter-rouge">Min.Price</code> and <code class="language-plaintext highlighter-rouge">Max.Price</code> columns with their respective mean.</p>

<div class="language-python highlighter-rouge"><div class="highlight"><pre class="highlight"><code><span class="n">cars_dataset</span> <span class="o">=</span> <span class="n">pd</span><span class="p">.</span><span class="n">read_csv</span><span class="p">(</span><span class="s">'https://raw.githubusercontent.com/selva86/datasets/master/Cars93_miss.csv'</span><span class="p">)</span>
</code></pre></div></div>

<h4>Desired output</h4>

<p><img src="/blog/assets/post_cont_image/pandas_ex42.png" alt="Pandas_ex42" /></p>

<h4>Solution</h4>

<h4>1st Method</h4>

<div class="language-python highlighter-rouge"><div class="highlight"><pre class="highlight"><code><span class="n">min_price_mean</span> <span class="o">=</span> <span class="nb">round</span><span class="p">(</span><span class="n">cars_dataset</span><span class="p">[</span><span class="s">"Min.Price"</span><span class="p">].</span><span class="n">mean</span><span class="p">(),</span><span class="mi">2</span><span class="p">)</span>
</code></pre></div></div>

<div class="language-python highlighter-rouge"><div class="highlight"><pre class="highlight"><code><span class="n">max_price_mean</span> <span class="o">=</span> <span class="nb">round</span><span class="p">(</span><span class="n">cars_dataset</span><span class="p">[</span><span class="s">"Max.Price"</span><span class="p">].</span><span class="n">mean</span><span class="p">(),</span><span class="mi">2</span><span class="p">)</span>
</code></pre></div></div>

<div class="language-python highlighter-rouge"><div class="highlight"><pre class="highlight"><code><span class="n">cars_dataset</span><span class="p">[</span><span class="s">"Min.Price"</span><span class="p">].</span><span class="n">replace</span><span class="p">(</span><span class="n">np</span><span class="p">.</span><span class="n">nan</span><span class="p">,</span><span class="n">min_price_mean</span><span class="p">,</span><span class="n">inplace</span><span class="o">=</span><span class="bp">True</span><span class="p">)</span>
</code></pre></div></div>

<div class="language-python highlighter-rouge"><div class="highlight"><pre class="highlight"><code><span class="n">cars_dataset</span><span class="p">[</span><span class="s">"Max.Price"</span><span class="p">].</span><span class="n">replace</span><span class="p">(</span><span class="n">np</span><span class="p">.</span><span class="n">nan</span><span class="p">,</span><span class="n">max_price_mean</span><span class="p">,</span><span class="n">inplace</span><span class="o">=</span><span class="bp">True</span><span class="p">)</span>
</code></pre></div></div>

<div class="language-python highlighter-rouge"><div class="highlight"><pre class="highlight"><code><span class="n">cars_dataset</span><span class="p">.</span><span class="n">head</span><span class="p">()</span>
</code></pre></div></div>

<div>
<style scoped="">
    .dataframe tbody tr th:only-of-type {
        vertical-align: middle;
    }

    .dataframe tbody tr th {
        vertical-align: top;
    }

    .dataframe thead th {
        text-align: right;
    }
</style>
<table border="1" class="dataframe">
  <thead>
    <tr style="text-align: right;">
      <th></th>
      <th>Manufacturer</th>
      <th>Model</th>
      <th>Type</th>
      <th>Min.Price</th>
      <th>Price</th>
      <th>Max.Price</th>
      <th>MPG.city</th>
      <th>MPG.highway</th>
      <th>AirBags</th>
      <th>DriveTrain</th>
      <th>...</th>
      <th>Passengers</th>
      <th>Length</th>
      <th>Wheelbase</th>
      <th>Width</th>
      <th>Turn.circle</th>
      <th>Rear.seat.room</th>
      <th>Luggage.room</th>
      <th>Weight</th>
      <th>Origin</th>
      <th>Make</th>
    </tr>
  </thead>
  <tbody>
    <tr>
      <th>0</th>
      <td>Acura</td>
      <td>Integra</td>
      <td>Small</td>
      <td>12.90</td>
      <td>15.9</td>
      <td>18.80</td>
      <td>25.0</td>
      <td>31.0</td>
      <td>None</td>
      <td>Front</td>
      <td>...</td>
      <td>5.0</td>
      <td>177.0</td>
      <td>102.0</td>
      <td>68.0</td>
      <td>37.0</td>
      <td>26.5</td>
      <td>NaN</td>
      <td>2705.0</td>
      <td>non-USA</td>
      <td>Acura Integra</td>
    </tr>
    <tr>
      <th>1</th>
      <td>NaN</td>
      <td>Legend</td>
      <td>Midsize</td>
      <td>29.20</td>
      <td>33.9</td>
      <td>38.70</td>
      <td>18.0</td>
      <td>25.0</td>
      <td>Driver &amp; Passenger</td>
      <td>Front</td>
      <td>...</td>
      <td>5.0</td>
      <td>195.0</td>
      <td>115.0</td>
      <td>71.0</td>
      <td>38.0</td>
      <td>30.0</td>
      <td>15.0</td>
      <td>3560.0</td>
      <td>non-USA</td>
      <td>Acura Legend</td>
    </tr>
    <tr>
      <th>2</th>
      <td>Audi</td>
      <td>90</td>
      <td>Compact</td>
      <td>25.90</td>
      <td>29.1</td>
      <td>32.30</td>
      <td>20.0</td>
      <td>26.0</td>
      <td>Driver only</td>
      <td>Front</td>
      <td>...</td>
      <td>5.0</td>
      <td>180.0</td>
      <td>102.0</td>
      <td>67.0</td>
      <td>37.0</td>
      <td>28.0</td>
      <td>14.0</td>
      <td>3375.0</td>
      <td>non-USA</td>
      <td>Audi 90</td>
    </tr>
    <tr>
      <th>3</th>
      <td>Audi</td>
      <td>100</td>
      <td>Midsize</td>
      <td>17.12</td>
      <td>37.7</td>
      <td>44.60</td>
      <td>19.0</td>
      <td>26.0</td>
      <td>Driver &amp; Passenger</td>
      <td>NaN</td>
      <td>...</td>
      <td>6.0</td>
      <td>193.0</td>
      <td>106.0</td>
      <td>NaN</td>
      <td>37.0</td>
      <td>31.0</td>
      <td>17.0</td>
      <td>3405.0</td>
      <td>non-USA</td>
      <td>Audi 100</td>
    </tr>
    <tr>
      <th>4</th>
      <td>BMW</td>
      <td>535i</td>
      <td>Midsize</td>
      <td>17.12</td>
      <td>30.0</td>
      <td>21.46</td>
      <td>22.0</td>
      <td>30.0</td>
      <td>NaN</td>
      <td>Rear</td>
      <td>...</td>
      <td>4.0</td>
      <td>186.0</td>
      <td>109.0</td>
      <td>69.0</td>
      <td>39.0</td>
      <td>27.0</td>
      <td>13.0</td>
      <td>3640.0</td>
      <td>non-USA</td>
      <td>BMW 535i</td>
    </tr>
  </tbody>
</table>
<p>5 rows × 27 columns</p>
</div>

<p>The first way to solve this problem is to use the <code class="language-plaintext highlighter-rouge">replace</code> function. First, we need to find the mean of the <code class="language-plaintext highlighter-rouge">Min.Price</code> and <code class="language-plaintext highlighter-rouge">Max.Price</code> columns and round it by two decimal places using <code class="language-plaintext highlighter-rouge">round</code>.</p>

<p>After that, we select the columns and use the <code class="language-plaintext highlighter-rouge">replace</code> function to replace all the occurrences of the <code class="language-plaintext highlighter-rouge">nan</code> value with the means previously found and finally set the <code class="language-plaintext highlighter-rouge">inplace</code> argument to <code class="language-plaintext highlighter-rouge">True</code>, to apply the changes on the original dataset.</p>

<h4>2nd Method</h4>

<div class="language-python highlighter-rouge"><div class="highlight"><pre class="highlight"><code><span class="n">cars_dataset</span><span class="p">[[</span><span class="s">"Min.Price"</span><span class="p">,</span><span class="s">"Max.Price"</span><span class="p">]]</span> <span class="o">=</span> <span class="n">cars_dataset</span><span class="p">[[</span><span class="s">"Min.Price"</span><span class="p">,</span><span class="s">"Max.Price"</span><span class="p">]].</span><span class="nb">apply</span><span class="p">(</span><span class="k">lambda</span> <span class="n">x</span><span class="p">:</span> <span class="n">x</span><span class="p">.</span><span class="n">fillna</span><span class="p">(</span><span class="nb">round</span><span class="p">(</span><span class="n">x</span><span class="p">.</span><span class="n">mean</span><span class="p">(),</span><span class="mi">2</span><span class="p">)))</span>
</code></pre></div></div>

<div class="language-python highlighter-rouge"><div class="highlight"><pre class="highlight"><code><span class="n">cars_dataset</span><span class="p">.</span><span class="n">head</span><span class="p">()</span>
</code></pre></div></div>

<div>
<style scoped="">
    .dataframe tbody tr th:only-of-type {
        vertical-align: middle;
    }

    .dataframe tbody tr th {
        vertical-align: top;
    }

    .dataframe thead th {
        text-align: right;
    }
</style>
<table border="1" class="dataframe">
  <thead>
    <tr style="text-align: right;">
      <th></th>
      <th>Manufacturer</th>
      <th>Model</th>
      <th>Type</th>
      <th>Min.Price</th>
      <th>Price</th>
      <th>Max.Price</th>
      <th>MPG.city</th>
      <th>MPG.highway</th>
      <th>AirBags</th>
      <th>DriveTrain</th>
      <th>...</th>
      <th>Passengers</th>
      <th>Length</th>
      <th>Wheelbase</th>
      <th>Width</th>
      <th>Turn.circle</th>
      <th>Rear.seat.room</th>
      <th>Luggage.room</th>
      <th>Weight</th>
      <th>Origin</th>
      <th>Make</th>
    </tr>
  </thead>
  <tbody>
    <tr>
      <th>0</th>
      <td>Acura</td>
      <td>Integra</td>
      <td>Small</td>
      <td>12.90</td>
      <td>15.9</td>
      <td>18.80</td>
      <td>25.0</td>
      <td>31.0</td>
      <td>None</td>
      <td>Front</td>
      <td>...</td>
      <td>5.0</td>
      <td>177.0</td>
      <td>102.0</td>
      <td>68.0</td>
      <td>37.0</td>
      <td>26.5</td>
      <td>NaN</td>
      <td>2705.0</td>
      <td>non-USA</td>
      <td>Acura Integra</td>
    </tr>
    <tr>
      <th>1</th>
      <td>NaN</td>
      <td>Legend</td>
      <td>Midsize</td>
      <td>29.20</td>
      <td>33.9</td>
      <td>38.70</td>
      <td>18.0</td>
      <td>25.0</td>
      <td>Driver &amp; Passenger</td>
      <td>Front</td>
      <td>...</td>
      <td>5.0</td>
      <td>195.0</td>
      <td>115.0</td>
      <td>71.0</td>
      <td>38.0</td>
      <td>30.0</td>
      <td>15.0</td>
      <td>3560.0</td>
      <td>non-USA</td>
      <td>Acura Legend</td>
    </tr>
    <tr>
      <th>2</th>
      <td>Audi</td>
      <td>90</td>
      <td>Compact</td>
      <td>25.90</td>
      <td>29.1</td>
      <td>32.30</td>
      <td>20.0</td>
      <td>26.0</td>
      <td>Driver only</td>
      <td>Front</td>
      <td>...</td>
      <td>5.0</td>
      <td>180.0</td>
      <td>102.0</td>
      <td>67.0</td>
      <td>37.0</td>
      <td>28.0</td>
      <td>14.0</td>
      <td>3375.0</td>
      <td>non-USA</td>
      <td>Audi 90</td>
    </tr>
    <tr>
      <th>3</th>
      <td>Audi</td>
      <td>100</td>
      <td>Midsize</td>
      <td>17.12</td>
      <td>37.7</td>
      <td>44.60</td>
      <td>19.0</td>
      <td>26.0</td>
      <td>Driver &amp; Passenger</td>
      <td>NaN</td>
      <td>...</td>
      <td>6.0</td>
      <td>193.0</td>
      <td>106.0</td>
      <td>NaN</td>
      <td>37.0</td>
      <td>31.0</td>
      <td>17.0</td>
      <td>3405.0</td>
      <td>non-USA</td>
      <td>Audi 100</td>
    </tr>
    <tr>
      <th>4</th>
      <td>BMW</td>
      <td>535i</td>
      <td>Midsize</td>
      <td>17.12</td>
      <td>30.0</td>
      <td>21.46</td>
      <td>22.0</td>
      <td>30.0</td>
      <td>NaN</td>
      <td>Rear</td>
      <td>...</td>
      <td>4.0</td>
      <td>186.0</td>
      <td>109.0</td>
      <td>69.0</td>
      <td>39.0</td>
      <td>27.0</td>
      <td>13.0</td>
      <td>3640.0</td>
      <td>non-USA</td>
      <td>BMW 535i</td>
    </tr>
  </tbody>
</table>
<p>5 rows × 27 columns</p>
</div>

<p>The alternative way to solve this is to use the <code class="language-plaintext highlighter-rouge">fillna</code> function. We start by selecting the two columns and then use the apply function with the lambda expression and pass in the <code class="language-plaintext highlighter-rouge">mean</code> function of <code class="language-plaintext highlighter-rouge">x</code> (<code class="language-plaintext highlighter-rouge">x</code> is the column selected). Then we assign the expression to the columns to make it in place.</p>

<h3>43 : How to use the <code class="language-plaintext highlighter-rouge">apply</code> function on existing columns with global variables as additional arguments?</h3>

<p>Q: In dataframe, use the <code class="language-plaintext highlighter-rouge">apply</code> method to replace the missing values in <code class="language-plaintext highlighter-rouge">Min.Price</code> with the column’s mean and those in <code class="language-plaintext highlighter-rouge">Max.Price</code> with the column’s median.</p>

<div class="language-python highlighter-rouge"><div class="highlight"><pre class="highlight"><code><span class="n">cars_dataset</span> <span class="o">=</span> <span class="n">pd</span><span class="p">.</span><span class="n">read_csv</span><span class="p">(</span><span class="s">'https://raw.githubusercontent.com/selva86/datasets/master/Cars93_miss.csv'</span><span class="p">)</span>
</code></pre></div></div>

<h4>Desired output</h4>

<p><img src="/blog/assets/post_cont_image/pandas_ex43.png" alt="Pandas_ex43" /></p>

<h4>Solution</h4>

<div class="language-python highlighter-rouge"><div class="highlight"><pre class="highlight"><code><span class="n">dict_fun</span> <span class="o">=</span> <span class="p">{</span><span class="s">"Min.Price"</span><span class="p">:</span><span class="n">np</span><span class="p">.</span><span class="n">nanmean</span><span class="p">,</span><span class="s">"Max.Price"</span><span class="p">:</span><span class="n">np</span><span class="p">.</span><span class="n">nanmedian</span><span class="p">}</span>

<span class="n">cars_dataset</span><span class="p">[[</span><span class="s">"Min.Price"</span><span class="p">,</span><span class="s">"Max.Price"</span><span class="p">]].</span><span class="nb">apply</span><span class="p">(</span><span class="k">lambda</span> <span class="n">x</span><span class="p">,</span> <span class="n">dict_fun</span><span class="p">:</span> <span class="n">x</span><span class="p">.</span><span class="n">fillna</span><span class="p">(</span><span class="n">dict_fun</span><span class="p">[</span><span class="n">x</span><span class="p">.</span><span class="n">name</span><span class="p">](</span><span class="n">x</span><span class="p">)),</span><span class="n">args</span><span class="o">=</span><span class="p">(</span><span class="n">dict_fun</span><span class="p">,))</span>
</code></pre></div></div>

<div>
<style scoped="">
    .dataframe tbody tr th:only-of-type {
        vertical-align: middle;
    }

    .dataframe tbody tr th {
        vertical-align: top;
    }

    .dataframe thead th {
        text-align: right;
    }
</style>
<table border="1" class="dataframe">
  <thead>
    <tr style="text-align: right;">
      <th></th>
      <th>Min.Price</th>
      <th>Max.Price</th>
    </tr>
  </thead>
  <tbody>
    <tr>
      <th>0</th>
      <td>12.900000</td>
      <td>18.80</td>
    </tr>
    <tr>
      <th>1</th>
      <td>29.200000</td>
      <td>38.70</td>
    </tr>
    <tr>
      <th>2</th>
      <td>25.900000</td>
      <td>32.30</td>
    </tr>
    <tr>
      <th>3</th>
      <td>17.118605</td>
      <td>44.60</td>
    </tr>
    <tr>
      <th>4</th>
      <td>17.118605</td>
      <td>19.15</td>
    </tr>
    <tr>
      <th>...</th>
      <td>...</td>
      <td>...</td>
    </tr>
    <tr>
      <th>88</th>
      <td>16.600000</td>
      <td>22.70</td>
    </tr>
    <tr>
      <th>89</th>
      <td>17.600000</td>
      <td>22.40</td>
    </tr>
    <tr>
      <th>90</th>
      <td>22.900000</td>
      <td>23.70</td>
    </tr>
    <tr>
      <th>91</th>
      <td>21.800000</td>
      <td>23.50</td>
    </tr>
    <tr>
      <th>92</th>
      <td>24.800000</td>
      <td>28.50</td>
    </tr>
  </tbody>
</table>
<p>93 rows × 2 columns</p>
</div>

<p>We first create a dictionary with <code class="language-plaintext highlighter-rouge">Min.Price</code> column as the key and value as the NumPy function to calculate the mean, then the second value has <code class="language-plaintext highlighter-rouge">Max.Price</code> column as the key and NumPy median function as the value.</p>

<p>We select the <code class="language-plaintext highlighter-rouge">Min.Price</code> and <code class="language-plaintext highlighter-rouge">Max.Price</code> columns, apply the lambda expression, and replace in each instance of <code class="language-plaintext highlighter-rouge">nan</code> in <code class="language-plaintext highlighter-rouge">x</code>(representing the columns) by the mean or median of that column using the <code class="language-plaintext highlighter-rouge">fillna</code> function and pass in the dictionary’s value.</p>

<p><strong>Note:</strong> Refer to <a href="&quot;https://stackoverflow.com/questions/32437435/passing-additional-arguments-to-python-pandas-dataframe-apply&quot;" target="_blank">this</a> StackOverflow question to learn more.</p>

<h3>44: How to select a specific column from a dataframe as a dataframe instead of a series?</h3>

<p>Q: Get the first column <code class="language-plaintext highlighter-rouge">a</code> in dataframe as a dataframe (rather than as a Series).</p>

<div class="language-python highlighter-rouge"><div class="highlight"><pre class="highlight"><code><span class="n">tab</span> <span class="o">=</span> <span class="n">pd</span><span class="p">.</span><span class="n">DataFrame</span><span class="p">(</span><span class="n">np</span><span class="p">.</span><span class="n">arange</span><span class="p">(</span><span class="mi">20</span><span class="p">).</span><span class="n">reshape</span><span class="p">(</span><span class="o">-</span><span class="mi">1</span><span class="p">,</span> <span class="mi">5</span><span class="p">),</span> <span class="n">columns</span><span class="o">=</span><span class="nb">list</span><span class="p">(</span><span class="s">'abcde'</span><span class="p">))</span>
</code></pre></div></div>

<h4>Desired output</h4>

<p><img src="/blog/assets/post_cont_image/pandas_ex44.png" alt="Pandas_ex44" /></p>

<div class="language-python highlighter-rouge"><div class="highlight"><pre class="highlight"><code><span class="c1"># Data type
</span>
<span class="c1"># pandas.core.frame.DataFrame
</span></code></pre></div></div>

<h4>Solution</h4>

<h4>1st Method</h4>

<div class="language-python highlighter-rouge"><div class="highlight"><pre class="highlight"><code><span class="nb">type</span><span class="p">(</span><span class="n">the_dataframe</span><span class="p">[</span><span class="s">"a"</span><span class="p">].</span><span class="n">to_frame</span><span class="p">())</span>
</code></pre></div></div>

<div class="language-plaintext highlighter-rouge"><div class="highlight"><pre class="highlight"><code>pandas.core.frame.DataFrame
</code></pre></div></div>

<p>The first method is straight forward, we get column <code class="language-plaintext highlighter-rouge">a</code> as a series and then we cast it to a dataframe.</p>

<h4>2nd Method</h4>

<div class="language-python highlighter-rouge"><div class="highlight"><pre class="highlight"><code><span class="nb">type</span><span class="p">(</span><span class="n">the_dataframe</span><span class="p">.</span><span class="n">loc</span><span class="p">[:,[</span><span class="s">"a"</span><span class="p">]])</span>
</code></pre></div></div>

<div class="language-plaintext highlighter-rouge"><div class="highlight"><pre class="highlight"><code>pandas.core.frame.DataFrame
</code></pre></div></div>

<p>We can get directly deduce a column as a dataframe by using the <code class="language-plaintext highlighter-rouge">loc</code> function and pass in <strong>the name of the column with brackets around it</strong>.</p>

<h4>3rd Method</h4>

<div class="language-python highlighter-rouge"><div class="highlight"><pre class="highlight"><code><span class="nb">type</span><span class="p">(</span><span class="n">the_dataframe</span><span class="p">[[</span><span class="s">'a'</span><span class="p">]])</span>
</code></pre></div></div>

<div class="language-plaintext highlighter-rouge"><div class="highlight"><pre class="highlight"><code>pandas.core.frame.DataFrame
</code></pre></div></div>

<p>Something similar can be achieve using indexing.</p>

<h4>4th Method</h4>

<div class="language-python highlighter-rouge"><div class="highlight"><pre class="highlight"><code><span class="nb">type</span><span class="p">(</span><span class="n">the_dataframe</span><span class="p">.</span><span class="n">iloc</span><span class="p">[:,</span> <span class="p">[</span><span class="mi">0</span><span class="p">]])</span>
</code></pre></div></div>

<div class="language-plaintext highlighter-rouge"><div class="highlight"><pre class="highlight"><code>pandas.core.frame.DataFrame
</code></pre></div></div>

<p>Same as <code class="language-plaintext highlighter-rouge">iloc</code>.</p>

<p><strong>Note:</strong> If you want to understand the difference between <code class="language-plaintext highlighter-rouge">loc</code> and <code class="language-plaintext highlighter-rouge">iloc</code>, read <a href="https://stackoverflow.com/questions/31593201/how-are-iloc-and-loc-different" target="_blank">this page from StackOverflow</a></p>

<h3>Ex 45: How to change the order of columns of a Dataframe?</h3>

<p>Q:</p>

<ol>
  <li>
    <p>In <code class="language-plaintext highlighter-rouge">the_dataframe</code>, interchange columns <code class="language-plaintext highlighter-rouge">a</code> and <code class="language-plaintext highlighter-rouge">c</code>.</p>
  </li>
  <li>
    <p>Create a generic function to interchange two columns, without hardcoding column names.</p>
  </li>
  <li>
    <p>Sort the columns in reverse alphabetical order, starting from column <code class="language-plaintext highlighter-rouge">e</code> first through column <code class="language-plaintext highlighter-rouge">a</code> last.</p>
  </li>
</ol>

<div class="language-python highlighter-rouge"><div class="highlight"><pre class="highlight"><code><span class="kn">import</span> <span class="nn">pandas</span> <span class="k">as</span> <span class="n">pd</span>
<span class="kn">import</span> <span class="nn">numpy</span> <span class="k">as</span> <span class="n">np</span>
</code></pre></div></div>

<div class="language-python highlighter-rouge"><div class="highlight"><pre class="highlight"><code><span class="n">the_dataframe</span> <span class="o">=</span> <span class="n">pd</span><span class="p">.</span><span class="n">DataFrame</span><span class="p">(</span><span class="n">np</span><span class="p">.</span><span class="n">arange</span><span class="p">(</span><span class="mi">20</span><span class="p">).</span><span class="n">reshape</span><span class="p">(</span><span class="o">-</span><span class="mi">1</span><span class="p">,</span> <span class="mi">5</span><span class="p">),</span> <span class="n">columns</span><span class="o">=</span><span class="nb">list</span><span class="p">(</span><span class="s">'abcde'</span><span class="p">))</span>
</code></pre></div></div>

<h4>Desired output</h4>

<p><img src="/blog/assets/post_cont_image/pandas_ex45.png" alt="Pandas_ex45" /></p>

<h4>Solution</h4>

<h4>Q1</h4>

<div class="language-python highlighter-rouge"><div class="highlight"><pre class="highlight"><code><span class="n">the_dataframe</span>
</code></pre></div></div>

<div>
<style scoped="">
    .dataframe tbody tr th:only-of-type {
        vertical-align: middle;
    }

    .dataframe tbody tr th {
        vertical-align: top;
    }

    .dataframe thead th {
        text-align: right;
    }
</style>
<table border="1" class="dataframe">
  <thead>
    <tr style="text-align: right;">
      <th></th>
      <th>a</th>
      <th>b</th>
      <th>c</th>
      <th>d</th>
      <th>e</th>
    </tr>
  </thead>
  <tbody>
    <tr>
      <th>0</th>
      <td>0</td>
      <td>1</td>
      <td>2</td>
      <td>3</td>
      <td>4</td>
    </tr>
    <tr>
      <th>1</th>
      <td>5</td>
      <td>6</td>
      <td>7</td>
      <td>8</td>
      <td>9</td>
    </tr>
    <tr>
      <th>2</th>
      <td>10</td>
      <td>11</td>
      <td>12</td>
      <td>13</td>
      <td>14</td>
    </tr>
    <tr>
      <th>3</th>
      <td>15</td>
      <td>16</td>
      <td>17</td>
      <td>18</td>
      <td>19</td>
    </tr>
  </tbody>
</table>
</div>

<div class="language-python highlighter-rouge"><div class="highlight"><pre class="highlight"><code><span class="n">the_columns</span> <span class="o">=</span> <span class="nb">list</span><span class="p">(</span><span class="n">the_dataframe</span><span class="p">.</span><span class="n">columns</span><span class="p">)</span>
</code></pre></div></div>

<div class="language-python highlighter-rouge"><div class="highlight"><pre class="highlight"><code><span class="n">the_columns</span>
</code></pre></div></div>

<div class="language-plaintext highlighter-rouge"><div class="highlight"><pre class="highlight"><code>['a', 'b', 'c', 'd', 'e']
</code></pre></div></div>

<div class="language-python highlighter-rouge"><div class="highlight"><pre class="highlight"><code><span class="n">a</span><span class="p">,</span> <span class="n">c</span> <span class="o">=</span> <span class="n">the_columns</span><span class="p">.</span><span class="n">index</span><span class="p">(</span><span class="s">"a"</span><span class="p">),</span> <span class="n">the_columns</span><span class="p">.</span><span class="n">index</span><span class="p">(</span><span class="s">"c"</span><span class="p">)</span>
</code></pre></div></div>

<div class="language-python highlighter-rouge"><div class="highlight"><pre class="highlight"><code><span class="n">the_columns</span><span class="p">[</span><span class="n">a</span><span class="p">],</span> <span class="n">the_columns</span><span class="p">[</span><span class="n">c</span><span class="p">]</span> <span class="o">=</span> <span class="n">the_columns</span><span class="p">[</span><span class="n">c</span><span class="p">],</span> <span class="n">the_columns</span><span class="p">[</span><span class="n">a</span><span class="p">]</span>
</code></pre></div></div>

<div class="language-python highlighter-rouge"><div class="highlight"><pre class="highlight"><code><span class="n">the_dataframe</span> <span class="o">=</span> <span class="n">the_dataframe</span><span class="p">[</span><span class="n">the_columns</span><span class="p">]</span>
</code></pre></div></div>

<div class="language-python highlighter-rouge"><div class="highlight"><pre class="highlight"><code><span class="n">the_dataframe</span>
</code></pre></div></div>

<div>
<style scoped="">
    .dataframe tbody tr th:only-of-type {
        vertical-align: middle;
    }

    .dataframe tbody tr th {
        vertical-align: top;
    }

    .dataframe thead th {
        text-align: right;
    }
</style>
<table border="1" class="dataframe">
  <thead>
    <tr style="text-align: right;">
      <th></th>
      <th>c</th>
      <th>b</th>
      <th>a</th>
      <th>d</th>
      <th>e</th>
    </tr>
  </thead>
  <tbody>
    <tr>
      <th>0</th>
      <td>2</td>
      <td>1</td>
      <td>0</td>
      <td>3</td>
      <td>4</td>
    </tr>
    <tr>
      <th>1</th>
      <td>7</td>
      <td>6</td>
      <td>5</td>
      <td>8</td>
      <td>9</td>
    </tr>
    <tr>
      <th>2</th>
      <td>12</td>
      <td>11</td>
      <td>10</td>
      <td>13</td>
      <td>14</td>
    </tr>
    <tr>
      <th>3</th>
      <td>17</td>
      <td>16</td>
      <td>15</td>
      <td>18</td>
      <td>19</td>
    </tr>
  </tbody>
</table>
</div>

<p>To interchange column <code class="language-plaintext highlighter-rouge">a</code> by <code class="language-plaintext highlighter-rouge">c</code>, we first get all the column name as a list and store it in <code class="language-plaintext highlighter-rouge">the_columns</code> variable. We then extract the indexes of <code class="language-plaintext highlighter-rouge">a</code> and <code class="language-plaintext highlighter-rouge">c</code> which are 0 and 2 respectively, then swap them in <code class="language-plaintext highlighter-rouge">the_columns</code> list using the indexes previously extracted.</p>

<p>We finally use indexing in the original dataframe to now swap the columns name and values from column <code class="language-plaintext highlighter-rouge">a</code> and <code class="language-plaintext highlighter-rouge">c</code>.</p>

<h4>Q2</h4>

<div class="language-python highlighter-rouge"><div class="highlight"><pre class="highlight"><code><span class="k">def</span> <span class="nf">swap_col</span><span class="p">(</span><span class="n">col_1</span><span class="p">,</span><span class="n">col_2</span><span class="p">,</span><span class="n">df</span><span class="p">):</span>
    <span class="n">all_col</span> <span class="o">=</span> <span class="nb">list</span><span class="p">(</span><span class="n">df</span><span class="p">.</span><span class="n">columns</span><span class="p">)</span>
    <span class="n">col_1_idx</span><span class="p">,</span> <span class="n">col_2_idx</span> <span class="o">=</span> <span class="n">all_col</span><span class="p">.</span><span class="n">index</span><span class="p">(</span><span class="n">col_1</span><span class="p">),</span> <span class="n">all_col</span><span class="p">.</span><span class="n">index</span><span class="p">(</span><span class="n">col_2</span><span class="p">)</span>
    <span class="n">all_col</span><span class="p">[</span><span class="n">col_1_idx</span><span class="p">],</span><span class="n">all_col</span><span class="p">[</span><span class="n">col_2_idx</span><span class="p">]</span> <span class="o">=</span> <span class="n">all_col</span><span class="p">[</span><span class="n">col_2_idx</span><span class="p">],</span> <span class="n">all_col</span><span class="p">[</span><span class="n">col_1_idx</span><span class="p">]</span>
    <span class="k">return</span> <span class="n">df</span><span class="p">[</span><span class="n">all_col</span><span class="p">]</span>
    
    
<span class="k">print</span><span class="p">(</span><span class="n">swap_col</span><span class="p">(</span><span class="s">"d"</span><span class="p">,</span><span class="s">"b"</span><span class="p">,</span><span class="n">the_dataframe</span><span class="p">))</span>
</code></pre></div></div>

<div class="language-plaintext highlighter-rouge"><div class="highlight"><pre class="highlight"><code>    c   d   a   b   e
0   2   3   0   1   4
1   7   8   5   6   9
2  12  13  10  11  14
3  17  18  15  16  19
</code></pre></div></div>

<p>This function is based on the same steps as Q1. Instead of using the names of the columns <code class="language-plaintext highlighter-rouge">a</code> and <code class="language-plaintext highlighter-rouge">b</code>, we use generic names parameters <code class="language-plaintext highlighter-rouge">col_1</code> and <code class="language-plaintext highlighter-rouge">col_2</code> and pass in the original dataframe as <code class="language-plaintext highlighter-rouge">df</code>. The rest is the same as Q1.</p>

<h4>Q3</h4>

<div class="language-python highlighter-rouge"><div class="highlight"><pre class="highlight"><code><span class="n">the_columns_reversed</span> <span class="o">=</span> <span class="nb">sorted</span><span class="p">(</span><span class="n">the_dataframe</span><span class="p">.</span><span class="n">columns</span><span class="p">,</span><span class="n">reverse</span><span class="o">=</span><span class="bp">True</span><span class="p">)</span>
</code></pre></div></div>

<div class="language-python highlighter-rouge"><div class="highlight"><pre class="highlight"><code><span class="n">the_dataframe</span><span class="p">[</span><span class="n">the_columns_reversed</span><span class="p">]</span>
</code></pre></div></div>

<div>
<style scoped="">
    .dataframe tbody tr th:only-of-type {
        vertical-align: middle;
    }

    .dataframe tbody tr th {
        vertical-align: top;
    }

    .dataframe thead th {
        text-align: right;
    }
</style>
<table border="1" class="dataframe">
  <thead>
    <tr style="text-align: right;">
      <th></th>
      <th>e</th>
      <th>d</th>
      <th>c</th>
      <th>b</th>
      <th>a</th>
    </tr>
  </thead>
  <tbody>
    <tr>
      <th>0</th>
      <td>4</td>
      <td>3</td>
      <td>2</td>
      <td>1</td>
      <td>0</td>
    </tr>
    <tr>
      <th>1</th>
      <td>9</td>
      <td>8</td>
      <td>7</td>
      <td>6</td>
      <td>5</td>
    </tr>
    <tr>
      <th>2</th>
      <td>14</td>
      <td>13</td>
      <td>12</td>
      <td>11</td>
      <td>10</td>
    </tr>
    <tr>
      <th>3</th>
      <td>19</td>
      <td>18</td>
      <td>17</td>
      <td>16</td>
      <td>15</td>
    </tr>
  </tbody>
</table>
</div>

<p>For this subquestion, we get first the reversed list of columns starting from <code class="language-plaintext highlighter-rouge">e</code> to <code class="language-plaintext highlighter-rouge">a</code> and store it in the <code class="language-plaintext highlighter-rouge">the_columns_reversed</code> variable. We use indexing on the original dataframe to get the columns aligned in reverse alphabetical order.</p>

<h3>Ex 46: How to set the number of rows and columns displayed in the output?</h3>

<p>Q: Change the pandas display settings on printing the dataframe df it shows a maximum of 10 rows and 10 columns.</p>

<div class="language-python highlighter-rouge"><div class="highlight"><pre class="highlight"><code><span class="n">the_dataframe</span> <span class="o">=</span> <span class="n">pd</span><span class="p">.</span><span class="n">read_csv</span><span class="p">(</span><span class="s">'https://raw.githubusercontent.com/selva86/datasets/master/Cars93_miss.csv'</span><span class="p">)</span>
</code></pre></div></div>

<h4>Desired output</h4>

<p><img src="/blog/assets/post_cont_image/pandas_ex46.png" alt="Pandas_ex46" /></p>

<h4>Solution</h4>

<h4>1st Method</h4>

<div class="language-python highlighter-rouge"><div class="highlight"><pre class="highlight"><code><span class="n">pd</span><span class="p">.</span><span class="n">options</span><span class="p">.</span><span class="n">display</span><span class="p">.</span><span class="n">max_columns</span> <span class="o">=</span> <span class="mi">10</span>
<span class="n">pd</span><span class="p">.</span><span class="n">options</span><span class="p">.</span><span class="n">display</span><span class="p">.</span><span class="n">max_rows</span> <span class="o">=</span> <span class="mi">10</span>
</code></pre></div></div>

<div class="language-python highlighter-rouge"><div class="highlight"><pre class="highlight"><code><span class="n">the_dataframe</span>
</code></pre></div></div>

<div>
<style scoped="">
    .dataframe tbody tr th:only-of-type {
        vertical-align: middle;
    }

    .dataframe tbody tr th {
        vertical-align: top;
    }

    .dataframe thead th {
        text-align: right;
    }
</style>
<table border="1" class="dataframe">
  <thead>
    <tr style="text-align: right;">
      <th></th>
      <th>Manufacturer</th>
      <th>Model</th>
      <th>Type</th>
      <th>Min.Price</th>
      <th>Price</th>
      <th>...</th>
      <th>Rear.seat.room</th>
      <th>Luggage.room</th>
      <th>Weight</th>
      <th>Origin</th>
      <th>Make</th>
    </tr>
  </thead>
  <tbody>
    <tr>
      <th>0</th>
      <td>Acura</td>
      <td>Integra</td>
      <td>Small</td>
      <td>12.9</td>
      <td>15.9</td>
      <td>...</td>
      <td>26.5</td>
      <td>NaN</td>
      <td>2705.0</td>
      <td>non-USA</td>
      <td>Acura Integra</td>
    </tr>
    <tr>
      <th>1</th>
      <td>NaN</td>
      <td>Legend</td>
      <td>Midsize</td>
      <td>29.2</td>
      <td>33.9</td>
      <td>...</td>
      <td>30.0</td>
      <td>15.0</td>
      <td>3560.0</td>
      <td>non-USA</td>
      <td>Acura Legend</td>
    </tr>
    <tr>
      <th>2</th>
      <td>Audi</td>
      <td>90</td>
      <td>Compact</td>
      <td>25.9</td>
      <td>29.1</td>
      <td>...</td>
      <td>28.0</td>
      <td>14.0</td>
      <td>3375.0</td>
      <td>non-USA</td>
      <td>Audi 90</td>
    </tr>
    <tr>
      <th>3</th>
      <td>Audi</td>
      <td>100</td>
      <td>Midsize</td>
      <td>NaN</td>
      <td>37.7</td>
      <td>...</td>
      <td>31.0</td>
      <td>17.0</td>
      <td>3405.0</td>
      <td>non-USA</td>
      <td>Audi 100</td>
    </tr>
    <tr>
      <th>4</th>
      <td>BMW</td>
      <td>535i</td>
      <td>Midsize</td>
      <td>NaN</td>
      <td>30.0</td>
      <td>...</td>
      <td>27.0</td>
      <td>13.0</td>
      <td>3640.0</td>
      <td>non-USA</td>
      <td>BMW 535i</td>
    </tr>
    <tr>
      <th>...</th>
      <td>...</td>
      <td>...</td>
      <td>...</td>
      <td>...</td>
      <td>...</td>
      <td>...</td>
      <td>...</td>
      <td>...</td>
      <td>...</td>
      <td>...</td>
      <td>...</td>
    </tr>
    <tr>
      <th>88</th>
      <td>Volkswagen</td>
      <td>Eurovan</td>
      <td>Van</td>
      <td>16.6</td>
      <td>19.7</td>
      <td>...</td>
      <td>34.0</td>
      <td>NaN</td>
      <td>3960.0</td>
      <td>NaN</td>
      <td>Volkswagen Eurovan</td>
    </tr>
    <tr>
      <th>89</th>
      <td>Volkswagen</td>
      <td>Passat</td>
      <td>Compact</td>
      <td>17.6</td>
      <td>20.0</td>
      <td>...</td>
      <td>31.5</td>
      <td>14.0</td>
      <td>2985.0</td>
      <td>non-USA</td>
      <td>Volkswagen Passat</td>
    </tr>
    <tr>
      <th>90</th>
      <td>Volkswagen</td>
      <td>Corrado</td>
      <td>Sporty</td>
      <td>22.9</td>
      <td>23.3</td>
      <td>...</td>
      <td>26.0</td>
      <td>15.0</td>
      <td>2810.0</td>
      <td>non-USA</td>
      <td>Volkswagen Corrado</td>
    </tr>
    <tr>
      <th>91</th>
      <td>Volvo</td>
      <td>240</td>
      <td>Compact</td>
      <td>21.8</td>
      <td>22.7</td>
      <td>...</td>
      <td>29.5</td>
      <td>14.0</td>
      <td>2985.0</td>
      <td>non-USA</td>
      <td>Volvo 240</td>
    </tr>
    <tr>
      <th>92</th>
      <td>NaN</td>
      <td>850</td>
      <td>Midsize</td>
      <td>24.8</td>
      <td>26.7</td>
      <td>...</td>
      <td>30.0</td>
      <td>15.0</td>
      <td>3245.0</td>
      <td>non-USA</td>
      <td>Volvo 850</td>
    </tr>
  </tbody>
</table>
<p>93 rows × 27 columns</p>
</div>

<h4>2nd Method</h4>

<div class="language-python highlighter-rouge"><div class="highlight"><pre class="highlight"><code><span class="n">pd</span><span class="p">.</span><span class="n">set_option</span><span class="p">(</span><span class="s">'display.max_columns'</span><span class="p">,</span> <span class="mi">10</span><span class="p">)</span>
<span class="n">pd</span><span class="p">.</span><span class="n">set_option</span><span class="p">(</span><span class="s">'display.max_rows'</span><span class="p">,</span> <span class="mi">10</span><span class="p">)</span>
</code></pre></div></div>

<div class="language-python highlighter-rouge"><div class="highlight"><pre class="highlight"><code><span class="n">the_dataframe</span>
</code></pre></div></div>

<div>
<style scoped="">
    .dataframe tbody tr th:only-of-type {
        vertical-align: middle;
    }

    .dataframe tbody tr th {
        vertical-align: top;
    }

    .dataframe thead th {
        text-align: right;
    }
</style>
<table border="1" class="dataframe">
  <thead>
    <tr style="text-align: right;">
      <th></th>
      <th>Manufacturer</th>
      <th>Model</th>
      <th>Type</th>
      <th>Min.Price</th>
      <th>Price</th>
      <th>...</th>
      <th>Rear.seat.room</th>
      <th>Luggage.room</th>
      <th>Weight</th>
      <th>Origin</th>
      <th>Make</th>
    </tr>
  </thead>
  <tbody>
    <tr>
      <th>0</th>
      <td>Acura</td>
      <td>Integra</td>
      <td>Small</td>
      <td>12.9</td>
      <td>15.9</td>
      <td>...</td>
      <td>26.5</td>
      <td>NaN</td>
      <td>2705.0</td>
      <td>non-USA</td>
      <td>Acura Integra</td>
    </tr>
    <tr>
      <th>1</th>
      <td>NaN</td>
      <td>Legend</td>
      <td>Midsize</td>
      <td>29.2</td>
      <td>33.9</td>
      <td>...</td>
      <td>30.0</td>
      <td>15.0</td>
      <td>3560.0</td>
      <td>non-USA</td>
      <td>Acura Legend</td>
    </tr>
    <tr>
      <th>2</th>
      <td>Audi</td>
      <td>90</td>
      <td>Compact</td>
      <td>25.9</td>
      <td>29.1</td>
      <td>...</td>
      <td>28.0</td>
      <td>14.0</td>
      <td>3375.0</td>
      <td>non-USA</td>
      <td>Audi 90</td>
    </tr>
    <tr>
      <th>3</th>
      <td>Audi</td>
      <td>100</td>
      <td>Midsize</td>
      <td>NaN</td>
      <td>37.7</td>
      <td>...</td>
      <td>31.0</td>
      <td>17.0</td>
      <td>3405.0</td>
      <td>non-USA</td>
      <td>Audi 100</td>
    </tr>
    <tr>
      <th>4</th>
      <td>BMW</td>
      <td>535i</td>
      <td>Midsize</td>
      <td>NaN</td>
      <td>30.0</td>
      <td>...</td>
      <td>27.0</td>
      <td>13.0</td>
      <td>3640.0</td>
      <td>non-USA</td>
      <td>BMW 535i</td>
    </tr>
    <tr>
      <th>...</th>
      <td>...</td>
      <td>...</td>
      <td>...</td>
      <td>...</td>
      <td>...</td>
      <td>...</td>
      <td>...</td>
      <td>...</td>
      <td>...</td>
      <td>...</td>
      <td>...</td>
    </tr>
    <tr>
      <th>88</th>
      <td>Volkswagen</td>
      <td>Eurovan</td>
      <td>Van</td>
      <td>16.6</td>
      <td>19.7</td>
      <td>...</td>
      <td>34.0</td>
      <td>NaN</td>
      <td>3960.0</td>
      <td>NaN</td>
      <td>Volkswagen Eurovan</td>
    </tr>
    <tr>
      <th>89</th>
      <td>Volkswagen</td>
      <td>Passat</td>
      <td>Compact</td>
      <td>17.6</td>
      <td>20.0</td>
      <td>...</td>
      <td>31.5</td>
      <td>14.0</td>
      <td>2985.0</td>
      <td>non-USA</td>
      <td>Volkswagen Passat</td>
    </tr>
    <tr>
      <th>90</th>
      <td>Volkswagen</td>
      <td>Corrado</td>
      <td>Sporty</td>
      <td>22.9</td>
      <td>23.3</td>
      <td>...</td>
      <td>26.0</td>
      <td>15.0</td>
      <td>2810.0</td>
      <td>non-USA</td>
      <td>Volkswagen Corrado</td>
    </tr>
    <tr>
      <th>91</th>
      <td>Volvo</td>
      <td>240</td>
      <td>Compact</td>
      <td>21.8</td>
      <td>22.7</td>
      <td>...</td>
      <td>29.5</td>
      <td>14.0</td>
      <td>2985.0</td>
      <td>non-USA</td>
      <td>Volvo 240</td>
    </tr>
    <tr>
      <th>92</th>
      <td>NaN</td>
      <td>850</td>
      <td>Midsize</td>
      <td>24.8</td>
      <td>26.7</td>
      <td>...</td>
      <td>30.0</td>
      <td>15.0</td>
      <td>3245.0</td>
      <td>non-USA</td>
      <td>Volvo 850</td>
    </tr>
  </tbody>
</table>
<p>93 rows × 27 columns</p>
</div>

<p>By change the <code class="language-plaintext highlighter-rouge">max_columns</code> or <code class="language-plaintext highlighter-rouge">max_rows</code> from the pandas’ display option either by using the dot operator or by calling the <code class="language-plaintext highlighter-rouge">set_option</code>, we can print only the five first and last rows/columns. All the rows/columns in between are abstracted by three dotes<code class="language-plaintext highlighter-rouge">...</code></p>

<h3>Ex 47: How to format or suppress scientific notations in a pandas dataframe?</h3>

<p>Q: Suppress scientific notations like <code class="language-plaintext highlighter-rouge">e-03</code> in <code class="language-plaintext highlighter-rouge">the_dataframe</code> and print up to 4 numbers after the decimal.</p>

<div class="language-python highlighter-rouge"><div class="highlight"><pre class="highlight"><code><span class="n">the_dataframe</span> <span class="o">=</span> <span class="n">pd</span><span class="p">.</span><span class="n">DataFrame</span><span class="p">(</span><span class="n">np</span><span class="p">.</span><span class="n">random</span><span class="p">.</span><span class="n">random</span><span class="p">(</span><span class="mi">4</span><span class="p">)</span><span class="o">**</span><span class="mi">10</span><span class="p">,</span> <span class="n">columns</span><span class="o">=</span><span class="p">[</span><span class="s">'random'</span><span class="p">])</span>
</code></pre></div></div>

<div class="language-python highlighter-rouge"><div class="highlight"><pre class="highlight"><code><span class="n">the_dataframe</span>
</code></pre></div></div>

<div>
<style scoped="">
    .dataframe tbody tr th:only-of-type {
        vertical-align: middle;
    }

    .dataframe tbody tr th {
        vertical-align: top;
    }

    .dataframe thead th {
        text-align: right;
    }
</style>
<table border="1" class="dataframe">
  <thead>
    <tr style="text-align: right;">
      <th></th>
      <th>random</th>
    </tr>
  </thead>
  <tbody>
    <tr>
      <th>0</th>
      <td>7.694142e-18</td>
    </tr>
    <tr>
      <th>1</th>
      <td>2.132125e-02</td>
    </tr>
    <tr>
      <th>2</th>
      <td>1.673025e-02</td>
    </tr>
    <tr>
      <th>3</th>
      <td>3.668673e-01</td>
    </tr>
  </tbody>
</table>
</div>

<h4>Desired output</h4>

<div class="language-python highlighter-rouge"><div class="highlight"><pre class="highlight"><code><span class="c1"># Your result will be different from mine as the numbers are randomly generated
</span></code></pre></div></div>

<p><img src="/blog/assets/post_cont_image/pandas_ex47.png" alt="Pandas_ex47" /></p>

<h4>Solution</h4>

<h4>1st Method</h4>

<div class="language-python highlighter-rouge"><div class="highlight"><pre class="highlight"><code><span class="n">pd</span><span class="p">.</span><span class="n">options</span><span class="p">.</span><span class="n">display</span><span class="p">.</span><span class="n">float_format</span> <span class="o">=</span> <span class="s">'{:.4f}'</span><span class="p">.</span><span class="nb">format</span>
</code></pre></div></div>

<div class="language-python highlighter-rouge"><div class="highlight"><pre class="highlight"><code><span class="n">the_dataframe</span>
</code></pre></div></div>

<div>
<style scoped="">
    .dataframe tbody tr th:only-of-type {
        vertical-align: middle;
    }

    .dataframe tbody tr th {
        vertical-align: top;
    }

    .dataframe thead th {
        text-align: right;
    }
</style>
<table border="1" class="dataframe">
  <thead>
    <tr style="text-align: right;">
      <th></th>
      <th>random</th>
    </tr>
  </thead>
  <tbody>
    <tr>
      <th>0</th>
      <td>0.0000</td>
    </tr>
    <tr>
      <th>1</th>
      <td>0.0213</td>
    </tr>
    <tr>
      <th>2</th>
      <td>0.0167</td>
    </tr>
    <tr>
      <th>3</th>
      <td>0.3669</td>
    </tr>
  </tbody>
</table>
</div>

<h4>2nd Method</h4>

<div class="language-python highlighter-rouge"><div class="highlight"><pre class="highlight"><code><span class="n">pd</span><span class="p">.</span><span class="n">set_option</span><span class="p">(</span><span class="s">"display.float_format"</span><span class="p">,</span> <span class="s">'{:.4f}'</span><span class="p">.</span><span class="nb">format</span><span class="p">)</span>
</code></pre></div></div>

<div class="language-python highlighter-rouge"><div class="highlight"><pre class="highlight"><code><span class="n">the_dataframe</span>
</code></pre></div></div>

<div>
<style scoped="">
    .dataframe tbody tr th:only-of-type {
        vertical-align: middle;
    }

    .dataframe tbody tr th {
        vertical-align: top;
    }

    .dataframe thead th {
        text-align: right;
    }
</style>
<table border="1" class="dataframe">
  <thead>
    <tr style="text-align: right;">
      <th></th>
      <th>random</th>
    </tr>
  </thead>
  <tbody>
    <tr>
      <th>0</th>
      <td>0.0000</td>
    </tr>
    <tr>
      <th>1</th>
      <td>0.0213</td>
    </tr>
    <tr>
      <th>2</th>
      <td>0.0167</td>
    </tr>
    <tr>
      <th>3</th>
      <td>0.3669</td>
    </tr>
  </tbody>
</table>
</div>

<p>To suppress the scientific notation, we use <code class="language-plaintext highlighter-rouge">display.float_format</code> or the <code class="language-plaintext highlighter-rouge">set_option</code> function just like we did in the previous exercise and we use this time <code class="language-plaintext highlighter-rouge">'{:.4f}'.format</code> to tell Pandas that we want to display numbers with a four decimal points.</p>

<h3>Ex 48: How to format all the values in a Dataframe as percentages?</h3>

<p>Q: Format the values in column <code class="language-plaintext highlighter-rouge">random</code> of <code class="language-plaintext highlighter-rouge">the_dataframe</code> as percentages.</p>

<div class="language-python highlighter-rouge"><div class="highlight"><pre class="highlight"><code><span class="n">the_dataframe</span> <span class="o">=</span> <span class="n">pd</span><span class="p">.</span><span class="n">DataFrame</span><span class="p">(</span><span class="n">np</span><span class="p">.</span><span class="n">random</span><span class="p">.</span><span class="n">random</span><span class="p">(</span><span class="mi">4</span><span class="p">),</span> <span class="n">columns</span><span class="o">=</span><span class="p">[</span><span class="s">'random'</span><span class="p">])</span>
</code></pre></div></div>

<div class="language-python highlighter-rouge"><div class="highlight"><pre class="highlight"><code><span class="n">the_dataframe</span>
</code></pre></div></div>

<div>
<style scoped="">
    .dataframe tbody tr th:only-of-type {
        vertical-align: middle;
    }

    .dataframe tbody tr th {
        vertical-align: top;
    }

    .dataframe thead th {
        text-align: right;
    }
</style>
<table border="1" class="dataframe">
  <thead>
    <tr style="text-align: right;">
      <th></th>
      <th>random</th>
    </tr>
  </thead>
  <tbody>
    <tr>
      <th>0</th>
      <td>0.5170</td>
    </tr>
    <tr>
      <th>1</th>
      <td>0.0474</td>
    </tr>
    <tr>
      <th>2</th>
      <td>0.4878</td>
    </tr>
    <tr>
      <th>3</th>
      <td>0.9220</td>
    </tr>
  </tbody>
</table>
</div>

<h4>Desired output</h4>

<div class="language-python highlighter-rouge"><div class="highlight"><pre class="highlight"><code><span class="c1"># Your result will be different from mine as the numbers are randomly generated
</span></code></pre></div></div>

<p><img src="/blog/assets/post_cont_image/pandas_ex48.png" alt="Pandas_ex48" /></p>

<h4>Solution</h4>

<h4>1st Method</h4>

<div class="language-python highlighter-rouge"><div class="highlight"><pre class="highlight"><code><span class="n">pd</span><span class="p">.</span><span class="n">set_option</span><span class="p">(</span><span class="s">"display.float_format"</span><span class="p">,</span> <span class="s">'{:.2%}'</span><span class="p">.</span><span class="nb">format</span><span class="p">)</span>
</code></pre></div></div>

<div class="language-python highlighter-rouge"><div class="highlight"><pre class="highlight"><code><span class="n">the_dataframe</span>
</code></pre></div></div>

<div>
<style scoped="">
    .dataframe tbody tr th:only-of-type {
        vertical-align: middle;
    }

    .dataframe tbody tr th {
        vertical-align: top;
    }

    .dataframe thead th {
        text-align: right;
    }
</style>
<table border="1" class="dataframe">
  <thead>
    <tr style="text-align: right;">
      <th></th>
      <th>random</th>
    </tr>
  </thead>
  <tbody>
    <tr>
      <th>0</th>
      <td>51.70%</td>
    </tr>
    <tr>
      <th>1</th>
      <td>4.74%</td>
    </tr>
    <tr>
      <th>2</th>
      <td>48.78%</td>
    </tr>
    <tr>
      <th>3</th>
      <td>92.20%</td>
    </tr>
  </tbody>
</table>
</div>

<h4>2nd Method</h4>

<div class="language-python highlighter-rouge"><div class="highlight"><pre class="highlight"><code><span class="n">pd</span><span class="p">.</span><span class="n">options</span><span class="p">.</span><span class="n">display</span><span class="p">.</span><span class="n">float_format</span> <span class="o">=</span> <span class="s">'{:.2%}'</span><span class="p">.</span><span class="nb">format</span>
</code></pre></div></div>

<div class="language-python highlighter-rouge"><div class="highlight"><pre class="highlight"><code><span class="n">the_dataframe</span>
</code></pre></div></div>

<div>
<style scoped="">
    .dataframe tbody tr th:only-of-type {
        vertical-align: middle;
    }

    .dataframe tbody tr th {
        vertical-align: top;
    }

    .dataframe thead th {
        text-align: right;
    }
</style>
<table border="1" class="dataframe">
  <thead>
    <tr style="text-align: right;">
      <th></th>
      <th>random</th>
    </tr>
  </thead>
  <tbody>
    <tr>
      <th>0</th>
      <td>51.70%</td>
    </tr>
    <tr>
      <th>1</th>
      <td>4.74%</td>
    </tr>
    <tr>
      <th>2</th>
      <td>48.78%</td>
    </tr>
    <tr>
      <th>3</th>
      <td>92.20%</td>
    </tr>
  </tbody>
</table>
</div>

<p>Just as we did in the previous exercise, we use <code class="language-plaintext highlighter-rouge">display.float_format</code> or the <code class="language-plaintext highlighter-rouge">set_option</code> function but this time to display the values as percentages, we use <code class="language-plaintext highlighter-rouge">'{:.2%}'.format</code>.</p>

<h3>Ex 49: How to filter every nth row in a Dataframe?</h3>

<p>Q: From <code class="language-plaintext highlighter-rouge">cars_dataset</code>, filter the <code class="language-plaintext highlighter-rouge">Manufacturer</code>, <code class="language-plaintext highlighter-rouge">Model</code> and <code class="language-plaintext highlighter-rouge">Type</code> for every 20th row starting from 1st (row 0).</p>

<div class="language-python highlighter-rouge"><div class="highlight"><pre class="highlight"><code><span class="n">cars_dataset</span> <span class="o">=</span> <span class="n">pd</span><span class="p">.</span><span class="n">read_csv</span><span class="p">(</span><span class="s">'https://raw.githubusercontent.com/selva86/datasets/master/Cars93_miss.csv'</span><span class="p">)</span>
</code></pre></div></div>

<h4>Desired output</h4>

<p><img src="/blog/assets/post_cont_image/pandas_ex49.png" alt="Pandas_ex49" /></p>

<h4>Solution</h4>

<div class="language-python highlighter-rouge"><div class="highlight"><pre class="highlight"><code><span class="n">cars_dataset</span><span class="p">[[</span><span class="s">"Manufacturer"</span><span class="p">,</span> <span class="s">"Model"</span><span class="p">,</span> <span class="s">"Type"</span><span class="p">]][::</span><span class="mi">20</span><span class="p">]</span>
</code></pre></div></div>

<div>
<style scoped="">
    .dataframe tbody tr th:only-of-type {
        vertical-align: middle;
    }

    .dataframe tbody tr th {
        vertical-align: top;
    }

    .dataframe thead th {
        text-align: right;
    }
</style>
<table border="1" class="dataframe">
  <thead>
    <tr style="text-align: right;">
      <th></th>
      <th>Manufacturer</th>
      <th>Model</th>
      <th>Type</th>
    </tr>
  </thead>
  <tbody>
    <tr>
      <th>0</th>
      <td>Acura</td>
      <td>Integra</td>
      <td>Small</td>
    </tr>
    <tr>
      <th>20</th>
      <td>Chrysler</td>
      <td>LeBaron</td>
      <td>Compact</td>
    </tr>
    <tr>
      <th>40</th>
      <td>Honda</td>
      <td>Prelude</td>
      <td>Sporty</td>
    </tr>
    <tr>
      <th>60</th>
      <td>Mercury</td>
      <td>Cougar</td>
      <td>Midsize</td>
    </tr>
    <tr>
      <th>80</th>
      <td>Subaru</td>
      <td>Loyale</td>
      <td>Small</td>
    </tr>
  </tbody>
</table>
</div>

<p>We start by selecting the 3 columns and step by 20 on each row using indexing.</p>

<h3>Ex 50: How to create a primary key index by combining relevant columns?</h3>

<p>Q: In <code class="language-plaintext highlighter-rouge">cars_dataset</code>, Replace NaNs with <code class="language-plaintext highlighter-rouge">missing</code> in columns <code class="language-plaintext highlighter-rouge">Manufacturer</code>, <code class="language-plaintext highlighter-rouge">Model</code> and <code class="language-plaintext highlighter-rouge">Type</code> and create an index as a combination of these three columns and check if the index is a primary key.</p>

<div class="language-python highlighter-rouge"><div class="highlight"><pre class="highlight"><code><span class="n">cars_dataset</span> <span class="o">=</span> <span class="n">pd</span><span class="p">.</span><span class="n">read_csv</span><span class="p">(</span><span class="s">'https://raw.githubusercontent.com/selva86/datasets/master/Cars93_miss.csv'</span><span class="p">,</span> <span class="n">usecols</span><span class="o">=</span><span class="p">[</span><span class="mi">0</span><span class="p">,</span><span class="mi">1</span><span class="p">,</span><span class="mi">2</span><span class="p">,</span><span class="mi">3</span><span class="p">,</span><span class="mi">5</span><span class="p">])</span>
</code></pre></div></div>

<h4>Desired output</h4>

<p><img src="/blog/assets/post_cont_image/pandas_ex50.png" alt="Pandas_ex50" /></p>

<h4>Solution</h4>

<div class="language-python highlighter-rouge"><div class="highlight"><pre class="highlight"><code><span class="n">replaced_nan</span> <span class="o">=</span> <span class="n">cars_dataset</span><span class="p">[[</span><span class="s">"Manufacturer"</span><span class="p">,</span> <span class="s">"Model"</span><span class="p">,</span> <span class="s">"Type"</span><span class="p">]].</span><span class="n">fillna</span><span class="p">(</span><span class="n">value</span><span class="o">=</span><span class="s">"missing"</span><span class="p">)</span>
</code></pre></div></div>

<div class="language-python highlighter-rouge"><div class="highlight"><pre class="highlight"><code><span class="n">replaced_nan</span>
</code></pre></div></div>

<div>
<style scoped="">
    .dataframe tbody tr th:only-of-type {
        vertical-align: middle;
    }

    .dataframe tbody tr th {
        vertical-align: top;
    }

    .dataframe thead th {
        text-align: right;
    }
</style>
<table border="1" class="dataframe">
  <thead>
    <tr style="text-align: right;">
      <th></th>
      <th>Manufacturer</th>
      <th>Model</th>
      <th>Type</th>
    </tr>
  </thead>
  <tbody>
    <tr>
      <th>0</th>
      <td>Acura</td>
      <td>Integra</td>
      <td>Small</td>
    </tr>
    <tr>
      <th>1</th>
      <td>missing</td>
      <td>Legend</td>
      <td>Midsize</td>
    </tr>
    <tr>
      <th>2</th>
      <td>Audi</td>
      <td>90</td>
      <td>Compact</td>
    </tr>
    <tr>
      <th>3</th>
      <td>Audi</td>
      <td>100</td>
      <td>Midsize</td>
    </tr>
    <tr>
      <th>4</th>
      <td>BMW</td>
      <td>535i</td>
      <td>Midsize</td>
    </tr>
    <tr>
      <th>...</th>
      <td>...</td>
      <td>...</td>
      <td>...</td>
    </tr>
    <tr>
      <th>88</th>
      <td>Volkswagen</td>
      <td>Eurovan</td>
      <td>Van</td>
    </tr>
    <tr>
      <th>89</th>
      <td>Volkswagen</td>
      <td>Passat</td>
      <td>Compact</td>
    </tr>
    <tr>
      <th>90</th>
      <td>Volkswagen</td>
      <td>Corrado</td>
      <td>Sporty</td>
    </tr>
    <tr>
      <th>91</th>
      <td>Volvo</td>
      <td>240</td>
      <td>Compact</td>
    </tr>
    <tr>
      <th>92</th>
      <td>missing</td>
      <td>850</td>
      <td>Midsize</td>
    </tr>
  </tbody>
</table>
<p>93 rows × 3 columns</p>
</div>

<div class="language-python highlighter-rouge"><div class="highlight"><pre class="highlight"><code><span class="n">replaced_nan</span><span class="p">.</span><span class="n">set_index</span><span class="p">(</span><span class="n">replaced_nan</span><span class="p">[</span><span class="s">"Manufacturer"</span><span class="p">]</span><span class="o">+</span><span class="s">"_"</span><span class="o">+</span><span class="n">replaced_nan</span><span class="p">[</span><span class="s">"Model"</span><span class="p">]</span><span class="o">+</span><span class="s">"_"</span><span class="o">+</span><span class="n">replaced_nan</span><span class="p">[</span><span class="s">"Type"</span><span class="p">])</span>
</code></pre></div></div>

<div>
<style scoped="">
    .dataframe tbody tr th:only-of-type {
        vertical-align: middle;
    }

    .dataframe tbody tr th {
        vertical-align: top;
    }

    .dataframe thead th {
        text-align: right;
    }
</style>
<table border="1" class="dataframe">
  <thead>
    <tr style="text-align: right;">
      <th></th>
      <th>Manufacturer</th>
      <th>Model</th>
      <th>Type</th>
    </tr>
  </thead>
  <tbody>
    <tr>
      <th>Acura_Integra_Small</th>
      <td>Acura</td>
      <td>Integra</td>
      <td>Small</td>
    </tr>
    <tr>
      <th>missing_Legend_Midsize</th>
      <td>missing</td>
      <td>Legend</td>
      <td>Midsize</td>
    </tr>
    <tr>
      <th>Audi_90_Compact</th>
      <td>Audi</td>
      <td>90</td>
      <td>Compact</td>
    </tr>
    <tr>
      <th>Audi_100_Midsize</th>
      <td>Audi</td>
      <td>100</td>
      <td>Midsize</td>
    </tr>
    <tr>
      <th>BMW_535i_Midsize</th>
      <td>BMW</td>
      <td>535i</td>
      <td>Midsize</td>
    </tr>
    <tr>
      <th>...</th>
      <td>...</td>
      <td>...</td>
      <td>...</td>
    </tr>
    <tr>
      <th>Volkswagen_Eurovan_Van</th>
      <td>Volkswagen</td>
      <td>Eurovan</td>
      <td>Van</td>
    </tr>
    <tr>
      <th>Volkswagen_Passat_Compact</th>
      <td>Volkswagen</td>
      <td>Passat</td>
      <td>Compact</td>
    </tr>
    <tr>
      <th>Volkswagen_Corrado_Sporty</th>
      <td>Volkswagen</td>
      <td>Corrado</td>
      <td>Sporty</td>
    </tr>
    <tr>
      <th>Volvo_240_Compact</th>
      <td>Volvo</td>
      <td>240</td>
      <td>Compact</td>
    </tr>
    <tr>
      <th>missing_850_Midsize</th>
      <td>missing</td>
      <td>850</td>
      <td>Midsize</td>
    </tr>
  </tbody>
</table>
<p>93 rows × 3 columns</p>
</div>

<p>We first select the 3 columns and use the <code class="language-plaintext highlighter-rouge">fillna</code> function to replace all the occurrences of <code class="language-plaintext highlighter-rouge">nan</code> by the string <code class="language-plaintext highlighter-rouge">missing</code> then store it the <code class="language-plaintext highlighter-rouge">replace_nan</code> variable.</p>

<p>We call the <code class="language-plaintext highlighter-rouge">set_index</code> function on that dataframe to give it a new index column whereby each index value is a concatenation of the values from <code class="language-plaintext highlighter-rouge">Manufacturer</code> with the values in <code class="language-plaintext highlighter-rouge">Model</code> and lastly the values in <code class="language-plaintext highlighter-rouge">Type</code>.</p>

<h3>Conclusion</h3>

<p>In this part 2 of the pandas series, we have introduced the dataframe data structure which is the main data structure of Pandas. We have discovered how to import data from a CSV file, different ways to manipulate the data and many more techniques that you will be using on a daily basis if you will be working as a machine learning engineer or data scientist.</p>

<p>Remember that 60% of the time spent on end-to-end machine learning project is dedicated to data cleaning and visualization. So Pandas, NumPy and Matplotlib (and Seaborn) are fantastic tools to learn and master. Practice makes perfect.</p>

<p>In the next post, we will explore more advanced Pandas exercises that I am sure you will enjoy. Find the jupyter notebook version of this post on my GitHub profile <a href="https://github.com/semasuka/blog/blob/gh-pages/ipynb/Pandas%20Exercise%20Part%202.ipynb" target="_blank">here</a>.</p>

<p>Thank you again for doing these exercises with me. I hope you have learned one or two things. If you like this post, please subscribe to stay updated with new posts, and if you have a thought or a question, I would love to hear it by commenting below. Cheers, and keep learning!</p>]]></content><author><name>Stern Semasuka</name></author><category term="python" /><category term="exercises" /><category term="pandas" /><summary type="html"><![CDATA[Welcome back, guys! We will continue with part 2 in this series of Pandas exercise. I am very excited about this post because we will introducing DataFrame, the most used Pandas data structure. I hope you guys will enjoy this post.]]></summary><media:thumbnail xmlns:media="http://search.yahoo.com/mrss/" url="https://semasuka.github.io/blog/blog/assets/post_images/pandas.jpg" /><media:content medium="image" url="https://semasuka.github.io/blog/blog/assets/post_images/pandas.jpg" xmlns:media="http://search.yahoo.com/mrss/" /></entry><entry><title type="html">Pandas Exercises Part 1</title><link href="https://semasuka.github.io/blog/blog/2020/09/24/pandas-exercises-part-1.html" rel="alternate" type="text/html" title="Pandas Exercises Part 1" /><published>2020-09-24T00:00:00+00:00</published><updated>2020-09-24T00:00:00+00:00</updated><id>https://semasuka.github.io/blog/blog/2020/09/24/pandas-exercises-part-1</id><content type="html" xml:base="https://semasuka.github.io/blog/blog/2020/09/24/pandas-exercises-part-1.html"><![CDATA[<p>Welcome back, folks! In this series of 3 blog post, we will be discussing pandas which one of my favorite python libraries. We will go through 74 exercises to solidify your skills with pandas and as usual, I will explain the WHY behind every single exercise.<!-- more --></p>

<p>Pandas is a powerful open-source library for data analysis and data manipulation. The library is packed with a ton of feature, well supported and documented by the community. It is built on top of NumPy and integrate well with all the main machine learning libraries like Scikit-learn and Matplotlib.</p>

<p>Pandas already come bundles in the Anaconda distribution. If you don’t have it installed already, please refer to my other blog <a href="https://semasuka.github.io/blog/2019/01/06/introduction-to-jupyter-notebook.html" target="_blank">here</a> to get you started.</p>

<p>These exercises are inspired from <a href="https://www.machinelearningplus.com/python/101-pandas-exercises-python/" target="_blank">this</a> amazing blog post.</p>

<p>Remember there is always different ways we can achieve the same result, so if your code does not look like mine. No worries! if you got the same result, then you are good to go.</p>

<p>Now let’s jump right in into the exercises.</p>

<h3>Ex 1: How to import pandas and check the version?</h3>

<p>Q: As a warm up, we will import pandas and print it’s version</p>

<h4>Solution</h4>

<div class="language-python highlighter-rouge"><div class="highlight"><pre class="highlight"><code><span class="kn">import</span> <span class="nn">pandas</span> <span class="k">as</span> <span class="n">pd</span> 
</code></pre></div></div>

<div class="language-python highlighter-rouge"><div class="highlight"><pre class="highlight"><code><span class="n">pd</span><span class="p">.</span><span class="n">__version__</span>
</code></pre></div></div>

<div class="language-plaintext highlighter-rouge"><div class="highlight"><pre class="highlight"><code>'0.23.4'
</code></pre></div></div>

<p>We import pandas as pd which is the common way to refer to pandas and use the dot notation to print its version.</p>

<h3>Ex 2: How to create a series from a list, numpy array and dict?</h3>

<p>Q: Create a pandas series from each of the items below: a list, numpy and a dictionary and print the first 5 elements.</p>

<div class="language-python highlighter-rouge"><div class="highlight"><pre class="highlight"><code><span class="kn">import</span> <span class="nn">numpy</span> <span class="k">as</span> <span class="n">np</span>
<span class="n">mylist</span> <span class="o">=</span> <span class="nb">list</span><span class="p">(</span><span class="s">'abcedfghijklmnopqrstuvwxyz'</span><span class="p">)</span>
<span class="n">myarr</span> <span class="o">=</span> <span class="n">np</span><span class="p">.</span><span class="n">arange</span><span class="p">(</span><span class="mi">26</span><span class="p">)</span>
<span class="n">mydict</span> <span class="o">=</span> <span class="nb">dict</span><span class="p">(</span><span class="nb">zip</span><span class="p">(</span><span class="n">mylist</span><span class="p">,</span> <span class="n">myarr</span><span class="p">))</span>
</code></pre></div></div>

<h4>Desired output</h4>

<div class="language-python highlighter-rouge"><div class="highlight"><pre class="highlight"><code><span class="c1"># List
# 0    a
# 1    b
# 2    c
# 3    e
# 4    d
# dtype: object
#
# Array
# 0    0
# 1    1
# 2    2
# 3    3
# 4    4
# dtype: int64
#
# Dictionary
# a    0
# b    1
# c    2
# e    3
# d    4
# dtype: int64
</span></code></pre></div></div>

<h4>Solution</h4>

<div class="language-python highlighter-rouge"><div class="highlight"><pre class="highlight"><code><span class="n">pd</span><span class="p">.</span><span class="n">Series</span><span class="p">(</span><span class="n">mylist</span><span class="p">).</span><span class="n">head</span><span class="p">()</span>
</code></pre></div></div>

<div class="language-plaintext highlighter-rouge"><div class="highlight"><pre class="highlight"><code>0    a
1    b
2    c
3    e
4    d
dtype: object
</code></pre></div></div>

<div class="language-python highlighter-rouge"><div class="highlight"><pre class="highlight"><code><span class="n">pd</span><span class="p">.</span><span class="n">Series</span><span class="p">(</span><span class="n">myarr</span><span class="p">).</span><span class="n">head</span><span class="p">()</span>
</code></pre></div></div>

<div class="language-plaintext highlighter-rouge"><div class="highlight"><pre class="highlight"><code>0    0
1    1
2    2
3    3
4    4
dtype: int64
</code></pre></div></div>

<div class="language-python highlighter-rouge"><div class="highlight"><pre class="highlight"><code><span class="n">pd</span><span class="p">.</span><span class="n">Series</span><span class="p">(</span><span class="n">mydict</span><span class="p">).</span><span class="n">head</span><span class="p">()</span>
</code></pre></div></div>

<div class="language-plaintext highlighter-rouge"><div class="highlight"><pre class="highlight"><code>a    0
b    1
c    2
e    3
d    4
dtype: int64
</code></pre></div></div>

<p>Let’s first explain what is a series in pandas, as I said at the beginning of this post, pandas is a tool for data manipulation and most of the data is in form of tables and tables are comprised of columns. In pandas, the data are represented in a dataframe comprised of columns and rows and the basic data structure of a dataframe is a series comprised of one column and an index column.</p>

<p>Coming back to our exercise, we are casting(changing the datatype) the list, array and the dictionary into a Series comprised of only one column of data and another column of indexes by using the Series method and print only the first 5 elements.</p>

<h3>Ex 3: How to convert the index of a series into a column of a dataframe?</h3>

<p>Q: Convert the series ser into a dataframe with its index as another column on the dataframe.</p>

<div class="language-python highlighter-rouge"><div class="highlight"><pre class="highlight"><code><span class="n">mylist</span> <span class="o">=</span> <span class="nb">list</span><span class="p">(</span><span class="s">'abcedfghijklmnopqrstuvwxyz'</span><span class="p">)</span>
<span class="n">myarr</span> <span class="o">=</span> <span class="n">np</span><span class="p">.</span><span class="n">arange</span><span class="p">(</span><span class="mi">26</span><span class="p">)</span>
<span class="n">mydict</span> <span class="o">=</span> <span class="nb">dict</span><span class="p">(</span><span class="nb">zip</span><span class="p">(</span><span class="n">mylist</span><span class="p">,</span> <span class="n">myarr</span><span class="p">))</span>
<span class="n">ser</span> <span class="o">=</span> <span class="n">pd</span><span class="p">.</span><span class="n">Series</span><span class="p">(</span><span class="n">mydict</span><span class="p">)</span>
</code></pre></div></div>

<h4>Desired output</h4>

<p><img src="/blog/assets/post_cont_image/pandas_ex3.png" alt="ex_3_image" /></p>

<h4>Solution</h4>

<div class="language-python highlighter-rouge"><div class="highlight"><pre class="highlight"><code><span class="n">ser</span><span class="p">.</span><span class="n">to_frame</span><span class="p">().</span><span class="n">reset_index</span><span class="p">().</span><span class="n">head</span><span class="p">()</span>
</code></pre></div></div>

<div>
<style scoped="">
    .dataframe tbody tr th:only-of-type {
        vertical-align: middle;
    }

    .dataframe tbody tr th {
        vertical-align: top;
    }

    .dataframe thead th {
        text-align: right;
    }
</style>
<table border="1" class="dataframe">
  <thead>
    <tr style="text-align: right;">
      <th></th>
      <th>index</th>
      <th>0</th>
    </tr>
  </thead>
  <tbody>
    <tr>
      <th>0</th>
      <td>a</td>
      <td>0</td>
    </tr>
    <tr>
      <th>1</th>
      <td>b</td>
      <td>1</td>
    </tr>
    <tr>
      <th>2</th>
      <td>c</td>
      <td>2</td>
    </tr>
    <tr>
      <th>3</th>
      <td>e</td>
      <td>3</td>
    </tr>
    <tr>
      <th>4</th>
      <td>d</td>
      <td>4</td>
    </tr>
  </tbody>
</table>
</div>

<p>To convert a series into a dataframe, we use the to_frame method and to change the ser’s index to number, we use the reset_index. We finally print the first 5 elements in the dataframe.</p>

<h3>Ex 4: How to combine many series to form a dataframe?</h3>

<p>Q: Combine ser1 and ser2 to form a dataframe.</p>

<div class="language-python highlighter-rouge"><div class="highlight"><pre class="highlight"><code><span class="kn">import</span> <span class="nn">numpy</span> <span class="k">as</span> <span class="n">np</span>
<span class="n">ser1</span> <span class="o">=</span> <span class="n">pd</span><span class="p">.</span><span class="n">Series</span><span class="p">(</span><span class="nb">list</span><span class="p">(</span><span class="s">'abcedfghijklmnopqrstuvwxyz'</span><span class="p">),</span><span class="n">name</span><span class="o">=</span><span class="s">"ser1"</span><span class="p">)</span>
<span class="n">ser2</span> <span class="o">=</span> <span class="n">pd</span><span class="p">.</span><span class="n">Series</span><span class="p">(</span><span class="n">np</span><span class="p">.</span><span class="n">arange</span><span class="p">(</span><span class="mi">26</span><span class="p">),</span><span class="n">name</span><span class="o">=</span><span class="s">"ser2"</span><span class="p">)</span>
</code></pre></div></div>

<h4>Desired output</h4>

<p><img src="/blog/assets/post_cont_image/pandas_ex4.png" alt="ex_4_image" /></p>

<h4>Solution</h4>

<h4>1st Method</h4>

<div class="language-python highlighter-rouge"><div class="highlight"><pre class="highlight"><code><span class="n">pd</span><span class="p">.</span><span class="n">concat</span><span class="p">([</span><span class="n">ser1</span><span class="p">,</span><span class="n">ser2</span><span class="p">],</span><span class="n">axis</span><span class="o">=</span><span class="mi">1</span><span class="p">).</span><span class="n">head</span><span class="p">()</span>
</code></pre></div></div>

<div>
<style scoped="">
    .dataframe tbody tr th:only-of-type {
        vertical-align: middle;
    }

    .dataframe tbody tr th {
        vertical-align: top;
    }

    .dataframe thead th {
        text-align: right;
    }
</style>
<table border="1" class="dataframe">
  <thead>
    <tr style="text-align: right;">
      <th></th>
      <th>ser1</th>
      <th>ser2</th>
    </tr>
  </thead>
  <tbody>
    <tr>
      <th>0</th>
      <td>a</td>
      <td>0</td>
    </tr>
    <tr>
      <th>1</th>
      <td>b</td>
      <td>1</td>
    </tr>
    <tr>
      <th>2</th>
      <td>c</td>
      <td>2</td>
    </tr>
    <tr>
      <th>3</th>
      <td>e</td>
      <td>3</td>
    </tr>
    <tr>
      <th>4</th>
      <td>d</td>
      <td>4</td>
    </tr>
  </tbody>
</table>
</div>

<p>We can concatenate the two series into on a Dataframe using the concat method and set the axis equal to 1 to concatenate column-wise. We finally print the first 5 elements.</p>

<h4>2nd Method</h4>

<div class="language-python highlighter-rouge"><div class="highlight"><pre class="highlight"><code><span class="n">pd</span><span class="p">.</span><span class="n">DataFrame</span><span class="p">({</span><span class="s">"ser1"</span><span class="p">:</span><span class="n">ser1</span><span class="p">,</span><span class="s">"ser2"</span><span class="p">:</span><span class="n">ser2</span><span class="p">}).</span><span class="n">head</span><span class="p">()</span>
</code></pre></div></div>

<div>
<style scoped="">
    .dataframe tbody tr th:only-of-type {
        vertical-align: middle;
    }

    .dataframe tbody tr th {
        vertical-align: top;
    }

    .dataframe thead th {
        text-align: right;
    }
</style>
<table border="1" class="dataframe">
  <thead>
    <tr style="text-align: right;">
      <th></th>
      <th>ser1</th>
      <th>ser2</th>
    </tr>
  </thead>
  <tbody>
    <tr>
      <th>0</th>
      <td>a</td>
      <td>0</td>
    </tr>
    <tr>
      <th>1</th>
      <td>b</td>
      <td>1</td>
    </tr>
    <tr>
      <th>2</th>
      <td>c</td>
      <td>2</td>
    </tr>
    <tr>
      <th>3</th>
      <td>e</td>
      <td>3</td>
    </tr>
    <tr>
      <th>4</th>
      <td>d</td>
      <td>4</td>
    </tr>
  </tbody>
</table>
</div>

<p>An alternative way to solve this issue, would be to use DataFrame method and passed in a dictionary where the keys are the column’s names and the value are the series and then print the first 5 elements.</p>

<h3>Ex 5: How to assign name to the series’ index?</h3>

<p>Q: Give a name to the series ser calling it ‘alphabets’.</p>

<div class="language-python highlighter-rouge"><div class="highlight"><pre class="highlight"><code><span class="n">ser</span> <span class="o">=</span> <span class="n">pd</span><span class="p">.</span><span class="n">Series</span><span class="p">(</span><span class="nb">list</span><span class="p">(</span><span class="s">'abcedfghijklmnopqrstuvwxyz'</span><span class="p">))</span>
</code></pre></div></div>

<h4>Desired output</h4>

<div class="language-python highlighter-rouge"><div class="highlight"><pre class="highlight"><code><span class="c1"># a    0
# b    1
# c    2
# e    3
# d    4
# Name: alphabets, dtype: int64
</span></code></pre></div></div>

<h4>Solution</h4>

<div class="language-python highlighter-rouge"><div class="highlight"><pre class="highlight"><code><span class="n">ser</span><span class="p">.</span><span class="n">name</span> <span class="o">=</span> <span class="s">"alphabets"</span>
</code></pre></div></div>

<div class="language-python highlighter-rouge"><div class="highlight"><pre class="highlight"><code><span class="n">ser</span><span class="p">.</span><span class="n">head</span><span class="p">()</span>
</code></pre></div></div>

<div class="language-plaintext highlighter-rouge"><div class="highlight"><pre class="highlight"><code>a    0
b    1
c    2
e    3
d    4
Name: alphabets, dtype: int64
</code></pre></div></div>

<p>We give a name to a series through the dot operator by calling the name method and assign it the actual name, in this example “alphabets”</p>

<h3>Ex 6: How to get the items of series A not present in series B?</h3>

<p>Q: From ser1 remove items present in ser2.</p>

<div class="language-python highlighter-rouge"><div class="highlight"><pre class="highlight"><code><span class="n">ser1</span> <span class="o">=</span> <span class="n">pd</span><span class="p">.</span><span class="n">Series</span><span class="p">([</span><span class="mi">1</span><span class="p">,</span> <span class="mi">2</span><span class="p">,</span> <span class="mi">3</span><span class="p">,</span> <span class="mi">4</span><span class="p">,</span> <span class="mi">5</span><span class="p">])</span>
<span class="n">ser2</span> <span class="o">=</span> <span class="n">pd</span><span class="p">.</span><span class="n">Series</span><span class="p">([</span><span class="mi">4</span><span class="p">,</span> <span class="mi">5</span><span class="p">,</span> <span class="mi">6</span><span class="p">,</span> <span class="mi">7</span><span class="p">,</span> <span class="mi">8</span><span class="p">])</span>
</code></pre></div></div>

<h4>Desired output</h4>

<div class="language-python highlighter-rouge"><div class="highlight"><pre class="highlight"><code><span class="c1"># 0    1
# 1    2
# 2    3
# dtype: int64
</span></code></pre></div></div>

<h4>Solution</h4>

<div class="language-python highlighter-rouge"><div class="highlight"><pre class="highlight"><code><span class="n">ser1</span><span class="p">[</span><span class="o">~</span><span class="n">ser1</span><span class="p">.</span><span class="n">isin</span><span class="p">(</span><span class="n">ser2</span><span class="p">)]</span>
</code></pre></div></div>

<div class="language-plaintext highlighter-rouge"><div class="highlight"><pre class="highlight"><code>0    1
1    2
2    3
dtype: int64
</code></pre></div></div>

<p>We first find which elements present both in ser1 and ser2 using isin method, a boolean DataFrame is returned where True is the position of elements present in ser1 and ser2 and where False is the position of elements only in ser1.</p>

<p>So to get the elements unique to ser1, we use the ~ to reverse the boolean DataFrame and then use indexing to get the actual value.</p>

<h3>Ex 7: How to get the items not common to both series A and series B?</h3>

<p>Q: Get all items of ser1 and ser2 not common to both.</p>

<div class="language-python highlighter-rouge"><div class="highlight"><pre class="highlight"><code><span class="n">ser1</span> <span class="o">=</span> <span class="n">pd</span><span class="p">.</span><span class="n">Series</span><span class="p">([</span><span class="mi">1</span><span class="p">,</span> <span class="mi">2</span><span class="p">,</span> <span class="mi">3</span><span class="p">,</span> <span class="mi">4</span><span class="p">,</span> <span class="mi">5</span><span class="p">])</span>
<span class="n">ser2</span> <span class="o">=</span> <span class="n">pd</span><span class="p">.</span><span class="n">Series</span><span class="p">([</span><span class="mi">4</span><span class="p">,</span> <span class="mi">5</span><span class="p">,</span> <span class="mi">6</span><span class="p">,</span> <span class="mi">7</span><span class="p">,</span> <span class="mi">8</span><span class="p">])</span>
</code></pre></div></div>

<h4>Desired output</h4>

<div class="language-python highlighter-rouge"><div class="highlight"><pre class="highlight"><code><span class="c1"># 0    1
# 1    2
# 2    3
# 3    6
# 4    7
# 5    8
# dtype: int64
</span></code></pre></div></div>

<h3>Solution</h3>

<h4>1st Method</h4>

<div class="language-python highlighter-rouge"><div class="highlight"><pre class="highlight"><code><span class="n">unique_ser1</span> <span class="o">=</span> <span class="n">ser1</span><span class="p">[</span><span class="o">~</span><span class="n">ser1</span><span class="p">.</span><span class="n">isin</span><span class="p">(</span><span class="n">ser2</span><span class="p">)]</span>
<span class="n">unique_ser2</span> <span class="o">=</span> <span class="n">ser2</span><span class="p">[</span><span class="o">~</span><span class="n">ser2</span><span class="p">.</span><span class="n">isin</span><span class="p">(</span><span class="n">ser1</span><span class="p">)]</span>
</code></pre></div></div>

<p>We get elements that are not common in both series just like we did in exercise 6</p>

<div class="language-python highlighter-rouge"><div class="highlight"><pre class="highlight"><code><span class="n">unique_ser1</span>
</code></pre></div></div>

<div class="language-plaintext highlighter-rouge"><div class="highlight"><pre class="highlight"><code>0    1
1    2
2    3
dtype: int64
</code></pre></div></div>

<div class="language-python highlighter-rouge"><div class="highlight"><pre class="highlight"><code><span class="n">unique_ser2</span>
</code></pre></div></div>

<div class="language-plaintext highlighter-rouge"><div class="highlight"><pre class="highlight"><code>2    6
3    7
4    8
dtype: int64
</code></pre></div></div>

<div class="language-python highlighter-rouge"><div class="highlight"><pre class="highlight"><code><span class="n">uniques</span> <span class="o">=</span> <span class="n">pd</span><span class="p">.</span><span class="n">Series</span><span class="p">(</span><span class="n">np</span><span class="p">.</span><span class="n">union1d</span><span class="p">(</span><span class="n">unique_ser1</span><span class="p">,</span><span class="n">unique_ser2</span><span class="p">))</span>
</code></pre></div></div>

<div class="language-python highlighter-rouge"><div class="highlight"><pre class="highlight"><code><span class="n">uniques</span>
</code></pre></div></div>

<div class="language-plaintext highlighter-rouge"><div class="highlight"><pre class="highlight"><code>0    1
1    2
2    3
3    6
4    7
5    8
dtype: int64
</code></pre></div></div>

<p>At last, we merge the two series unique_ser1 and unique_ser2 using the NumPy function union1d and cast the array into a series.</p>

<h4>2nd Method</h4>

<div class="language-python highlighter-rouge"><div class="highlight"><pre class="highlight"><code><span class="n">series_u</span> <span class="o">=</span> <span class="n">pd</span><span class="p">.</span><span class="n">Series</span><span class="p">(</span><span class="n">np</span><span class="p">.</span><span class="n">union1d</span><span class="p">(</span><span class="n">ser1</span><span class="p">,</span><span class="n">ser2</span><span class="p">))</span>
<span class="n">series_i</span> <span class="o">=</span> <span class="n">pd</span><span class="p">.</span><span class="n">Series</span><span class="p">(</span><span class="n">np</span><span class="p">.</span><span class="n">intersect1d</span><span class="p">(</span><span class="n">ser1</span><span class="p">,</span><span class="n">ser2</span><span class="p">))</span>
</code></pre></div></div>

<div class="language-python highlighter-rouge"><div class="highlight"><pre class="highlight"><code><span class="n">series_u</span><span class="p">[</span><span class="o">~</span><span class="n">series_u</span><span class="p">.</span><span class="n">isin</span><span class="p">(</span><span class="n">series_i</span><span class="p">)]</span>
</code></pre></div></div>

<div class="language-plaintext highlighter-rouge"><div class="highlight"><pre class="highlight"><code>0    1
1    2
2    3
5    6
6    7
7    8
dtype: int64
</code></pre></div></div>

<p>The second method is quite similar to the first one, the difference is that this time we get first the intersection and the union separately using NumPy function and then use indexing on the union series to get the unique element in the two series just like we did in exercise 6.</p>

<h3>Ex 8: How to get the minimum, 25th percentile, median, 75th, and max of a numeric series?</h3>

<p>Q: Compute the minimum, 25th percentile, median, 75th, and maximum of ser.</p>

<div class="language-python highlighter-rouge"><div class="highlight"><pre class="highlight"><code><span class="n">ser</span> <span class="o">=</span> <span class="n">pd</span><span class="p">.</span><span class="n">Series</span><span class="p">(</span><span class="n">np</span><span class="p">.</span><span class="n">random</span><span class="p">.</span><span class="n">normal</span><span class="p">(</span><span class="mi">10</span><span class="p">,</span> <span class="mi">5</span><span class="p">,</span> <span class="mi">25</span><span class="p">))</span>
</code></pre></div></div>

<h4>Desired output</h4>

<div class="language-python highlighter-rouge"><div class="highlight"><pre class="highlight"><code><span class="c1">#the minimum is :1.63, the 25th percentile is: 7.27, the median is: 10.21, the 75th percentile is: 15.29 and the maximum is: 22.64
</span></code></pre></div></div>

<h4>Solution</h4>

<h4>1st Method</h4>

<div class="language-python highlighter-rouge"><div class="highlight"><pre class="highlight"><code><span class="k">print</span><span class="p">(</span><span class="s">"the minimum is :{0:.2f}, the 25th percentile is: {1:.2f}, the median is: {2:.2f}, the 75th percentile is: {3:.2f} and the maximum is: {4:.2f}"</span><span class="p">.</span><span class="nb">format</span><span class="p">(</span><span class="n">ser</span><span class="p">.</span><span class="nb">min</span><span class="p">(),</span><span class="n">ser</span><span class="p">.</span><span class="n">quantile</span><span class="p">(</span><span class="n">q</span><span class="o">=</span><span class="mf">0.25</span><span class="p">),</span><span class="n">ser</span><span class="p">.</span><span class="n">median</span><span class="p">(),</span><span class="n">ser</span><span class="p">.</span><span class="n">quantile</span><span class="p">(</span><span class="n">q</span><span class="o">=</span><span class="mf">0.75</span><span class="p">),</span><span class="n">ser</span><span class="p">.</span><span class="nb">max</span><span class="p">()))</span>
</code></pre></div></div>

<div class="language-plaintext highlighter-rouge"><div class="highlight"><pre class="highlight"><code>the minimum is :1.63, the 25th percentile is: 7.27, the median is: 10.21, the 75th percentile is: 15.29 and the maximum is: 22.64
</code></pre></div></div>

<h4>2nd Method</h4>

<div class="language-python highlighter-rouge"><div class="highlight"><pre class="highlight"><code><span class="k">print</span><span class="p">(</span><span class="s">"the minimum is :{0:.2f}, the 25th percentile is: {1:.2f}, the median is: {2:.2f}, the 75th percentile is: {3:.2f} and the maximum is: {4:.2f}"</span><span class="p">.</span><span class="nb">format</span><span class="p">(</span><span class="n">ser</span><span class="p">.</span><span class="n">quantile</span><span class="p">(</span><span class="n">q</span><span class="o">=</span><span class="mi">0</span><span class="p">),</span><span class="n">ser</span><span class="p">.</span><span class="n">quantile</span><span class="p">(</span><span class="n">q</span><span class="o">=</span><span class="mf">0.25</span><span class="p">),</span><span class="n">ser</span><span class="p">.</span><span class="n">quantile</span><span class="p">(</span><span class="n">q</span><span class="o">=</span><span class="mf">0.50</span><span class="p">),</span><span class="n">ser</span><span class="p">.</span><span class="n">quantile</span><span class="p">(</span><span class="n">q</span><span class="o">=</span><span class="mf">0.75</span><span class="p">),</span><span class="n">ser</span><span class="p">.</span><span class="n">quantile</span><span class="p">(</span><span class="n">q</span><span class="o">=</span><span class="mi">1</span><span class="p">)))</span>
</code></pre></div></div>

<div class="language-plaintext highlighter-rouge"><div class="highlight"><pre class="highlight"><code>the minimum is :1.63, the 25th percentile is: 7.27, the median is: 10.21, the 75th percentile is: 15.29 and the maximum is: 22.64
</code></pre></div></div>

<p>We can get the different percentile using the quantile method and pass as argument q the percentile, so for the 0th percentile (which is the min) q will be 0, for the 25th percentile q will be 0.25, for the 50th percentile (which is the median) q will be 0.5, for the 75th percentile q will be 0.75 and last for the 100th percentile (which is the max) q will be 1.</p>

<p>The min, median and max have their functions too in case you don’t wanna use the quantile function.</p>

<h3>Ex 9: How to get frequency counts of unique items of a series?</h3>

<p>Q: Calculate the frequency counts of each unique value ser.</p>

<div class="language-python highlighter-rouge"><div class="highlight"><pre class="highlight"><code><span class="n">ser</span> <span class="o">=</span> <span class="n">pd</span><span class="p">.</span><span class="n">Series</span><span class="p">(</span><span class="n">np</span><span class="p">.</span><span class="n">take</span><span class="p">(</span><span class="nb">list</span><span class="p">(</span><span class="s">'abcdefgh'</span><span class="p">),</span> <span class="n">np</span><span class="p">.</span><span class="n">random</span><span class="p">.</span><span class="n">randint</span><span class="p">(</span><span class="mi">8</span><span class="p">,</span> <span class="n">size</span><span class="o">=</span><span class="mi">30</span><span class="p">)))</span>
</code></pre></div></div>

<h4>Desired output</h4>

<div class="language-python highlighter-rouge"><div class="highlight"><pre class="highlight"><code><span class="c1"># b    7
# a    5
# e    5
# f    4
# d    4
# c    2
# h    2
# g    1
# dtype: int64
</span></code></pre></div></div>

<h4>Solution</h4>

<div class="language-python highlighter-rouge"><div class="highlight"><pre class="highlight"><code><span class="n">ser</span><span class="p">.</span><span class="n">value_counts</span><span class="p">()</span>
</code></pre></div></div>

<div class="language-plaintext highlighter-rouge"><div class="highlight"><pre class="highlight"><code>b    7
a    5
e    5
f    4
d    4
c    2
h    2
g    1
dtype: int64
</code></pre></div></div>

<p>To get the count of how many times a value is repeated, we use the value_count function on the series.</p>

<h3>Ex 10: How to keep only the top 2 most frequent values as it is and replace everything else as ‘Other’?</h3>

<p>Q: From ser, keep the top 2 most frequent items as it is and replace everything else as ‘Other’.</p>

<div class="language-python highlighter-rouge"><div class="highlight"><pre class="highlight"><code><span class="n">np</span><span class="p">.</span><span class="n">random</span><span class="p">.</span><span class="n">RandomState</span><span class="p">(</span><span class="mi">100</span><span class="p">)</span>
<span class="n">ser</span> <span class="o">=</span> <span class="n">pd</span><span class="p">.</span><span class="n">Series</span><span class="p">(</span><span class="n">np</span><span class="p">.</span><span class="n">random</span><span class="p">.</span><span class="n">randint</span><span class="p">(</span><span class="mi">1</span><span class="p">,</span> <span class="mi">5</span><span class="p">,</span> <span class="p">[</span><span class="mi">12</span><span class="p">]))</span>
</code></pre></div></div>

<h4>Desired output</h4>

<div class="language-python highlighter-rouge"><div class="highlight"><pre class="highlight"><code><span class="c1"># 0         2
# 1         4
# 2         2
# 3     other
# 4         2
# 5         4
# 6     other
# 7         2
# 8         2
# 9     other
# 10    other
# 11        4
# dtype: object
</span></code></pre></div></div>

<h4>Solution</h4>

<div class="language-python highlighter-rouge"><div class="highlight"><pre class="highlight"><code><span class="n">most_freq_el</span> <span class="o">=</span> <span class="n">ser</span><span class="p">.</span><span class="n">value_counts</span><span class="p">()[:</span><span class="mi">2</span><span class="p">].</span><span class="n">index</span>
</code></pre></div></div>

<div class="language-python highlighter-rouge"><div class="highlight"><pre class="highlight"><code><span class="n">ser</span><span class="p">[</span><span class="o">~</span><span class="n">ser</span><span class="p">.</span><span class="n">isin</span><span class="p">(</span><span class="n">most_freq_el</span><span class="p">)]</span> <span class="o">=</span> <span class="s">"other"</span>
</code></pre></div></div>

<div class="language-python highlighter-rouge"><div class="highlight"><pre class="highlight"><code><span class="n">ser</span>
</code></pre></div></div>

<div class="language-plaintext highlighter-rouge"><div class="highlight"><pre class="highlight"><code>0         2
1         4
2         2
3     other
4         2
5         4
6     other
7         2
8         2
9     other
10    other
11        4
dtype: object
</code></pre></div></div>

<p>We get first the two most frequent element in ser using the value_count, which will return the series with the values as indexes and the count of how many times those values are repeated. We only need the value so we called the index function.</p>

<p>We use isin and indexing to select all the values other than the two most frequent value and assign it to the string “other”.</p>

<h3>Ex 11: How to bin a numeric series to 10 groups of equal size?</h3>

<p>Q: Bin the series ser into 10 equal deciles and replace the values with the bin name.</p>

<div class="language-python highlighter-rouge"><div class="highlight"><pre class="highlight"><code><span class="n">ser</span> <span class="o">=</span> <span class="n">pd</span><span class="p">.</span><span class="n">Series</span><span class="p">(</span><span class="n">np</span><span class="p">.</span><span class="n">random</span><span class="p">.</span><span class="n">random</span><span class="p">(</span><span class="mi">20</span><span class="p">))</span>
</code></pre></div></div>

<h4>Desired output</h4>

<div class="language-python highlighter-rouge"><div class="highlight"><pre class="highlight"><code><span class="c1"># 0    4th
# 1    9th
# 2    6th
# 3    2nd
# 4    2nd
# dtype: category
# Categories (10, object): [1st &lt; 2nd &lt; 3rd &lt; 4th ... 7th &lt; 8th &lt; 9th &lt; 10th]
</span></code></pre></div></div>

<h4>Solution</h4>

<div class="language-python highlighter-rouge"><div class="highlight"><pre class="highlight"><code><span class="n">pd</span><span class="p">.</span><span class="n">cut</span><span class="p">(</span><span class="n">ser</span><span class="p">,</span><span class="n">bins</span><span class="o">=</span><span class="mi">10</span><span class="p">,</span><span class="n">labels</span><span class="o">=</span><span class="p">[</span><span class="s">"1st"</span><span class="p">,</span><span class="s">"2nd"</span><span class="p">,</span><span class="s">"3rd"</span><span class="p">,</span><span class="s">"4th"</span><span class="p">,</span><span class="s">"5th"</span><span class="p">,</span><span class="s">"6th"</span><span class="p">,</span><span class="s">"7th"</span><span class="p">,</span><span class="s">"8th"</span><span class="p">,</span><span class="s">"9th"</span><span class="p">,</span><span class="s">"10th"</span><span class="p">]).</span><span class="n">head</span><span class="p">()</span>
</code></pre></div></div>

<div class="language-plaintext highlighter-rouge"><div class="highlight"><pre class="highlight"><code>0    4th
1    9th
2    6th
3    2nd
4    2nd
dtype: category
Categories (10, object): [1st &lt; 2nd &lt; 3rd &lt; 4th ... 7th &lt; 8th &lt; 9th &lt; 10th]
</code></pre></div></div>

<p>To get the segment of the series, we use the cut function pass the series, specify how many bins or basket we want to use and give them a label.</p>

<h3>Ex 12: How to convert a numpy array to a dataframe of given shape? (L1)</h3>

<p>Q: Reshape the series ser into a dataframe with 7 rows and 5 columns</p>

<div class="language-python highlighter-rouge"><div class="highlight"><pre class="highlight"><code><span class="n">ser</span> <span class="o">=</span> <span class="n">pd</span><span class="p">.</span><span class="n">Series</span><span class="p">(</span><span class="n">np</span><span class="p">.</span><span class="n">random</span><span class="p">.</span><span class="n">randint</span><span class="p">(</span><span class="mi">1</span><span class="p">,</span> <span class="mi">10</span><span class="p">,</span> <span class="mi">35</span><span class="p">))</span>
</code></pre></div></div>

<h4>Desired output</h4>

<div class="language-python highlighter-rouge"><div class="highlight"><pre class="highlight"><code><span class="c1"># array([[9, 1, 4, 8, 3],
#        [2, 3, 9, 7, 2],
#        [2, 9, 6, 6, 5],
#        [2, 2, 7, 8, 5],
#        [7, 3, 3, 9, 6],
#        [2, 3, 4, 3, 3],
#        [1, 6, 6, 3, 1]])
</span></code></pre></div></div>

<h4>Solution</h4>

<h4>1st Method</h4>

<div class="language-python highlighter-rouge"><div class="highlight"><pre class="highlight"><code><span class="n">ser</span><span class="p">.</span><span class="n">values</span><span class="p">.</span><span class="n">reshape</span><span class="p">((</span><span class="mi">7</span><span class="p">,</span><span class="mi">5</span><span class="p">))</span>
</code></pre></div></div>

<div class="language-plaintext highlighter-rouge"><div class="highlight"><pre class="highlight"><code>array([[9, 1, 4, 8, 3],
       [2, 3, 9, 7, 2],
       [2, 9, 6, 6, 5],
       [2, 2, 7, 8, 5],
       [7, 3, 3, 9, 6],
       [2, 3, 4, 3, 3],
       [1, 6, 6, 3, 1]])
</code></pre></div></div>

<p>To reshape the ser, we call the reshape function on the series and pass a tuple with the first element the number of rows and the second element the number of columns.</p>

<h4>2nd Method</h4>

<div class="language-python highlighter-rouge"><div class="highlight"><pre class="highlight"><code><span class="n">ser</span><span class="p">.</span><span class="n">values</span><span class="p">.</span><span class="n">reshape</span><span class="p">((</span><span class="o">-</span><span class="mi">1</span><span class="p">,</span><span class="mi">5</span><span class="p">))</span>
</code></pre></div></div>

<div class="language-plaintext highlighter-rouge"><div class="highlight"><pre class="highlight"><code>array([[9, 1, 4, 8, 3],
       [2, 3, 9, 7, 2],
       [2, 9, 6, 6, 5],
       [2, 2, 7, 8, 5],
       [7, 3, 3, 9, 6],
       [2, 3, 4, 3, 3],
       [1, 6, 6, 3, 1]])
</code></pre></div></div>

<div class="language-python highlighter-rouge"><div class="highlight"><pre class="highlight"><code><span class="n">ser</span><span class="p">.</span><span class="n">values</span><span class="p">.</span><span class="n">reshape</span><span class="p">((</span><span class="mi">7</span><span class="p">,</span><span class="o">-</span><span class="mi">1</span><span class="p">))</span>
</code></pre></div></div>

<div class="language-plaintext highlighter-rouge"><div class="highlight"><pre class="highlight"><code>array([[9, 1, 4, 8, 3],
       [2, 3, 9, 7, 2],
       [2, 9, 6, 6, 5],
       [2, 2, 7, 8, 5],
       [7, 3, 3, 9, 6],
       [2, 3, 4, 3, 3],
       [1, 6, 6, 3, 1]])
</code></pre></div></div>

<p>The other way to go about this would be to populate the tuple with only one element (row or column) and let Pandas figure out the other element to be used by placing -1 in the tuple.</p>

<h3>Ex 13: How to find the positions of numbers that are multiples of 3 from a series?</h3>

<p>Q: Find the positions of numbers that are multiples of 3 from ser.</p>

<div class="language-python highlighter-rouge"><div class="highlight"><pre class="highlight"><code><span class="n">ser</span> <span class="o">=</span> <span class="n">pd</span><span class="p">.</span><span class="n">Series</span><span class="p">(</span><span class="n">np</span><span class="p">.</span><span class="n">random</span><span class="p">.</span><span class="n">randint</span><span class="p">(</span><span class="mi">1</span><span class="p">,</span> <span class="mi">10</span><span class="p">,</span> <span class="mi">7</span><span class="p">))</span>
</code></pre></div></div>

<h4>Desired output</h4>

<div class="language-python highlighter-rouge"><div class="highlight"><pre class="highlight"><code><span class="c1"># 0    1
# 1    6
# dtype: int64
</span></code></pre></div></div>

<h4>Solution</h4>

<h4>1st Method</h4>

<div class="language-python highlighter-rouge"><div class="highlight"><pre class="highlight"><code><span class="n">pd</span><span class="p">.</span><span class="n">Series</span><span class="p">(</span><span class="n">ser</span><span class="p">[</span><span class="n">ser</span><span class="o">%</span><span class="mi">3</span> <span class="o">==</span> <span class="mi">0</span><span class="p">].</span><span class="n">index</span><span class="p">)</span>
</code></pre></div></div>

<div class="language-plaintext highlighter-rouge"><div class="highlight"><pre class="highlight"><code>0    1
1    6
dtype: int64
</code></pre></div></div>

<p>We index the series and pass in the condition to return all the values that have a remainder of 0 when divided by 3. It means that those values are multiples of 3.</p>

<p>We then extract the indexes(positions) and cast them to a series.</p>

<h4>2nd Method</h4>

<div class="language-python highlighter-rouge"><div class="highlight"><pre class="highlight"><code><span class="n">pd</span><span class="p">.</span><span class="n">Series</span><span class="p">(</span><span class="n">np</span><span class="p">.</span><span class="n">argwhere</span><span class="p">(</span><span class="n">ser</span><span class="o">%</span><span class="mi">3</span><span class="o">==</span><span class="mi">0</span><span class="p">).</span><span class="n">flatten</span><span class="p">())</span>
</code></pre></div></div>

<div class="language-plaintext highlighter-rouge"><div class="highlight"><pre class="highlight"><code>0    1
1    6
dtype: int64
</code></pre></div></div>

<p>Alternately, we could use NumPy function argwhere which returns all the values that have a remainder of 0 when divided by 3. We then flatten the array and cast it to a series.</p>

<h3>Ex 14: How to extract items at given positions from a series</h3>

<p>Q: From ser, extract the items at positions in list pos.</p>

<div class="language-python highlighter-rouge"><div class="highlight"><pre class="highlight"><code><span class="n">ser</span> <span class="o">=</span> <span class="n">pd</span><span class="p">.</span><span class="n">Series</span><span class="p">(</span><span class="nb">list</span><span class="p">(</span><span class="s">'abcdefghijklmnopqrstuvwxyz'</span><span class="p">))</span>
<span class="n">pos</span> <span class="o">=</span> <span class="p">[</span><span class="mi">0</span><span class="p">,</span> <span class="mi">4</span><span class="p">,</span> <span class="mi">8</span><span class="p">,</span> <span class="mi">14</span><span class="p">,</span> <span class="mi">20</span><span class="p">]</span>
</code></pre></div></div>

<h4>Desired output</h4>

<div class="language-python highlighter-rouge"><div class="highlight"><pre class="highlight"><code><span class="c1"># 0     a
# 4     e
# 8     i
# 14    o
# 20    u
# dtype: object
</span></code></pre></div></div>

<h4>Solution</h4>

<h4>1st Method</h4>

<div class="language-python highlighter-rouge"><div class="highlight"><pre class="highlight"><code><span class="n">pd</span><span class="p">.</span><span class="n">Series</span><span class="p">(</span><span class="n">ser</span><span class="p">.</span><span class="n">iloc</span><span class="p">[</span><span class="n">pos</span><span class="p">])</span>
</code></pre></div></div>

<div class="language-plaintext highlighter-rouge"><div class="highlight"><pre class="highlight"><code>0     a
4     e
8     i
14    o
20    u
dtype: object
</code></pre></div></div>

<p>We use the iloc function to get the element at a specific index and cast to a series.</p>

<h4>2nd Method</h4>

<div class="language-python highlighter-rouge"><div class="highlight"><pre class="highlight"><code><span class="n">ser</span><span class="p">.</span><span class="n">take</span><span class="p">(</span><span class="n">pos</span><span class="p">)</span>
</code></pre></div></div>

<div class="language-plaintext highlighter-rouge"><div class="highlight"><pre class="highlight"><code>0     a
4     e
8     i
14    o
20    u
dtype: object
</code></pre></div></div>

<p>Alternatively, we can use the take function to achieve the same result.</p>

<h3>Ex 15: How to stack two series vertically?</h3>

<p>Q: Stack ser1 and ser2 vertically to form a dataframe.</p>

<div class="language-python highlighter-rouge"><div class="highlight"><pre class="highlight"><code><span class="n">ser1</span> <span class="o">=</span> <span class="n">pd</span><span class="p">.</span><span class="n">Series</span><span class="p">(</span><span class="nb">range</span><span class="p">(</span><span class="mi">5</span><span class="p">))</span>
<span class="n">ser2</span> <span class="o">=</span> <span class="n">pd</span><span class="p">.</span><span class="n">Series</span><span class="p">(</span><span class="nb">list</span><span class="p">(</span><span class="s">'abcde'</span><span class="p">))</span>
</code></pre></div></div>

<h4>Desired output</h4>

<div class="language-python highlighter-rouge"><div class="highlight"><pre class="highlight"><code><span class="c1"># 0    0
# 1    1
# 2    2
# 3    3
# 4    4
# 0    a
# 1    b
# 2    c
# 3    d
# 4    e
# dtype: object
</span></code></pre></div></div>

<h4>Solution</h4>

<div class="language-python highlighter-rouge"><div class="highlight"><pre class="highlight"><code><span class="n">pd</span><span class="p">.</span><span class="n">concat</span><span class="p">((</span><span class="n">ser1</span><span class="p">,</span><span class="n">ser2</span><span class="p">),</span><span class="n">axis</span><span class="o">=</span><span class="mi">0</span><span class="p">)</span>
</code></pre></div></div>

<div class="language-plaintext highlighter-rouge"><div class="highlight"><pre class="highlight"><code>0    0
1    1
2    2
3    3
4    4
0    a
1    b
2    c
3    d
4    e
dtype: object
</code></pre></div></div>

<p>To combine the two series into one, we use the concat function and pass in as a tuple the two series and set the axis to 0 to tell Pandas that we want to concatenate row-wise(vertically).</p>

<h3>Ex 16: How to get the positions of items of series A in another series B?</h3>

<p>Q: Get the positions of items of ser2 in ser1 as a list.</p>

<div class="language-python highlighter-rouge"><div class="highlight"><pre class="highlight"><code><span class="n">ser1</span> <span class="o">=</span> <span class="n">pd</span><span class="p">.</span><span class="n">Series</span><span class="p">([</span><span class="mi">10</span><span class="p">,</span> <span class="mi">9</span><span class="p">,</span> <span class="mi">6</span><span class="p">,</span> <span class="mi">5</span><span class="p">,</span> <span class="mi">3</span><span class="p">,</span> <span class="mi">1</span><span class="p">,</span> <span class="mi">12</span><span class="p">,</span> <span class="mi">8</span><span class="p">,</span> <span class="mi">13</span><span class="p">])</span>
<span class="n">ser2</span> <span class="o">=</span> <span class="n">pd</span><span class="p">.</span><span class="n">Series</span><span class="p">([</span><span class="mi">1</span><span class="p">,</span> <span class="mi">3</span><span class="p">,</span> <span class="mi">10</span><span class="p">,</span> <span class="mi">13</span><span class="p">])</span>
</code></pre></div></div>

<h4>Desired output</h4>

<div class="language-python highlighter-rouge"><div class="highlight"><pre class="highlight"><code><span class="c1"># [0, 4, 5, 8]
</span></code></pre></div></div>

<h4>Solution</h4>

<div class="language-python highlighter-rouge"><div class="highlight"><pre class="highlight"><code><span class="nb">list</span><span class="p">(</span><span class="n">ser1</span><span class="p">[</span><span class="n">ser1</span><span class="p">.</span><span class="n">isin</span><span class="p">(</span><span class="n">ser2</span><span class="p">)].</span><span class="n">index</span><span class="p">)</span>
</code></pre></div></div>

<div class="language-plaintext highlighter-rouge"><div class="highlight"><pre class="highlight"><code>[0, 4, 5, 8]
</code></pre></div></div>

<p>We use the isin function on ser1 in ser2. We get back the indexes that correspond to the positions and cast them to a list.</p>

<h3>Ex 17: How to compute the mean squared error on series A and predicted series B?</h3>

<p>Q: Compute the mean squared error of truth and pred series.</p>

<div class="language-python highlighter-rouge"><div class="highlight"><pre class="highlight"><code><span class="n">truth</span> <span class="o">=</span> <span class="n">pd</span><span class="p">.</span><span class="n">Series</span><span class="p">(</span><span class="nb">range</span><span class="p">(</span><span class="mi">10</span><span class="p">))</span>
<span class="n">pred</span> <span class="o">=</span> <span class="n">pd</span><span class="p">.</span><span class="n">Series</span><span class="p">(</span><span class="nb">range</span><span class="p">(</span><span class="mi">10</span><span class="p">))</span> <span class="o">+</span> <span class="n">np</span><span class="p">.</span><span class="n">random</span><span class="p">.</span><span class="n">random</span><span class="p">(</span><span class="mi">10</span><span class="p">)</span>
</code></pre></div></div>

<h4>Desired output</h4>

<div class="language-python highlighter-rouge"><div class="highlight"><pre class="highlight"><code><span class="c1"># Since we are generating random variable, your result will be different
</span>
<span class="c1">#0.34688071383011976
</span></code></pre></div></div>

<h4>Solution</h4>

<div class="language-python highlighter-rouge"><div class="highlight"><pre class="highlight"><code><span class="n">np</span><span class="p">.</span><span class="n">square</span><span class="p">(</span><span class="n">np</span><span class="p">.</span><span class="n">subtract</span><span class="p">(</span><span class="n">truth</span><span class="p">,</span><span class="n">pred</span><span class="p">)).</span><span class="n">mean</span><span class="p">()</span>
</code></pre></div></div>

<div class="language-plaintext highlighter-rouge"><div class="highlight"><pre class="highlight"><code>0.34688071383011976
</code></pre></div></div>

<div class="language-python highlighter-rouge"><div class="highlight"><pre class="highlight"><code><span class="n">np</span><span class="p">.</span><span class="n">mean</span><span class="p">((</span><span class="n">truth</span><span class="o">-</span><span class="n">pred</span><span class="p">)</span><span class="o">**</span><span class="mi">2</span><span class="p">)</span>
</code></pre></div></div>

<div class="language-plaintext highlighter-rouge"><div class="highlight"><pre class="highlight"><code>0.34688071383011976
</code></pre></div></div>

<p>The two notation is the same, to find the mean squared error we use its formula which pretty much translates into the code above.</p>

<p>Visit the <a href="https://en.wikipedia.org/wiki/Mean_squared_error" target="_blank">Wikipedia page</a> to learn more about the mean squared error.</p>

<h3>Ex 18: How to convert the first character of each element in a series to uppercase?</h3>

<p>Q: Change the first character of each word to upper case in each word of ser.</p>

<div class="language-python highlighter-rouge"><div class="highlight"><pre class="highlight"><code><span class="n">ser</span> <span class="o">=</span> <span class="n">pd</span><span class="p">.</span><span class="n">Series</span><span class="p">([</span><span class="s">'how'</span><span class="p">,</span> <span class="s">'to'</span><span class="p">,</span> <span class="s">'kick'</span><span class="p">,</span> <span class="s">'ass?'</span><span class="p">])</span>
</code></pre></div></div>

<h4>Desired output</h4>

<div class="language-python highlighter-rouge"><div class="highlight"><pre class="highlight"><code><span class="c1"># 0     How
# 1      To
# 2    Kick
# 3    Ass?
# dtype: object
</span></code></pre></div></div>

<h4>Solution</h4>

<h4>1st Method: The pythonic way (least recommended)</h4>

<div class="language-python highlighter-rouge"><div class="highlight"><pre class="highlight"><code><span class="k">def</span> <span class="nf">uppercase</span><span class="p">(</span><span class="n">the_series</span><span class="p">):</span>
    <span class="n">capitalized_ser</span> <span class="o">=</span> <span class="p">[]</span>
    <span class="k">for</span> <span class="n">word</span> <span class="ow">in</span> <span class="n">the_series</span><span class="p">:</span>
        <span class="n">capitalized_ser</span><span class="p">.</span><span class="n">append</span><span class="p">(</span><span class="n">word</span><span class="p">.</span><span class="n">capitalize</span><span class="p">())</span>
    <span class="k">print</span><span class="p">(</span><span class="n">pd</span><span class="p">.</span><span class="n">Series</span><span class="p">(</span><span class="n">capitalized_ser</span><span class="p">))</span>
    
<span class="n">uppercase</span><span class="p">(</span><span class="n">ser</span><span class="p">)</span>
</code></pre></div></div>

<div class="language-plaintext highlighter-rouge"><div class="highlight"><pre class="highlight"><code>0     How
1      To
2    Kick
3    Ass?
dtype: object
</code></pre></div></div>

<p>One way to solve this would be to use the vanilla Python code. We build a function that takes the series and create a new list to store the words that we will be capitalizing. We loop through the series and capitalize each word and place it in the list. We finally cast the list to a series and print it.</p>

<p>The reason why this is the least recommended of the bunch, it is because to achieve the result by writing five lines of code which make our code verbose.</p>

<h4>2nd Method: Using May (recommended)</h4>

<div class="language-python highlighter-rouge"><div class="highlight"><pre class="highlight"><code><span class="n">ser</span><span class="p">.</span><span class="nb">map</span><span class="p">(</span><span class="k">lambda</span> <span class="n">x</span><span class="p">:</span> <span class="n">x</span><span class="p">.</span><span class="n">title</span><span class="p">())</span>
</code></pre></div></div>

<div class="language-plaintext highlighter-rouge"><div class="highlight"><pre class="highlight"><code>0     How
1      To
2    Kick
3    Ass?
dtype: object
</code></pre></div></div>

<p>Ban! a much simpler method in one line of code, is to use map with lambda expression. we use the title function to capitalize each first letter of each word. We can use the capitalize function instead of the title function.</p>

<h4>3rd Method: Using Pandas built-in function (most recommended)</h4>

<div class="language-python highlighter-rouge"><div class="highlight"><pre class="highlight"><code><span class="n">ser</span><span class="p">.</span><span class="nb">str</span><span class="p">.</span><span class="n">capitalize</span><span class="p">()</span>
</code></pre></div></div>

<div class="language-plaintext highlighter-rouge"><div class="highlight"><pre class="highlight"><code>0     How
1      To
2    Kick
3    Ass?
dtype: object
</code></pre></div></div>

<p>We can call the pandas’s capitalize function write away series’string.</p>

<h3>Ex 19: How to calculate the number of characters in each word in a series?</h3>

<p>Q: Get the number of characters in each word in a series</p>

<div class="language-python highlighter-rouge"><div class="highlight"><pre class="highlight"><code><span class="n">ser</span> <span class="o">=</span> <span class="n">pd</span><span class="p">.</span><span class="n">Series</span><span class="p">([</span><span class="s">'how'</span><span class="p">,</span> <span class="s">'to'</span><span class="p">,</span> <span class="s">'kick'</span><span class="p">,</span> <span class="s">'ass?'</span><span class="p">])</span>
</code></pre></div></div>

<h4>Desired output</h4>

<div class="language-python highlighter-rouge"><div class="highlight"><pre class="highlight"><code><span class="c1"># 0    3
# 1    2
# 2    4
# 3    4
# dtype: int64
</span></code></pre></div></div>

<h4>Solution</h4>

<h4>1st Method</h4>

<div class="language-python highlighter-rouge"><div class="highlight"><pre class="highlight"><code><span class="n">ser</span><span class="p">.</span><span class="nb">str</span><span class="p">.</span><span class="n">count</span><span class="p">(</span><span class="n">pat</span><span class="o">=</span><span class="s">"."</span><span class="p">)</span>
</code></pre></div></div>

<div class="language-plaintext highlighter-rouge"><div class="highlight"><pre class="highlight"><code>0    3
1    2
2    4
3    4
dtype: int64
</code></pre></div></div>

<p>We can get the length of each word in the series by calling the string and the count function. We pass in the count function the pattern “.” (it is a regular expression) to select any character in the word.</p>

<h4>2nd Method</h4>

<div class="language-python highlighter-rouge"><div class="highlight"><pre class="highlight"><code><span class="n">ser</span><span class="p">.</span><span class="nb">map</span><span class="p">(</span><span class="k">lambda</span> <span class="n">x</span><span class="p">:</span> <span class="nb">len</span><span class="p">(</span><span class="n">x</span><span class="p">))</span>
</code></pre></div></div>

<div class="language-plaintext highlighter-rouge"><div class="highlight"><pre class="highlight"><code>0    3
1    2
2    4
3    4
dtype: int64
</code></pre></div></div>

<p>We can also use map with lambda expression by getting the length of each word by using len(x).</p>

<h3>Ex 20: How to compute the difference of differences between consecutive numbers of a series?</h3>

<p>Q: Find the difference of differences between the consecutive numbers of ser.</p>

<div class="language-python highlighter-rouge"><div class="highlight"><pre class="highlight"><code><span class="n">ser</span> <span class="o">=</span> <span class="n">pd</span><span class="p">.</span><span class="n">Series</span><span class="p">([</span><span class="mi">1</span><span class="p">,</span> <span class="mi">3</span><span class="p">,</span> <span class="mi">6</span><span class="p">,</span> <span class="mi">10</span><span class="p">,</span> <span class="mi">15</span><span class="p">,</span> <span class="mi">21</span><span class="p">,</span> <span class="mi">27</span><span class="p">,</span> <span class="mi">35</span><span class="p">])</span>
</code></pre></div></div>

<h4>Desired output</h4>

<div class="language-python highlighter-rouge"><div class="highlight"><pre class="highlight"><code><span class="c1"># [nan, 2.0, 3.0, 4.0, 5.0, 6.0, 6.0, 8.0]
# [nan, nan, 1.0, 1.0, 1.0, 1.0, 0.0, 2.0]
</span></code></pre></div></div>

<h4>Solution</h4>

<div class="language-python highlighter-rouge"><div class="highlight"><pre class="highlight"><code><span class="n">ser</span><span class="p">.</span><span class="n">diff</span><span class="p">().</span><span class="n">tolist</span><span class="p">()</span>
</code></pre></div></div>

<div class="language-plaintext highlighter-rouge"><div class="highlight"><pre class="highlight"><code>[nan, 2.0, 3.0, 4.0, 5.0, 6.0, 6.0, 8.0]
</code></pre></div></div>

<div class="language-python highlighter-rouge"><div class="highlight"><pre class="highlight"><code><span class="n">ser</span><span class="p">.</span><span class="n">diff</span><span class="p">().</span><span class="n">diff</span><span class="p">().</span><span class="n">tolist</span><span class="p">()</span>
</code></pre></div></div>

<div class="language-plaintext highlighter-rouge"><div class="highlight"><pre class="highlight"><code>[nan, nan, 1.0, 1.0, 1.0, 1.0, 0.0, 2.0]
</code></pre></div></div>

<p>To calculate the difference of a series element compared with another element in the series, we use the diff function.</p>

<p>The first line of code we use it on the element in the series and the second time we use it on the difference list. So we have performed a difference of difference on that series.</p>

<h3>Ex 21: How to convert a series of date-strings to a timeseries?</h3>

<p>Q: How to convert a series of date-strings to a timeseries?</p>

<div class="language-python highlighter-rouge"><div class="highlight"><pre class="highlight"><code><span class="n">ser</span> <span class="o">=</span> <span class="n">pd</span><span class="p">.</span><span class="n">Series</span><span class="p">([</span><span class="s">'01 Jan 2010'</span><span class="p">,</span> <span class="s">'02-02-2011'</span><span class="p">,</span> <span class="s">'20120303'</span><span class="p">,</span> <span class="s">'2013/04/04'</span><span class="p">,</span> <span class="s">'2014-05-05'</span><span class="p">,</span> <span class="s">'2015-06-06T12:20'</span><span class="p">])</span>
</code></pre></div></div>

<h4>Desired output</h4>

<div class="language-python highlighter-rouge"><div class="highlight"><pre class="highlight"><code><span class="c1"># 0   2010-01-01 00:00:00
# 1   2011-02-02 00:00:00
# 2   2012-03-03 00:00:00
# 3   2013-04-04 00:00:00
# 4   2014-05-05 00:00:00
# 5   2015-06-06 12:20:00
# dtype: datetime64[ns]
</span></code></pre></div></div>

<h4>Solution</h4>

<div class="language-python highlighter-rouge"><div class="highlight"><pre class="highlight"><code><span class="n">pd</span><span class="p">.</span><span class="n">to_datetime</span><span class="p">(</span><span class="n">ser</span><span class="p">)</span>
</code></pre></div></div>

<div class="language-plaintext highlighter-rouge"><div class="highlight"><pre class="highlight"><code>0   2010-01-01 00:00:00
1   2011-02-02 00:00:00
2   2012-03-03 00:00:00
3   2013-04-04 00:00:00
4   2014-05-05 00:00:00
5   2015-06-06 12:20:00
dtype: datetime64[ns]
</code></pre></div></div>

<p>To get the timeseries of the corresponding series, we use the function to_datetime and pass the series as the argument.</p>

<h3>Ex 22: How to get the day of the month, week number, day of year and day of the week from a series of date strings?</h3>

<p>Q: Get the day of the month, week number, day of year and day of the week from ser.</p>

<div class="language-python highlighter-rouge"><div class="highlight"><pre class="highlight"><code><span class="n">ser</span> <span class="o">=</span> <span class="n">pd</span><span class="p">.</span><span class="n">Series</span><span class="p">([</span><span class="s">'01 Jan 2010'</span><span class="p">,</span> <span class="s">'02-02-2011'</span><span class="p">,</span> <span class="s">'20120303'</span><span class="p">,</span> <span class="s">'2013/04/04'</span><span class="p">,</span> <span class="s">'2014-05-05'</span><span class="p">,</span> <span class="s">'2015-06-06T12:20'</span><span class="p">])</span>
</code></pre></div></div>

<h4>Desired output</h4>

<div class="language-python highlighter-rouge"><div class="highlight"><pre class="highlight"><code><span class="c1"># Date:  [1, 2, 3, 4, 5, 6]
# Week number:  [53, 5, 9, 14, 19, 23]
# Day num of year:  [1, 33, 63, 94, 125, 157]
# Day of week:  ['Friday', 'Wednesday', 'Saturday', 'Thursday', 'Monday', 'Saturday']
</span></code></pre></div></div>

<h4>Solution</h4>

<div class="language-python highlighter-rouge"><div class="highlight"><pre class="highlight"><code><span class="n">ser_dt</span> <span class="o">=</span> <span class="n">pd</span><span class="p">.</span><span class="n">to_datetime</span><span class="p">(</span><span class="n">ser</span><span class="p">)</span>
</code></pre></div></div>

<div class="language-python highlighter-rouge"><div class="highlight"><pre class="highlight"><code><span class="n">date</span> <span class="o">=</span> <span class="nb">list</span><span class="p">(</span><span class="n">ser_dt</span><span class="p">.</span><span class="n">dt</span><span class="p">.</span><span class="n">day</span><span class="p">)</span>
</code></pre></div></div>

<div class="language-python highlighter-rouge"><div class="highlight"><pre class="highlight"><code><span class="n">week_number</span> <span class="o">=</span> <span class="nb">list</span><span class="p">(</span><span class="n">ser_dt</span><span class="p">.</span><span class="n">dt</span><span class="p">.</span><span class="n">week</span><span class="p">)</span>
</code></pre></div></div>

<div class="language-python highlighter-rouge"><div class="highlight"><pre class="highlight"><code><span class="n">day_num</span> <span class="o">=</span> <span class="nb">list</span><span class="p">(</span><span class="n">ser_dt</span><span class="p">.</span><span class="n">dt</span><span class="p">.</span><span class="n">dayofyear</span><span class="p">)</span>
</code></pre></div></div>

<div class="language-python highlighter-rouge"><div class="highlight"><pre class="highlight"><code><span class="n">day_name</span> <span class="o">=</span> <span class="nb">list</span><span class="p">(</span><span class="n">ser_dt</span><span class="p">.</span><span class="n">dt</span><span class="p">.</span><span class="n">day_name</span><span class="p">())</span>
</code></pre></div></div>

<div class="language-python highlighter-rouge"><div class="highlight"><pre class="highlight"><code><span class="k">print</span><span class="p">(</span><span class="s">"Date: {}</span><span class="se">\n</span><span class="s">Week number: {}</span><span class="se">\n</span><span class="s">Day num of year: {}</span><span class="se">\n</span><span class="s">Day of week: {}"</span><span class="p">.</span><span class="nb">format</span><span class="p">(</span><span class="n">date</span><span class="p">,</span><span class="n">week_number</span><span class="p">,</span><span class="n">day_num</span><span class="p">,</span><span class="n">day_name</span><span class="p">))</span>
</code></pre></div></div>

<div class="language-plaintext highlighter-rouge"><div class="highlight"><pre class="highlight"><code>Date: [1, 2, 3, 4, 5, 6]
Week number: [53, 5, 9, 14, 19, 23]
Day num of year: [1, 33, 63, 94, 125, 157]
Day of week: ['Friday', 'Wednesday', 'Saturday', 'Thursday', 'Monday', 'Saturday']
</code></pre></div></div>

<p>We start by changing the series into a datetime, then access its dt function to get the dates, week number, day of the year and day name. Finally, we cast them to a list and print those variables.</p>

<h3>Ex 23: How to convert year-month string to dates corresponding to the 4th day of the month?</h3>

<p>Q: Change ser to dates that start with 4th of the respective months.</p>

<div class="language-python highlighter-rouge"><div class="highlight"><pre class="highlight"><code><span class="n">ser</span> <span class="o">=</span> <span class="n">pd</span><span class="p">.</span><span class="n">Series</span><span class="p">([</span><span class="s">'Jan 2010'</span><span class="p">,</span> <span class="s">'Feb 2011'</span><span class="p">,</span> <span class="s">'Mar 2012'</span><span class="p">])</span>
</code></pre></div></div>

<h4>Desired output</h4>

<div class="language-python highlighter-rouge"><div class="highlight"><pre class="highlight"><code><span class="c1"># 0   2010-01-04
# 1   2011-02-04
# 2   2012-03-04
# dtype: datetime64[ns]
</span></code></pre></div></div>

<h4>Solution</h4>

<div class="language-python highlighter-rouge"><div class="highlight"><pre class="highlight"><code><span class="kn">from</span> <span class="nn">dateutil.parser</span> <span class="kn">import</span> <span class="n">parse</span>

<span class="n">ser</span><span class="p">.</span><span class="nb">map</span><span class="p">(</span><span class="k">lambda</span> <span class="n">d</span><span class="p">:</span> <span class="n">parse</span><span class="p">(</span><span class="n">d</span><span class="o">+</span><span class="s">" 4"</span><span class="p">))</span>
</code></pre></div></div>

<div class="language-plaintext highlighter-rouge"><div class="highlight"><pre class="highlight"><code>0   2010-01-04
1   2011-02-04
2   2012-03-04
dtype: datetime64[ns]
</code></pre></div></div>

<p>For this exercise, we will need to install the parse function from the dateutile package to parse most known formats representing a date and/or time.</p>

<p>Then we will use the map function with a lambda expression, and parse the series concatenated with the date we want to add to the series.</p>

<h3>Ex 24: How to filter words that contain atleast 2 vowels from a series?</h3>

<p>Q: From ser, extract words that contain atleast 2 vowels.</p>

<div class="language-python highlighter-rouge"><div class="highlight"><pre class="highlight"><code><span class="n">ser</span> <span class="o">=</span> <span class="n">pd</span><span class="p">.</span><span class="n">Series</span><span class="p">([</span><span class="s">'Apple'</span><span class="p">,</span> <span class="s">'Orange'</span><span class="p">,</span> <span class="s">'Plan'</span><span class="p">,</span> <span class="s">'Python'</span><span class="p">,</span> <span class="s">'Money'</span><span class="p">])</span>
</code></pre></div></div>

<h4>Desired output</h4>

<div class="language-python highlighter-rouge"><div class="highlight"><pre class="highlight"><code><span class="c1"># 0     Apple
# 1    Orange
# 4     Money
# dtype: object
</span></code></pre></div></div>

<h4>Solution</h4>

<div class="language-python highlighter-rouge"><div class="highlight"><pre class="highlight"><code><span class="n">vowel_count</span> <span class="o">=</span> <span class="n">ser</span><span class="p">.</span><span class="nb">str</span><span class="p">.</span><span class="n">count</span><span class="p">(</span><span class="n">pat</span><span class="o">=</span><span class="s">"(?i)[aeiou]"</span><span class="p">)</span>
<span class="n">vowel_count</span>
</code></pre></div></div>

<div class="language-plaintext highlighter-rouge"><div class="highlight"><pre class="highlight"><code>0    2
1    3
2    1
3    1
4    2
dtype: int64
</code></pre></div></div>

<div class="language-python highlighter-rouge"><div class="highlight"><pre class="highlight"><code><span class="n">ser</span><span class="p">[</span><span class="n">np</span><span class="p">.</span><span class="n">argwhere</span><span class="p">(</span><span class="n">vowel_count</span><span class="p">.</span><span class="n">values</span> <span class="o">&gt;=</span> <span class="mi">2</span><span class="p">).</span><span class="n">flatten</span><span class="p">()]</span>
</code></pre></div></div>

<div class="language-plaintext highlighter-rouge"><div class="highlight"><pre class="highlight"><code>0     Apple
1    Orange
4     Money
dtype: object
</code></pre></div></div>

<p>We use the count function to get the count of vowels in each word by using a regular expression pattern. We get back a series with positions and the corresponding count of vowel at those positions.</p>

<p>We use the Numpy argwhere function to return the indexes where the condition in the paratheses is satisfied. In this example, the condition is a vowel count greater than 2. we get back 3 arrays of the indexes where the word has 2 or more vowels and then we flatten the 3 arrays into one 1D array. We use indexing to get back the words from the original series.</p>

<h3>Ex 25: How to filter valid emails from a series?</h3>

<p>Extract the valid emails from the series emails. The regex pattern for valid emails is provided as reference.</p>

<div class="language-python highlighter-rouge"><div class="highlight"><pre class="highlight"><code><span class="n">emails</span> <span class="o">=</span> <span class="n">pd</span><span class="p">.</span><span class="n">Series</span><span class="p">([</span><span class="s">'buying books at amazom.com'</span><span class="p">,</span> <span class="s">'rameses@egypt.com'</span><span class="p">,</span> <span class="s">'matt@t.co'</span><span class="p">,</span> <span class="s">'narendra@modi.com'</span><span class="p">,</span><span class="s">'dad@comp'</span><span class="p">])</span>
<span class="n">pattern</span> <span class="o">=</span><span class="s">'[A-Za-z0-9._%+-]+@[A-Za-z0-9.-]+</span><span class="se">\\</span><span class="s">.[A-Za-z]{2,4}'</span>
</code></pre></div></div>

<h4>Desired output</h4>

<div class="language-python highlighter-rouge"><div class="highlight"><pre class="highlight"><code><span class="c1"># 1    rameses@egypt.com
# 2            matt@t.co
# 3    narendra@modi.com
# dtype: object
</span></code></pre></div></div>

<h4>Solution</h4>

<div class="language-python highlighter-rouge"><div class="highlight"><pre class="highlight"><code><span class="n">emails</span><span class="p">[</span><span class="n">emails</span><span class="p">.</span><span class="nb">str</span><span class="p">.</span><span class="n">match</span><span class="p">(</span><span class="n">pat</span><span class="o">=</span><span class="n">pattern</span><span class="p">)]</span>
</code></pre></div></div>

<div class="language-plaintext highlighter-rouge"><div class="highlight"><pre class="highlight"><code>1    rameses@egypt.com
2            matt@t.co
3    narendra@modi.com
dtype: object
</code></pre></div></div>

<p>This exercise is similar to the previous one. This time, we use the match function to get back all the words that match the pattern and use the indexing to get those words.</p>

<h3>Conclusion</h3>

<p>Pandas is such a wonderful library that is why it is my favorite libraries. It is easy to grasp, and there are a plethora of resources online if you are stuck. Do not forget to visit StackOverflow too, and ask questions. There is always someone ready to help.</p>

<p>This post is exclusively focused on series, the primary data structure of Pandas. In the next two posts, we will explore the dataframe which is the most popular Pandas data structure. Find the jupyter notebook version of this post on my GitHub profile <a href="https://github.com/semasuka/blog/blob/gh-pages/ipynb/Pandas%20exercise%20Part%201.ipynb" target="_blank">here.</a></p>

<p>Thank you again for doing these exercises with me. I hope you have learned one or two things. If you like this post, please subscribe to stay updated with new posts, and if you have a thought or a question, I would love to hear it by commenting below. Cheers, and keep learning!</p>]]></content><author><name>Stern Semasuka</name></author><category term="python" /><category term="exercises" /><category term="pandas" /><summary type="html"><![CDATA[Welcome back, folks! In this series of 3 blog post, we will be discussing pandas which one of my favorite python libraries. We will go through 74 exercises to solidify your skills with pandas and as usual, I will explain the WHY behind every single exercise.]]></summary><media:thumbnail xmlns:media="http://search.yahoo.com/mrss/" url="https://semasuka.github.io/blog/blog/assets/post_images/pandas.jpg" /><media:content medium="image" url="https://semasuka.github.io/blog/blog/assets/post_images/pandas.jpg" xmlns:media="http://search.yahoo.com/mrss/" /></entry><entry><title type="html">NumPy Exercises Part 3</title><link href="https://semasuka.github.io/blog/blog/2020/09/19/numpy-exercises-part-3.html" rel="alternate" type="text/html" title="NumPy Exercises Part 3" /><published>2020-09-19T00:00:00+00:00</published><updated>2020-09-19T00:00:00+00:00</updated><id>https://semasuka.github.io/blog/blog/2020/09/19/numpy-exercises-part-3</id><content type="html" xml:base="https://semasuka.github.io/blog/blog/2020/09/19/numpy-exercises-part-3.html"><![CDATA[<p>Welcome back, folks! This post is the last in the series of NumPy exercises. In this post, we will see intermediate and advanced level exercises. Remember, the more you practice, the more you will understand NumPy and will use it with ease in your ML projects.<!-- more --></p>

<p>Let’s now start by importing the NumPy as usual.</p>

<div class="language-python highlighter-rouge"><div class="highlight"><pre class="highlight"><code><span class="kn">import</span> <span class="nn">numpy</span> <span class="k">as</span> <span class="n">np</span>
</code></pre></div></div>

<h3>Ex 41: Convert a numeric to a categorical (text) array</h3>

<p>Q: Bin the petal length (3rd) column of the_data_2d to form a text array, such that if petal length is:</p>

<ul>
  <li>Less than 3 we change it to ‘small.’</li>
  <li>between 3 and 5 we change it to ‘medium.’</li>
  <li>Greater or equal to 5 we change it to ‘large.’</li>
</ul>

<p>Finally, print the first four values.</p>

<div class="language-python highlighter-rouge"><div class="highlight"><pre class="highlight"><code><span class="n">url</span> <span class="o">=</span> <span class="s">'https://archive.ics.uci.edu/ml/machine-learning-databases/iris/iris.data'</span>
<span class="n">the_data_2d</span> <span class="o">=</span> <span class="n">np</span><span class="p">.</span><span class="n">genfromtxt</span><span class="p">(</span><span class="n">url</span><span class="p">,</span> <span class="n">delimiter</span><span class="o">=</span><span class="s">','</span><span class="p">,</span> <span class="n">dtype</span><span class="o">=</span><span class="s">'object'</span><span class="p">)</span>
</code></pre></div></div>

<h4>Desire output</h4>

<div class="language-python highlighter-rouge"><div class="highlight"><pre class="highlight"><code><span class="c1">#['small', 'small', 'small', 'small']
</span></code></pre></div></div>

<h4>Solution</h4>

<div class="language-python highlighter-rouge"><div class="highlight"><pre class="highlight"><code><span class="n">petal_length_bins</span> <span class="o">=</span> <span class="n">np</span><span class="p">.</span><span class="n">digitize</span><span class="p">(</span><span class="n">the_data_2d</span><span class="p">[:,</span><span class="mi">2</span><span class="p">].</span><span class="n">astype</span><span class="p">(</span><span class="s">"float"</span><span class="p">),[</span><span class="mi">0</span><span class="p">,</span><span class="mi">3</span><span class="p">,</span><span class="mi">5</span><span class="p">,</span><span class="mi">10</span><span class="p">])</span>
<span class="n">label_map</span> <span class="o">=</span> <span class="p">{</span><span class="mi">1</span><span class="p">:</span> <span class="s">'small'</span><span class="p">,</span> <span class="mi">2</span><span class="p">:</span> <span class="s">'medium'</span><span class="p">,</span> <span class="mi">3</span><span class="p">:</span> <span class="s">'large'</span><span class="p">,</span> <span class="mi">4</span><span class="p">:</span> <span class="n">np</span><span class="p">.</span><span class="n">nan</span><span class="p">}</span>
<span class="n">petal_lenght_categorized</span> <span class="o">=</span> <span class="p">[</span><span class="n">label_map</span><span class="p">[</span><span class="n">x</span><span class="p">]</span> <span class="k">for</span> <span class="n">x</span> <span class="ow">in</span> <span class="n">petal_lenght_bins</span><span class="p">]</span>
</code></pre></div></div>

<div class="language-python highlighter-rouge"><div class="highlight"><pre class="highlight"><code><span class="n">petal_lenght_categorized</span><span class="p">[:</span><span class="mi">5</span><span class="p">]</span>
</code></pre></div></div>

<div class="language-plaintext highlighter-rouge"><div class="highlight"><pre class="highlight"><code>['small', 'small', 'small', 'small']
</code></pre></div></div>

<p>We start by selecting the sepal length column and cast it to float. Then we use the digitize method to create bins or, as I like to call them, containers for the corresponding range of values in the column.</p>

<p>So we are assigning the following values:</p>
<ul>
  <li>1 to all the elements between 0 and 3 exclusive (3 not included) in the petal length column.</li>
  <li>2 to all the elements between 3 and 5 exclusive.</li>
  <li>Finally, 3 to all the elements between 5 to 10 exclusive.</li>
</ul>

<p>We then now create a dictionary with key-value pairs where each key has a corresponding text. 1 is associated with small, 2 is associated with medium, and finally, 3 is associated with large.</p>

<p>Finally, we use list comprehension to go through the bins and replace each instance of 1, 2, and 3 by the corresponding text and print the first four elements.</p>

<h3>Ex 42: Create a new column from existing columns of a NumPy array</h3>

<p>Q: Create a new column for volume in the_data_2d, where volume is (pi x petal length(3rd column) x sepal length(1st column)^2)/3</p>

<div class="language-python highlighter-rouge"><div class="highlight"><pre class="highlight"><code><span class="n">url</span> <span class="o">=</span> <span class="s">'https://archive.ics.uci.edu/ml/machine-learning-databases/iris/iris.data'</span>
<span class="n">the_data_2d</span> <span class="o">=</span> <span class="n">np</span><span class="p">.</span><span class="n">loadtxt</span><span class="p">(</span><span class="n">url</span><span class="p">,</span> <span class="n">delimiter</span><span class="o">=</span><span class="s">','</span><span class="p">,</span> <span class="n">dtype</span><span class="o">=</span><span class="nb">float</span><span class="p">,</span><span class="n">usecols</span><span class="o">=</span><span class="p">[</span><span class="mi">0</span><span class="p">,</span><span class="mi">1</span><span class="p">,</span><span class="mi">2</span><span class="p">,</span><span class="mi">3</span><span class="p">])</span>
</code></pre></div></div>

<h4>Desire output</h4>

<div class="language-python highlighter-rouge"><div class="highlight"><pre class="highlight"><code><span class="c1"># array([[ 5.1       ,  3.5       ,  1.4       ,  0.2       , 38.13265163],
#        [ 4.9       ,  3.        ,  1.4       ,  0.2       , 35.20049849],
#        [ 4.7       ,  3.2       ,  1.3       ,  0.2       , 30.07237208],
#        [ 4.6       ,  3.1       ,  1.5       ,  0.2       , 33.23805027],
#        [ 5.        ,  3.6       ,  1.4       ,  0.2       , 36.65191429]])
</span></code></pre></div></div>

<h4>Solution</h4>

<div class="language-python highlighter-rouge"><div class="highlight"><pre class="highlight"><code><span class="n">volume</span> <span class="o">=</span> <span class="p">(</span><span class="n">np</span><span class="p">.</span><span class="n">pi</span> <span class="o">*</span> <span class="n">the_data_2d</span><span class="p">[:,</span><span class="mi">2</span><span class="p">]</span> <span class="o">*</span> <span class="nb">pow</span><span class="p">(</span><span class="n">the_data_2d</span><span class="p">[:,</span><span class="mi">0</span><span class="p">],</span><span class="mi">2</span><span class="p">))</span><span class="o">/</span><span class="mi">3</span>
</code></pre></div></div>

<div class="language-python highlighter-rouge"><div class="highlight"><pre class="highlight"><code><span class="n">volume</span>
</code></pre></div></div>

<div class="language-plaintext highlighter-rouge"><div class="highlight"><pre class="highlight"><code>array([ 38.13,  35.2 ,  30.07,  33.24,  36.65,  51.91,  31.02,  39.27,
        28.38,  37.71,  45.8 ,  38.6 ,  33.78,  21.3 ,  42.27,  51.04,
        39.7 ,  38.13,  57.84,  40.86,  51.91,  40.86,  22.16,  46.3 ,
        45.84,  41.89,  41.89,  42.47,  39.64,  37.01,  38.6 ,  45.8 ,
        42.47,  44.35,  37.71,  31.42,  41.18,  37.71,  26.36,  40.86,
        34.03,  27.57,  26.36,  41.89,  51.75,  33.78,  43.58,  31.02,
        44.12,  36.65, 241.17, 193.02, 244.3 , 126.71, 203.52, 153.11,
       195.35,  82.97, 209.83, 110.43,  91.63, 153.1 , 150.8 , 183.14,
       118.22, 206.84, 147.78, 144.43, 181.14, 128.08, 174.97, 155.86,
       203.66, 183.14, 184.44, 200.71, 232.43, 235.04, 169.65, 119.08,
       120.38, 117.21, 137.39, 192.27, 137.41, 169.65, 220.94, 182.88,
       134.64, 126.71, 139.38, 179.24, 140.91,  86.39, 137.93, 142.9 ,
       142.9 , 173.09,  81.71, 139.5 , 249.38, 179.66, 311.46, 232.75,
       256.62, 399.21, 113.14, 351.57, 272.65, 331.15, 225.64, 227.33,
       266.32, 170.12, 179.66, 227.33, 243.34, 415.99, 428.41, 188.5 ,
       284.19, 160.92, 415.99, 203.66, 267.95, 325.72, 193.22, 190.93,
       240.2 , 314.86, 349.8 , 418.28, 240.2 , 211.97, 218.21, 378.74,
       232.75, 235.91, 180.96, 269.23, 263.25, 254.27, 179.66, 285.69,
       267.95, 244.45, 207.82, 230.07, 217.37, 185.91])
</code></pre></div></div>

<p>We first get the volume by multiplying the pie constant with the third column times the power by two of the first column then finally dividing the whole by 3.</p>

<p>But there is an issue; the volume is a one-dimensional array, while the_data_2d is a two-dimensional array. It means that we can not stack them together because they are of different dimensions. We have to change the dimension of volume to a two-dimensional array.</p>

<div class="language-python highlighter-rouge"><div class="highlight"><pre class="highlight"><code><span class="n">volume</span><span class="p">.</span><span class="n">shape</span>
</code></pre></div></div>

<div class="language-plaintext highlighter-rouge"><div class="highlight"><pre class="highlight"><code>(150,)
</code></pre></div></div>

<div class="language-python highlighter-rouge"><div class="highlight"><pre class="highlight"><code><span class="n">volume</span> <span class="o">=</span> <span class="n">volume</span><span class="p">[:,</span><span class="n">np</span><span class="p">.</span><span class="n">newaxis</span><span class="p">]</span>
</code></pre></div></div>

<p>We use the newaxis method, which will increase a dimension to the next dimension. In our case, because we had a one-dimensional array, we would have a two-dimensional array.</p>

<div class="language-python highlighter-rouge"><div class="highlight"><pre class="highlight"><code><span class="n">volume</span><span class="p">.</span><span class="n">shape</span>
</code></pre></div></div>

<div class="language-plaintext highlighter-rouge"><div class="highlight"><pre class="highlight"><code>(150, 1)
</code></pre></div></div>

<div class="language-python highlighter-rouge"><div class="highlight"><pre class="highlight"><code><span class="n">the_data_2d</span><span class="p">.</span><span class="n">shape</span>
</code></pre></div></div>

<div class="language-plaintext highlighter-rouge"><div class="highlight"><pre class="highlight"><code>(150, 4)
</code></pre></div></div>

<p>Now we can append the volume to the the_data_2d array. There are two ways of achieving this.</p>

<h4>1st Method</h4>

<div class="language-python highlighter-rouge"><div class="highlight"><pre class="highlight"><code><span class="n">np</span><span class="p">.</span><span class="n">set_printoptions</span><span class="p">(</span><span class="n">suppress</span><span class="o">=</span><span class="bp">True</span><span class="p">)</span>
<span class="n">np</span><span class="p">.</span><span class="n">append</span><span class="p">(</span><span class="n">the_data_2d</span><span class="p">,</span><span class="n">volume</span><span class="p">,</span><span class="n">axis</span><span class="o">=</span><span class="mi">1</span><span class="p">)[:</span><span class="mi">5</span><span class="p">]</span>
</code></pre></div></div>

<div class="language-plaintext highlighter-rouge"><div class="highlight"><pre class="highlight"><code>array([[ 5.1       ,  3.5       ,  1.4       ,  0.2       , 38.13265163],
       [ 4.9       ,  3.        ,  1.4       ,  0.2       , 35.20049849],
       [ 4.7       ,  3.2       ,  1.3       ,  0.2       , 30.07237208],
       [ 4.6       ,  3.1       ,  1.5       ,  0.2       , 33.23805027],
       [ 5.        ,  3.6       ,  1.4       ,  0.2       , 36.65191429]])
</code></pre></div></div>

<p>We don’t want to print the exponential; we suppress it using the set_printoption method. We append the volume column to the_data_2d column-wise by setting axis to 1 (column-wise or horizontally) and print the first five rows.</p>

<h4>2nd Method</h4>

<div class="language-python highlighter-rouge"><div class="highlight"><pre class="highlight"><code><span class="n">np</span><span class="p">.</span><span class="n">hstack</span><span class="p">((</span><span class="n">the_data_2d</span><span class="p">,</span><span class="n">volume</span><span class="p">))[:</span><span class="mi">5</span><span class="p">]</span>
</code></pre></div></div>

<div class="language-plaintext highlighter-rouge"><div class="highlight"><pre class="highlight"><code>array([[ 5.1       ,  3.5       ,  1.4       ,  0.2       , 38.13265163],
       [ 4.9       ,  3.        ,  1.4       ,  0.2       , 35.20049849],
       [ 4.7       ,  3.2       ,  1.3       ,  0.2       , 30.07237208],
       [ 4.6       ,  3.1       ,  1.5       ,  0.2       , 33.23805027],
       [ 5.        ,  3.6       ,  1.4       ,  0.2       , 36.65191429]])
</code></pre></div></div>

<p>We can also use hstack to stack column-wise the_data_2d and volume and print the first five rows.</p>

<h3>Ex 43: Probabilistic sampling in numpy</h3>

<p>Q: Randomly sample iris’s species such that setose is twice the number of versicolor and virginica</p>

<div class="language-python highlighter-rouge"><div class="highlight"><pre class="highlight"><code><span class="n">url</span> <span class="o">=</span> <span class="s">'https://archive.ics.uci.edu/ml/machine-learning-databases/iris/iris.data'</span>
<span class="n">the_data_2d</span> <span class="o">=</span> <span class="n">np</span><span class="p">.</span><span class="n">genfromtxt</span><span class="p">(</span><span class="n">url</span><span class="p">,</span> <span class="n">delimiter</span><span class="o">=</span><span class="s">','</span><span class="p">,</span> <span class="n">dtype</span><span class="o">=</span><span class="s">'object'</span><span class="p">)</span>
</code></pre></div></div>

<h4>Desired output</h4>

<div class="language-python highlighter-rouge"><div class="highlight"><pre class="highlight"><code><span class="c1"># use np.random.seed(100)
#(array(['Iris-setosa', 'Iris-versicolor', 'Iris-virginica'], dtype='&lt;U15'), array([77, 37, 36]))
</span></code></pre></div></div>

<h4>Solution</h4>

<div class="language-python highlighter-rouge"><div class="highlight"><pre class="highlight"><code><span class="n">the_data_2d</span><span class="p">[:,</span><span class="mi">4</span><span class="p">]</span>
<span class="n">np</span><span class="p">.</span><span class="n">random</span><span class="p">.</span><span class="n">seed</span><span class="p">(</span><span class="mi">100</span><span class="p">)</span>
<span class="n">a</span> <span class="o">=</span> <span class="n">np</span><span class="p">.</span><span class="n">array</span><span class="p">([</span><span class="s">'Iris-setosa'</span><span class="p">,</span> <span class="s">'Iris-versicolor'</span><span class="p">,</span> <span class="s">'Iris-virginica'</span><span class="p">])</span>
<span class="n">species_out</span> <span class="o">=</span> <span class="n">np</span><span class="p">.</span><span class="n">random</span><span class="p">.</span><span class="n">choice</span><span class="p">(</span><span class="n">a</span><span class="p">,</span><span class="n">size</span><span class="o">=</span><span class="mi">150</span><span class="p">,</span><span class="n">p</span><span class="o">=</span><span class="p">[</span><span class="mf">0.5</span><span class="p">,</span><span class="mf">0.25</span><span class="p">,</span><span class="mf">0.25</span><span class="p">])</span>
</code></pre></div></div>

<p>We first create an array with the three types of flowers, then use this array to create a random sample with p being the probabilities associated with each entry of size 150. The first entry (Iris-Setosa) has double the probabilities than the two other entries (Iris-versicolor and Iris-virginica). That’s why we have set the first element in p to 0.5 and the rest 0.25.</p>

<div class="language-python highlighter-rouge"><div class="highlight"><pre class="highlight"><code><span class="k">print</span><span class="p">(</span><span class="n">np</span><span class="p">.</span><span class="n">unique</span><span class="p">(</span><span class="n">species_out</span><span class="p">,</span><span class="n">return_counts</span><span class="o">=</span><span class="bp">True</span><span class="p">))</span>
</code></pre></div></div>

<div class="language-plaintext highlighter-rouge"><div class="highlight"><pre class="highlight"><code>(array(['Iris-setosa', 'Iris-versicolor', 'Iris-virginica'], dtype='&lt;U15'), array([77, 37, 36]))
</code></pre></div></div>

<p>We now print out unique values from the species_out and return the count of each value.</p>

<h3>Ex 44: Get the second largest value of an column in an array when grouped by another column?</h3>

<p>Q: What is the value of the second-longest petal length of species setosa</p>

<div class="language-python highlighter-rouge"><div class="highlight"><pre class="highlight"><code><span class="n">url</span> <span class="o">=</span> <span class="s">'https://archive.ics.uci.edu/ml/machine-learning-databases/iris/iris.data'</span>
<span class="n">the_data_2d</span> <span class="o">=</span> <span class="n">np</span><span class="p">.</span><span class="n">genfromtxt</span><span class="p">(</span><span class="n">url</span><span class="p">,</span> <span class="n">delimiter</span><span class="o">=</span><span class="s">','</span><span class="p">,</span> <span class="n">dtype</span><span class="o">=</span><span class="s">'object'</span><span class="p">)</span>
</code></pre></div></div>

<h4>Desire output</h4>

<div class="language-python highlighter-rouge"><div class="highlight"><pre class="highlight"><code><span class="c1"># 1.7
</span></code></pre></div></div>

<h4>Solution</h4>

<div class="language-python highlighter-rouge"><div class="highlight"><pre class="highlight"><code><span class="n">petal_lght_set</span> <span class="o">=</span> <span class="n">the_data_2d</span><span class="p">[</span><span class="n">the_data_2d</span><span class="p">[:,</span><span class="mi">4</span><span class="p">]</span><span class="o">==</span><span class="sa">b</span><span class="s">'Iris-setosa'</span><span class="p">,</span><span class="mi">2</span><span class="p">].</span><span class="n">astype</span><span class="p">(</span><span class="s">"float"</span><span class="p">)</span>
<span class="k">print</span><span class="p">(</span><span class="n">petal_lght_set</span><span class="p">)</span>
<span class="n">petal_lght_set_sorted</span> <span class="o">=</span> <span class="n">np</span><span class="p">.</span><span class="n">sort</span><span class="p">(</span><span class="n">petal_lght_set</span><span class="p">)</span>
<span class="n">petal_lght_set_sorted_unq</span> <span class="o">=</span> <span class="n">np</span><span class="p">.</span><span class="n">unique</span><span class="p">(</span><span class="n">petal_lght_set_sorted</span><span class="p">)</span>
<span class="n">petal_lght_set_sorted_unq</span><span class="p">[</span><span class="o">-</span><span class="mi">2</span><span class="p">]</span>
</code></pre></div></div>

<div class="language-plaintext highlighter-rouge"><div class="highlight"><pre class="highlight"><code>[1.4 1.4 1.3 1.5 1.4 1.7 1.4 1.5 1.4 1.5 1.5 1.6 1.4 1.1 1.2 1.5 1.3 1.4
 1.7 1.5 1.7 1.5 1.  1.7 1.9 1.6 1.6 1.5 1.4 1.6 1.6 1.5 1.5 1.4 1.5 1.2
 1.3 1.5 1.3 1.5 1.3 1.3 1.3 1.6 1.9 1.4 1.6 1.4 1.5 1.4]


1.7
</code></pre></div></div>

<p>We first select the 5th column (species column) to extract only the iris-setosa species. This expression will return a boolean array, which will be indexed in the original array to get back all the rows where we have the iris-setosa as the species. Now we pass in 2 as the second element in the index to get the petal length column for only the iris-setosa species and cast the array to float.</p>

<p>Then we proceed by sorting and removing duplicates in the column. After getting an ordered list of unique elements, we use indexing to get the second last element by passing in -2 which correspond to the second-longest petal length of setosa.</p>

<h3>Ex 45: How to sort a 2D array by a column</h3>

<p>Q: Sort the iris dataset based on the sepal length column.</p>

<div class="language-python highlighter-rouge"><div class="highlight"><pre class="highlight"><code><span class="n">url</span> <span class="o">=</span> <span class="s">'https://archive.ics.uci.edu/ml/machine-learning-databases/iris/iris.data'</span>
<span class="n">the_data_2d</span> <span class="o">=</span> <span class="n">np</span><span class="p">.</span><span class="n">genfromtxt</span><span class="p">(</span><span class="n">url</span><span class="p">,</span> <span class="n">delimiter</span><span class="o">=</span><span class="s">','</span><span class="p">,</span> <span class="n">dtype</span><span class="o">=</span><span class="s">'object'</span><span class="p">)</span>
</code></pre></div></div>

<h4>Desire output</h4>

<div class="language-python highlighter-rouge"><div class="highlight"><pre class="highlight"><code><span class="c1"># array([[b'4.3', b'3.0', b'1.1', b'0.1', b'Iris-setosa'],
#        [b'4.4', b'3.2', b'1.3', b'0.2', b'Iris-setosa'],
#        [b'4.4', b'3.0', b'1.3', b'0.2', b'Iris-setosa'],
#        [b'4.4', b'2.9', b'1.4', b'0.2', b'Iris-setosa'],
#        [b'4.5', b'2.3', b'1.3', b'0.3', b'Iris-setosa'],
#        [b'4.6', b'3.6', b'1.0', b'0.2', b'Iris-setosa'],
#        [b'4.6', b'3.1', b'1.5', b'0.2', b'Iris-setosa'],
#        [b'4.6', b'3.4', b'1.4', b'0.3', b'Iris-setosa'],
#        [b'4.6', b'3.2', b'1.4', b'0.2', b'Iris-setosa'],
#        [b'4.7', b'3.2', b'1.3', b'0.2', b'Iris-setosa']], dtype=object)
</span></code></pre></div></div>

<h4>Solution</h4>

<div class="language-python highlighter-rouge"><div class="highlight"><pre class="highlight"><code><span class="n">the_data_2d</span><span class="p">[</span><span class="n">the_data_2d</span><span class="p">[:,</span><span class="mi">0</span><span class="p">].</span><span class="n">astype</span><span class="p">(</span><span class="s">"float"</span><span class="p">).</span><span class="n">argsort</span><span class="p">()][:</span><span class="mi">10</span><span class="p">]</span>
</code></pre></div></div>

<div class="language-plaintext highlighter-rouge"><div class="highlight"><pre class="highlight"><code>array([[b'4.3', b'3.0', b'1.1', b'0.1', b'Iris-setosa'],
       [b'4.4', b'3.2', b'1.3', b'0.2', b'Iris-setosa'],
       [b'4.4', b'3.0', b'1.3', b'0.2', b'Iris-setosa'],
       [b'4.4', b'2.9', b'1.4', b'0.2', b'Iris-setosa'],
       [b'4.5', b'2.3', b'1.3', b'0.3', b'Iris-setosa'],
       [b'4.6', b'3.6', b'1.0', b'0.2', b'Iris-setosa'],
       [b'4.6', b'3.1', b'1.5', b'0.2', b'Iris-setosa'],
       [b'4.6', b'3.4', b'1.4', b'0.3', b'Iris-setosa'],
       [b'4.6', b'3.2', b'1.4', b'0.2', b'Iris-setosa'],
       [b'4.7', b'3.2', b'1.3', b'0.2', b'Iris-setosa']], dtype=object)
</code></pre></div></div>

<p>We first select the column we want to sort (in our case the sepal length), cast it to float and use the argsort method to sort and get back the position index of each sorted element.</p>

<p>Then pass the expression to the original array by using indexing, which will sort the whole array using the sepal length values. Finally, print the first 10 rows.</p>

<h3>Ex 46: How to find the most frequent value in a NumPy column</h3>

<p>Q: Find the most frequent value of petal length (3rd column) in the the_data_2d dataset.</p>

<div class="language-python highlighter-rouge"><div class="highlight"><pre class="highlight"><code><span class="n">url</span> <span class="o">=</span> <span class="s">'https://archive.ics.uci.edu/ml/machine-learning-databases/iris/iris.data'</span>
<span class="n">the_data_2d</span> <span class="o">=</span> <span class="n">np</span><span class="p">.</span><span class="n">genfromtxt</span><span class="p">(</span><span class="n">url</span><span class="p">,</span> <span class="n">delimiter</span><span class="o">=</span><span class="s">','</span><span class="p">,</span> <span class="n">dtype</span><span class="o">=</span><span class="s">'object'</span><span class="p">)</span>
</code></pre></div></div>

<h4>Desired output</h4>

<div class="language-python highlighter-rouge"><div class="highlight"><pre class="highlight"><code><span class="c1">#1.5
</span></code></pre></div></div>

<h4>Solution</h4>

<div class="language-python highlighter-rouge"><div class="highlight"><pre class="highlight"><code><span class="n">unique_num</span><span class="p">,</span> <span class="n">unique_count</span> <span class="o">=</span> <span class="n">np</span><span class="p">.</span><span class="n">unique</span><span class="p">(</span><span class="n">the_data_2d</span><span class="p">[:,</span><span class="mi">2</span><span class="p">].</span><span class="n">astype</span><span class="p">(</span><span class="s">"float64"</span><span class="p">),</span><span class="n">return_counts</span><span class="o">=</span><span class="bp">True</span><span class="p">)</span>
</code></pre></div></div>

<div class="language-python highlighter-rouge"><div class="highlight"><pre class="highlight"><code><span class="n">unique_num</span><span class="p">[</span><span class="n">np</span><span class="p">.</span><span class="n">argmax</span><span class="p">(</span><span class="n">unique_count</span><span class="p">)]</span>
</code></pre></div></div>

<div class="language-plaintext highlighter-rouge"><div class="highlight"><pre class="highlight"><code>1.5
</code></pre></div></div>

<p>Here we are using the unique value to get back unique elements (unduplicated elements) and set the total count to True, which will return the counts of how many times an element is duplicated in the column.</p>

<p>With these two variables, we can get the element that was duplicated the most by using the argmax method and give it the argument unique_count and get back the position index of the greatest number. Then we use that position in the unique_num array to get the most reoccurring value.</p>

<h3>Ex 47: Find the position and the first occurrence of a value greater than a given value</h3>

<p>Q: Find the position and the exact value of the first occurrence greater than 1.0 in the petal width column (4th column) of the_data_2d dataset.</p>

<div class="language-python highlighter-rouge"><div class="highlight"><pre class="highlight"><code><span class="n">url</span> <span class="o">=</span> <span class="s">'https://archive.ics.uci.edu/ml/machine-learning-databases/iris/iris.data'</span>
<span class="n">the_data_2d</span> <span class="o">=</span> <span class="n">np</span><span class="p">.</span><span class="n">genfromtxt</span><span class="p">(</span><span class="n">url</span><span class="p">,</span> <span class="n">delimiter</span><span class="o">=</span><span class="s">','</span><span class="p">,</span> <span class="n">dtype</span><span class="o">=</span><span class="s">'object'</span><span class="p">)</span>
</code></pre></div></div>

<h4>Desired output</h4>

<div class="language-python highlighter-rouge"><div class="highlight"><pre class="highlight"><code><span class="c1"># The element is 1.4 and is located at position 50 in the petal width column
</span></code></pre></div></div>

<h4>Solution</h4>

<div class="language-python highlighter-rouge"><div class="highlight"><pre class="highlight"><code><span class="n">all_position</span> <span class="o">=</span> <span class="n">np</span><span class="p">.</span><span class="n">where</span><span class="p">(</span><span class="n">the_data_2d</span><span class="p">[:,</span><span class="mi">3</span><span class="p">].</span><span class="n">astype</span><span class="p">(</span><span class="s">"float"</span><span class="p">)</span><span class="o">&gt;</span><span class="mi">1</span><span class="p">)</span>
<span class="n">larg_num_position</span> <span class="o">=</span> <span class="n">all_position</span><span class="p">[</span><span class="mi">0</span><span class="p">][</span><span class="mi">0</span><span class="p">]</span>
</code></pre></div></div>

<div class="language-python highlighter-rouge"><div class="highlight"><pre class="highlight"><code><span class="n">larg_num</span> <span class="o">=</span> <span class="n">the_data_2d</span><span class="p">[</span><span class="n">larg_num_position</span><span class="p">,</span><span class="mi">3</span><span class="p">]</span>
</code></pre></div></div>

<div class="language-python highlighter-rouge"><div class="highlight"><pre class="highlight"><code><span class="k">print</span><span class="p">(</span><span class="s">"The element is {} and is located at position {} in the petal width column"</span><span class="p">.</span><span class="nb">format</span><span class="p">(</span><span class="nb">float</span><span class="p">(</span><span class="n">larg_num</span><span class="p">),</span><span class="n">larg_num_position</span><span class="p">))</span>
</code></pre></div></div>

<div class="language-plaintext highlighter-rouge"><div class="highlight"><pre class="highlight"><code>The element is 1.4 and is located at position 50 in the petal width column
</code></pre></div></div>

<p>We get all the elements in the petal width column and cast them to float, then compare each element to 1 and get back all the positions where the elements are greater than 1 using the numpy where method.</p>

<p>At this stage, we have a 2D array with all the positions of elements higher than 1. To select the first element that corresponds to the first occurrence of a value greater than 1, we use [0] to get the first array within the 2D array and then another [0] right after to get the first element in the nested 1D array.</p>

<p>Now that we managed to get the position of that number, we can get the value itself by using NumPy indexing in the 4th column.</p>

<h3>Ex 48: Replace all values greater than a given value to a given cutoff</h3>

<p>Q: From array_a, replace all values greater than 30 to 30 and less than 10 to 10.</p>

<div class="language-python highlighter-rouge"><div class="highlight"><pre class="highlight"><code><span class="n">np</span><span class="p">.</span><span class="n">random</span><span class="p">.</span><span class="n">seed</span><span class="p">(</span><span class="mi">100</span><span class="p">)</span>
<span class="n">array_a</span> <span class="o">=</span> <span class="n">np</span><span class="p">.</span><span class="n">random</span><span class="p">.</span><span class="n">uniform</span><span class="p">(</span><span class="mi">1</span><span class="p">,</span><span class="mi">50</span><span class="p">,</span> <span class="mi">20</span><span class="p">)</span>
<span class="n">array_a</span>
</code></pre></div></div>

<div class="language-plaintext highlighter-rouge"><div class="highlight"><pre class="highlight"><code>array([27.62684215, 14.64009987, 21.80136195, 42.39403048,  1.23122395,
        6.95688692, 33.86670515, 41.466785  ,  7.69862289, 29.17957314,
       44.67477576, 11.25090398, 10.08108276,  6.31046763, 11.76517714,
       48.95256545, 40.77247431,  9.42510962, 40.99501269, 14.42961361])
</code></pre></div></div>

<h4>Desire output</h4>

<div class="language-python highlighter-rouge"><div class="highlight"><pre class="highlight"><code><span class="c1"># array([27.62684215, 14.64009987, 21.80136195, 30.        , 10.        ,
#        10.        , 30.        , 30.        , 10.        , 29.17957314,
#        30.        , 11.25090398, 10.08108276, 10.        , 11.76517714,
#        30.        , 30.        , 10.        , 30.        , 14.42961361])
</span></code></pre></div></div>

<h4>Solution</h4>

<h4>1st Method</h4>

<div class="language-python highlighter-rouge"><div class="highlight"><pre class="highlight"><code><span class="n">np</span><span class="p">.</span><span class="n">where</span><span class="p">(</span><span class="n">array_a</span><span class="o">&gt;</span><span class="mi">30</span><span class="p">,</span><span class="mi">30</span><span class="p">,</span><span class="n">np</span><span class="p">.</span><span class="n">where</span><span class="p">(</span><span class="n">array_a</span><span class="o">&lt;</span><span class="mi">10</span><span class="p">,</span><span class="mi">10</span><span class="p">,</span><span class="n">array_a</span><span class="p">))</span>
</code></pre></div></div>

<div class="language-plaintext highlighter-rouge"><div class="highlight"><pre class="highlight"><code>array([27.62684215, 14.64009987, 21.80136195, 30.        , 10.        ,
       10.        , 30.        , 30.        , 10.        , 29.17957314,
       30.        , 11.25090398, 10.08108276, 10.        , 11.76517714,
       30.        , 30.        , 10.        , 30.        , 14.42961361])
</code></pre></div></div>

<p>The first way to approach this problem is to use the where method, which takes in as the first argument, the condition we are looking for; in this case, we want to target elements in the array greater than 30. Then, the second argument is the value that will replace each position where the condition is satisfied. It means that all the elements greater than 30 will be replaced by number 30 in the array.</p>

<p>Finally, the second argument is the value that will be placed in each position where the condition from the first argument is not met. But in our case, we want to change each value less than 10 to 10 that is why we are using another where method to change all the numbers less than 10 to 10 just like we did for 30. The only difference is that this time for the third argument in the nested where method, we pass in the original array, which leaves all the numbers greater than 10 untouched.</p>

<h4>2nd Method</h4>

<div class="language-python highlighter-rouge"><div class="highlight"><pre class="highlight"><code><span class="n">np</span><span class="p">.</span><span class="n">clip</span><span class="p">(</span><span class="n">array_a</span><span class="p">,</span><span class="mi">10</span><span class="p">,</span><span class="mi">30</span><span class="p">)</span>
</code></pre></div></div>

<div class="language-plaintext highlighter-rouge"><div class="highlight"><pre class="highlight"><code>array([27.62684215, 14.64009987, 21.80136195, 30.        , 10.        ,
       10.        , 30.        , 30.        , 10.        , 29.17957314,
       30.        , 11.25090398, 10.08108276, 10.        , 11.76517714,
       30.        , 30.        , 10.        , 30.        , 14.42961361])
</code></pre></div></div>

<p>We can use the clip method, which is easier to understand. We pass in the array itself, and then as a second argument, we place the number 10, which will replace all the numbers less than 10 by 10. The third argument is the maximum number, which will replace all the numbers greater than 30 by 30. That’s all!</p>

<h3>Ex 49: How to get the positions of top n values from a NumPy array?</h3>

<p>Q: Get the positions of top 5 maximum values in a given array a.</p>

<div class="language-python highlighter-rouge"><div class="highlight"><pre class="highlight"><code><span class="n">np</span><span class="p">.</span><span class="n">random</span><span class="p">.</span><span class="n">seed</span><span class="p">(</span><span class="mi">100</span><span class="p">)</span>
<span class="n">a</span> <span class="o">=</span> <span class="n">np</span><span class="p">.</span><span class="n">random</span><span class="p">.</span><span class="n">uniform</span><span class="p">(</span><span class="mi">1</span><span class="p">,</span><span class="mi">50</span><span class="p">,</span> <span class="mi">20</span><span class="p">)</span>
</code></pre></div></div>

<h4>Desire output</h4>

<div class="language-python highlighter-rouge"><div class="highlight"><pre class="highlight"><code><span class="c1">#array([18,  7,  3, 10, 15])
</span></code></pre></div></div>

<h4>Solution</h4>

<div class="language-python highlighter-rouge"><div class="highlight"><pre class="highlight"><code><span class="n">np</span><span class="p">.</span><span class="n">argsort</span><span class="p">(</span><span class="n">a</span><span class="p">)[</span><span class="o">-</span><span class="mi">5</span><span class="p">:]</span>
</code></pre></div></div>

<div class="language-plaintext highlighter-rouge"><div class="highlight"><pre class="highlight"><code>array([18,  7,  3, 10, 15])
</code></pre></div></div>

<p>We can use the argsort method, which returns the position from the smallest to the highest elements. To get the position of 5 maximum element, we extract the five last elements using indexing [-5:]</p>

<h3>Ex 50: How to compute the row-wise counts of all possible values in an array</h3>

<p>Q: Compute the counts of unique values row-wise.</p>

<p>Instruction: Output contains 10 columns representing numbers from 1 to 10. The values in the solution are the counts of the numbers in the respective rows.</p>

<p>For example, Cell(0,2) in the solution has value 2, which means that the number 3 occurs precisely 2 times in the 1st row.</p>

<p>Keep in mind that we are generating a random array from 1 to 10, not from 0 to 10. It means that in the output solution, 1 is in the first column, 2 in the second column, and so on.</p>

<div class="language-python highlighter-rouge"><div class="highlight"><pre class="highlight"><code><span class="n">np</span><span class="p">.</span><span class="n">random</span><span class="p">.</span><span class="n">seed</span><span class="p">(</span><span class="mi">100</span><span class="p">)</span>
<span class="n">arr</span> <span class="o">=</span> <span class="n">np</span><span class="p">.</span><span class="n">random</span><span class="p">.</span><span class="n">randint</span><span class="p">(</span><span class="mi">1</span><span class="p">,</span><span class="mi">11</span><span class="p">,</span><span class="n">size</span><span class="o">=</span><span class="p">(</span><span class="mi">6</span><span class="p">,</span> <span class="mi">10</span><span class="p">))</span>
<span class="n">arr</span>
</code></pre></div></div>

<div class="language-plaintext highlighter-rouge"><div class="highlight"><pre class="highlight"><code>array([[ 9,  9,  4,  8,  8,  1,  5,  3,  6,  3],
       [ 3,  3,  2,  1,  9,  5,  1, 10,  7,  3],
       [ 5,  2,  6,  4,  5,  5,  4,  8,  2,  2],
       [ 8,  8,  1,  3, 10, 10,  4,  3,  6,  9],
       [ 2,  1,  8,  7,  3,  1,  9,  3,  6,  2],
       [ 9,  2,  6,  5,  3,  9,  4,  6,  1, 10]])
</code></pre></div></div>

<h4>Desire output</h4>

<div class="language-python highlighter-rouge"><div class="highlight"><pre class="highlight"><code><span class="c1"># [[1, 0, 2, 1, 1, 1, 0, 2, 2, 0],
#  [2, 1, 3, 0, 1, 0, 1, 0, 1, 1],
#  [0, 3, 0, 2, 3, 1, 0, 1, 0, 0],
#  [1, 0, 2, 1, 0, 1, 0, 2, 1, 2],
#  [2, 2, 2, 0, 0, 1, 1, 1, 1, 0],
#  [1, 1, 1, 1, 1, 2, 0, 0, 2, 1]]
</span></code></pre></div></div>

<h4>Solution</h4>

<div class="language-python highlighter-rouge"><div class="highlight"><pre class="highlight"><code><span class="k">def</span> <span class="nf">count_all_repeat</span><span class="p">(</span><span class="n">arr</span><span class="p">):</span>
    <span class="n">uni_count_arr</span> <span class="o">=</span> <span class="p">[</span><span class="n">np</span><span class="p">.</span><span class="n">unique</span><span class="p">(</span><span class="n">row</span><span class="p">,</span><span class="n">return_counts</span><span class="o">=</span><span class="bp">True</span><span class="p">)</span> <span class="k">for</span> <span class="n">row</span> <span class="ow">in</span> <span class="n">arr</span><span class="p">]</span>
    <span class="n">final_array</span> <span class="o">=</span> <span class="p">[[</span><span class="nb">int</span><span class="p">(</span><span class="n">counts</span><span class="p">[</span><span class="n">uniques</span><span class="o">==</span><span class="n">i</span><span class="p">])</span> <span class="k">if</span> <span class="n">i</span> <span class="ow">in</span> <span class="n">uniques</span> <span class="k">else</span> <span class="mi">0</span> <span class="k">for</span> <span class="n">i</span> <span class="ow">in</span> <span class="n">np</span><span class="p">.</span><span class="n">unique</span><span class="p">(</span><span class="n">arr</span><span class="p">)]</span> <span class="k">for</span> <span class="n">uniques</span><span class="p">,</span> <span class="n">counts</span> <span class="ow">in</span> <span class="n">uni_count_arr</span><span class="p">]</span>
    <span class="k">return</span> <span class="n">final_array</span>
<span class="n">count_all_repeat</span><span class="p">(</span><span class="n">arr</span><span class="p">)</span>
</code></pre></div></div>

<div class="language-plaintext highlighter-rouge"><div class="highlight"><pre class="highlight"><code>[[1, 0, 2, 1, 1, 1, 0, 2, 2, 0],
 [2, 1, 3, 0, 1, 0, 1, 0, 1, 1],
 [0, 3, 0, 2, 3, 1, 0, 1, 0, 0],
 [1, 0, 2, 1, 0, 1, 0, 2, 1, 2],
 [2, 2, 2, 0, 0, 1, 1, 1, 1, 0],
 [1, 1, 1, 1, 1, 2, 0, 0, 2, 1]]
</code></pre></div></div>

<p>We first create a function and then pass in the array. We search for unique elements and the number of times those elements occur in each row of the array. That is why we are using the list comprehension to go through all the rows to get the uni_count_arr.</p>

<p>The next line is where the magic is happening! We start by going through all the uniques elements and counts from uni_count_arr variable. Then we create a nested list comprehension inside a list comprehension. Inside this list comprehension, we loop through all the unique elements in the array, which will between 1 to 10 and use an if statement to see if a specific number is in the uniques array.</p>

<p>If it is not found, 0 will be returned, which means that the number is not in the row. If the number is found, we are using indexing on the counts array to get the position where there is a match between uniques value and i value, and cast it to an integer. Finally, we return the multidimensional array.</p>

<p>Note: We could also have used a nested for loop with an if &amp; else statement.</p>

<h3>Ex 51: How to convert an array of arrays into a flat 1d array</h3>

<p>Q: Convert array_of_arrays into a flat linear 1d array.</p>

<div class="language-python highlighter-rouge"><div class="highlight"><pre class="highlight"><code><span class="n">arr1</span> <span class="o">=</span> <span class="n">np</span><span class="p">.</span><span class="n">arange</span><span class="p">(</span><span class="mi">3</span><span class="p">)</span>
<span class="n">arr2</span> <span class="o">=</span> <span class="n">np</span><span class="p">.</span><span class="n">arange</span><span class="p">(</span><span class="mi">3</span><span class="p">,</span><span class="mi">7</span><span class="p">)</span>
<span class="n">arr3</span> <span class="o">=</span> <span class="n">np</span><span class="p">.</span><span class="n">arange</span><span class="p">(</span><span class="mi">7</span><span class="p">,</span><span class="mi">10</span><span class="p">)</span>

<span class="n">array_of_arrays</span> <span class="o">=</span> <span class="n">np</span><span class="p">.</span><span class="n">array</span><span class="p">([</span><span class="n">arr1</span><span class="p">,</span> <span class="n">arr2</span><span class="p">,</span> <span class="n">arr3</span><span class="p">])</span>
</code></pre></div></div>

<h4>Desire output</h4>

<div class="language-python highlighter-rouge"><div class="highlight"><pre class="highlight"><code><span class="c1"># array([0, 1, 2, 3, 4, 5, 6, 7, 8, 9])
</span></code></pre></div></div>

<h4>Solution</h4>

<div class="language-python highlighter-rouge"><div class="highlight"><pre class="highlight"><code><span class="n">np</span><span class="p">.</span><span class="n">concatenate</span><span class="p">(</span><span class="n">array_of_arrays</span><span class="p">)</span>
</code></pre></div></div>

<div class="language-plaintext highlighter-rouge"><div class="highlight"><pre class="highlight"><code>array([0, 1, 2, 3, 4, 5, 6, 7, 8, 9])
</code></pre></div></div>

<p>We use the concatenate method to merge all the arrays into one array.</p>

<h3>Ex 52: How to generate one-hot encoding for an array</h3>

<p>Q: Compute the one-hot encoding (dummy binary variables for each unique value in the array)</p>

<p>Generating a one-hot encoding is creating a multidimensional array where the number of rows corresponds to the number of elements in the array. 1 will be placed in the position corresponding to the value of the component of the array and 0 will be placed in the remaining positions. for eg, if we have 2 as a value in the original array, the corresponding row will [ 0.,  1.,  0.] where 1 is placed at position 2.</p>

<div class="language-python highlighter-rouge"><div class="highlight"><pre class="highlight"><code><span class="n">np</span><span class="p">.</span><span class="n">random</span><span class="p">.</span><span class="n">seed</span><span class="p">(</span><span class="mi">101</span><span class="p">)</span> 
<span class="n">arr</span> <span class="o">=</span> <span class="n">np</span><span class="p">.</span><span class="n">random</span><span class="p">.</span><span class="n">randint</span><span class="p">(</span><span class="mi">1</span><span class="p">,</span><span class="mi">4</span><span class="p">,</span> <span class="n">size</span><span class="o">=</span><span class="mi">6</span><span class="p">)</span>
<span class="n">arr</span>
</code></pre></div></div>

<div class="language-plaintext highlighter-rouge"><div class="highlight"><pre class="highlight"><code>array([2, 3, 2, 2, 2, 1])
</code></pre></div></div>

<h4>Desire output</h4>

<div class="language-python highlighter-rouge"><div class="highlight"><pre class="highlight"><code><span class="c1">#array([[ 0.,  1.,  0.],
#       [ 0.,  0.,  1.],
#       [ 0.,  1.,  0.],
#       [ 0.,  1.,  0.],
#       [ 0.,  1.,  0.],
#       [ 1.,  0.,  0.]])
</span></code></pre></div></div>

<h4>Solution</h4>

<div class="language-python highlighter-rouge"><div class="highlight"><pre class="highlight"><code><span class="k">def</span> <span class="nf">one_hot_encodings</span><span class="p">(</span><span class="n">arr</span><span class="p">):</span>
    <span class="n">the_uniques</span> <span class="o">=</span> <span class="n">np</span><span class="p">.</span><span class="n">unique</span><span class="p">(</span><span class="n">arr</span><span class="p">)</span>
    <span class="n">the_out</span> <span class="o">=</span> <span class="n">np</span><span class="p">.</span><span class="n">zeros</span><span class="p">((</span><span class="n">arr</span><span class="p">.</span><span class="n">shape</span><span class="p">[</span><span class="mi">0</span><span class="p">],</span><span class="n">the_uniques</span><span class="p">.</span><span class="n">shape</span><span class="p">[</span><span class="mi">0</span><span class="p">]))</span>
    <span class="k">for</span> <span class="n">i</span><span class="p">,</span><span class="n">element</span> <span class="ow">in</span> <span class="nb">enumerate</span><span class="p">(</span><span class="n">arr</span><span class="p">):</span>
        <span class="n">the_out</span><span class="p">[</span><span class="n">i</span><span class="p">,</span><span class="n">element</span><span class="o">-</span><span class="mi">1</span><span class="p">]</span> <span class="o">=</span> <span class="mi">1</span>
    <span class="k">return</span> <span class="n">the_out</span>

<span class="n">one_hot_encodings</span><span class="p">(</span><span class="n">arr</span><span class="p">)</span>
</code></pre></div></div>

<div class="language-plaintext highlighter-rouge"><div class="highlight"><pre class="highlight"><code>array([[0., 1., 0.],
       [0., 0., 1.],
       [0., 1., 0.],
       [0., 1., 0.],
       [0., 1., 0.],
       [1., 0., 0.]])
</code></pre></div></div>

<p>aWe create first a function that takes in the original array. We get all the uniques elements from the array and create a multidimensional array using the np.zeros method, where the first element in the tuple corresponds to the row which is the numbers of elements in the original array and the second element is the columns corresponding to the uniques array(maximum is 3).</p>

<p>We then create a for loop with the enumerate function, where each element in the array is assigned a number starting from 0. Then we use indexing on the_out variable to traverse all the rows using i value and the element minus 1 as the position of the column; we do subtract one to get the index in the row depending on the value of the element value. For example, for the second row, the corresponding element in the original array is 3, so 3 - 1 gives 2, which is the position to place 1.</p>

<p>After targeting that specific row and column, we are going replacing 0 by 1 to that particular position. After the loop is done, we return the array.</p>

<h3>Ex 53: How to create row numbers grouped by a categorical variable</h3>

<p>Q: Create row numbers grouped by a categorical variable. Use the following sample from iris species as input.</p>

<div class="language-python highlighter-rouge"><div class="highlight"><pre class="highlight"><code><span class="n">url</span> <span class="o">=</span> <span class="s">'https://archive.ics.uci.edu/ml/machine-learning-databases/iris/iris.data'</span>
<span class="n">species</span> <span class="o">=</span> <span class="n">np</span><span class="p">.</span><span class="n">genfromtxt</span><span class="p">(</span><span class="n">url</span><span class="p">,</span> <span class="n">delimiter</span><span class="o">=</span><span class="s">','</span><span class="p">,</span> <span class="n">dtype</span><span class="o">=</span><span class="s">'str'</span><span class="p">,</span> <span class="n">usecols</span><span class="o">=</span><span class="mi">4</span><span class="p">)</span>
<span class="n">np</span><span class="p">.</span><span class="n">random</span><span class="p">.</span><span class="n">seed</span><span class="p">(</span><span class="mi">100</span><span class="p">)</span>
<span class="n">species_sm_sorted</span> <span class="o">=</span> <span class="n">np</span><span class="p">.</span><span class="n">sort</span><span class="p">(</span><span class="n">np</span><span class="p">.</span><span class="n">random</span><span class="p">.</span><span class="n">choice</span><span class="p">(</span><span class="n">species</span><span class="p">,</span><span class="n">size</span><span class="o">=</span><span class="mi">20</span><span class="p">))</span>
<span class="n">species_sm_sorted</span>
</code></pre></div></div>

<div class="language-plaintext highlighter-rouge"><div class="highlight"><pre class="highlight"><code>array(['Iris-setosa', 'Iris-setosa', 'Iris-setosa', 'Iris-setosa',
       'Iris-setosa', 'Iris-versicolor', 'Iris-versicolor',
       'Iris-versicolor', 'Iris-versicolor', 'Iris-versicolor',
       'Iris-versicolor', 'Iris-versicolor', 'Iris-versicolor',
       'Iris-versicolor', 'Iris-virginica', 'Iris-virginica',
       'Iris-virginica', 'Iris-virginica', 'Iris-virginica',
       'Iris-virginica'], dtype='&lt;U15')
</code></pre></div></div>

<h4>Desired output</h4>

<div class="language-python highlighter-rouge"><div class="highlight"><pre class="highlight"><code><span class="c1">#[0, 1, 2, 3, 4, 0, 1, 2, 3, 4, 5, 6, 7, 8, 0, 1, 2, 3, 4, 5]
</span></code></pre></div></div>

<h4>Solution</h4>

<h4>1st Method: using the list comprehension</h4>

<div class="language-python highlighter-rouge"><div class="highlight"><pre class="highlight"><code><span class="p">[</span><span class="n">i</span> <span class="k">for</span> <span class="n">unique_val</span> <span class="ow">in</span> <span class="n">np</span><span class="p">.</span><span class="n">unique</span><span class="p">(</span><span class="n">species_sm_sorted</span><span class="p">)</span> <span class="k">for</span> <span class="n">i</span><span class="p">,</span><span class="n">_</span> <span class="ow">in</span> <span class="nb">enumerate</span><span class="p">(</span><span class="n">species_sm_sorted</span><span class="p">[</span><span class="n">species_sm_sorted</span><span class="o">==</span><span class="n">unique_val</span><span class="p">])]</span>
</code></pre></div></div>

<div class="language-plaintext highlighter-rouge"><div class="highlight"><pre class="highlight"><code>[0, 1, 2, 3, 4, 0, 1, 2, 3, 4, 5, 6, 7, 8, 0, 1, 2, 3, 4, 5]
</code></pre></div></div>

<p>The first way to go about to resolve this is to use a list comprehension. We get all the 3 unique species values and place them in the unique_val.</p>

<p>We create another for loop with i value as the count from the enumerate function, which will count the number of occurrences of the unique_val variable in species_sm_sorted array starting from 0. For each species, the count is reset.</p>

<p>Finally, we return the i variable in the array.</p>

<h4>2nd Method: using the for loop</h4>

<div class="language-python highlighter-rouge"><div class="highlight"><pre class="highlight"><code><span class="n">output</span> <span class="o">=</span> <span class="p">[]</span>

<span class="k">for</span> <span class="n">val</span> <span class="ow">in</span> <span class="n">np</span><span class="p">.</span><span class="n">unique</span><span class="p">(</span><span class="n">species_sm_sorted</span><span class="p">):</span>
    <span class="k">for</span> <span class="n">i</span><span class="p">,</span><span class="n">_</span> <span class="ow">in</span> <span class="nb">enumerate</span><span class="p">(</span><span class="n">species_sm_sorted</span><span class="p">[</span><span class="n">species_sm_sorted</span><span class="o">==</span><span class="n">val</span><span class="p">]):</span>
        <span class="n">output</span><span class="p">.</span><span class="n">append</span><span class="p">(</span><span class="n">i</span><span class="p">)</span>
<span class="k">print</span><span class="p">(</span><span class="n">output</span><span class="p">)</span>
</code></pre></div></div>

<div class="language-plaintext highlighter-rouge"><div class="highlight"><pre class="highlight"><code>[0, 1, 2, 3, 4, 0, 1, 2, 3, 4, 5, 6, 7, 8, 0, 1, 2, 3, 4, 5]
</code></pre></div></div>

<p>We create a for loop to loop through the uniques elements in the array species_sm_sorted which are Iris-setosa, Iris-versicolor, and Iris-virginica.</p>

<p>Then we create a nested for loop with i as the count from the enumerate function, which will count the number of occurrences of the unique_val variable in species_sm_sorted array starting from 0. For each species, the count is reset just as we did with the list comprehension method.</p>

<p>Finally, we return the i variable in the array.</p>

<h3>Ex 54: How to create group ids based on a given categorical variable</h3>

<p>Q: Create group ids based on a given categorical variable. Use the following sample from iris species as input.</p>

<div class="language-python highlighter-rouge"><div class="highlight"><pre class="highlight"><code><span class="n">url</span> <span class="o">=</span> <span class="s">'https://archive.ics.uci.edu/ml/machine-learning-databases/iris/iris.data'</span>
<span class="n">species</span> <span class="o">=</span> <span class="n">np</span><span class="p">.</span><span class="n">genfromtxt</span><span class="p">(</span><span class="n">url</span><span class="p">,</span> <span class="n">delimiter</span><span class="o">=</span><span class="s">','</span><span class="p">,</span> <span class="n">dtype</span><span class="o">=</span><span class="s">'str'</span><span class="p">,</span> <span class="n">usecols</span><span class="o">=</span><span class="mi">4</span><span class="p">)</span>
<span class="n">np</span><span class="p">.</span><span class="n">random</span><span class="p">.</span><span class="n">seed</span><span class="p">(</span><span class="mi">100</span><span class="p">)</span>
<span class="n">species_sm_sorted</span> <span class="o">=</span> <span class="n">np</span><span class="p">.</span><span class="n">sort</span><span class="p">(</span><span class="n">np</span><span class="p">.</span><span class="n">random</span><span class="p">.</span><span class="n">choice</span><span class="p">(</span><span class="n">species</span><span class="p">,</span><span class="n">size</span><span class="o">=</span><span class="mi">20</span><span class="p">))</span>
<span class="n">species_sm_sorted</span>
</code></pre></div></div>

<div class="language-plaintext highlighter-rouge"><div class="highlight"><pre class="highlight"><code>array(['Iris-setosa', 'Iris-setosa', 'Iris-setosa', 'Iris-setosa',
       'Iris-setosa', 'Iris-versicolor', 'Iris-versicolor',
       'Iris-versicolor', 'Iris-versicolor', 'Iris-versicolor',
       'Iris-versicolor', 'Iris-versicolor', 'Iris-versicolor',
       'Iris-versicolor', 'Iris-virginica', 'Iris-virginica',
       'Iris-virginica', 'Iris-virginica', 'Iris-virginica',
       'Iris-virginica'], dtype='&lt;U15')
</code></pre></div></div>

<h4>Desired output</h4>

<div class="language-python highlighter-rouge"><div class="highlight"><pre class="highlight"><code><span class="c1"># [0, 0, 0, 0, 0, 1, 1, 1, 1, 1, 1, 1, 1, 1, 2, 2, 2, 2, 2, 2]
</span></code></pre></div></div>

<h4>Solution</h4>

<h4>1st Method: Using list comprehension</h4>

<div class="language-python highlighter-rouge"><div class="highlight"><pre class="highlight"><code><span class="n">group_id</span> <span class="o">=</span> <span class="p">[</span><span class="n">np</span><span class="p">.</span><span class="n">argwhere</span><span class="p">(</span><span class="n">np</span><span class="p">.</span><span class="n">unique</span><span class="p">(</span><span class="n">species_sm_sorted</span><span class="p">)</span><span class="o">==</span><span class="n">each_unique</span><span class="p">)[</span><span class="mi">0</span><span class="p">][</span><span class="mi">0</span><span class="p">]</span> <span class="k">for</span> <span class="n">each_unique</span> <span class="ow">in</span> <span class="n">species_sm_sorted</span><span class="p">]</span>
</code></pre></div></div>

<div class="language-python highlighter-rouge"><div class="highlight"><pre class="highlight"><code><span class="n">group_id</span>
</code></pre></div></div>

<div class="language-plaintext highlighter-rouge"><div class="highlight"><pre class="highlight"><code>[0, 0, 0, 0, 0, 1, 1, 1, 1, 1, 1, 1, 1, 1, 2, 2, 2, 2, 2, 2]
</code></pre></div></div>

<p>This method is the same as using the for loop method just that, in this case, we are using a list comprehension. Please refer to for loop method for the explanation.</p>

<h4>2nd Method: Using for loop</h4>

<div class="language-python highlighter-rouge"><div class="highlight"><pre class="highlight"><code><span class="n">output</span> <span class="o">=</span> <span class="p">[]</span>

<span class="k">for</span> <span class="n">each_unique</span> <span class="ow">in</span> <span class="n">species_sm_sorted</span><span class="p">:</span>
    <span class="n">group_id</span> <span class="o">=</span> <span class="n">np</span><span class="p">.</span><span class="n">argwhere</span><span class="p">(</span><span class="n">np</span><span class="p">.</span><span class="n">unique</span><span class="p">(</span><span class="n">species_sm_sorted</span><span class="p">)</span><span class="o">==</span><span class="n">each_unique</span><span class="p">)[</span><span class="mi">0</span><span class="p">][</span><span class="mi">0</span><span class="p">]</span>
    <span class="n">output</span><span class="p">.</span><span class="n">append</span><span class="p">(</span><span class="n">group_id</span><span class="p">)</span>
        
<span class="k">print</span><span class="p">(</span><span class="n">output</span><span class="p">)</span>
</code></pre></div></div>

<div class="language-plaintext highlighter-rouge"><div class="highlight"><pre class="highlight"><code>[0, 0, 0, 0, 0, 1, 1, 1, 1, 1, 1, 1, 1, 1, 2, 2, 2, 2, 2, 2]
</code></pre></div></div>

<p>We first loop through each element of species_sm_sorted array. Then we use the np.argwhere method to get the positions where the condition inside the parenthesis is met. The condition is that uniques elements in species_sm_sorted array are equal to each_unique variable.</p>

<p>We get back the positions where each_unique variables are found as standalone arrays. We use indexing [0][0] to the value inside the 2D array. So that means that Iris-setosa is found 5 times at position 0, then that Iris-versicolor is found 9 times at position 1 and finally that Iris-virginica is found 6 times at position 2.</p>

<p>Finally, we append to the empty list output.</p>

<h3>Ex 55: How to rank items in an array using NumPy</h3>

<p>Q: Create the ranks for the given numeric array a.</p>

<div class="language-python highlighter-rouge"><div class="highlight"><pre class="highlight"><code><span class="n">np</span><span class="p">.</span><span class="n">random</span><span class="p">.</span><span class="n">seed</span><span class="p">(</span><span class="mi">10</span><span class="p">)</span>
<span class="n">arr</span> <span class="o">=</span> <span class="n">np</span><span class="p">.</span><span class="n">random</span><span class="p">.</span><span class="n">randint</span><span class="p">(</span><span class="mi">20</span><span class="p">,</span> <span class="n">size</span><span class="o">=</span><span class="mi">10</span><span class="p">)</span>
<span class="n">arr</span>
</code></pre></div></div>

<div class="language-plaintext highlighter-rouge"><div class="highlight"><pre class="highlight"><code>array([ 9,  4, 15,  0, 17, 16, 17,  8,  9,  0])
</code></pre></div></div>

<h4>Desire output</h4>

<div class="language-python highlighter-rouge"><div class="highlight"><pre class="highlight"><code><span class="c1">#[4 2 6 0 8 7 9 3 5 1]
</span></code></pre></div></div>

<h4>Solution</h4>

<div class="language-python highlighter-rouge"><div class="highlight"><pre class="highlight"><code><span class="n">arr</span><span class="p">.</span><span class="n">argsort</span><span class="p">().</span><span class="n">argsort</span><span class="p">()</span>
</code></pre></div></div>

<div class="language-plaintext highlighter-rouge"><div class="highlight"><pre class="highlight"><code>array([4, 2, 6, 0, 8, 7, 9, 3, 5, 1])
</code></pre></div></div>

<p>To get the rank of an array, we apply the argsort method on the array twice.</p>

<p>The first time we apply the argsort method, we get back an array with the position that would sort the original array.</p>

<p>Applying the argsort again on the previous array will return an array where those positions are sorted for the second time; to get back the ranks.</p>

<h3>Ex 56: How to rank items in a multidimensional array using NumPy</h3>

<p>Q: Create a rank array of the same shape as a given numeric array a.</p>

<div class="language-python highlighter-rouge"><div class="highlight"><pre class="highlight"><code><span class="n">np</span><span class="p">.</span><span class="n">random</span><span class="p">.</span><span class="n">seed</span><span class="p">(</span><span class="mi">10</span><span class="p">)</span>
<span class="n">arr</span> <span class="o">=</span> <span class="n">np</span><span class="p">.</span><span class="n">random</span><span class="p">.</span><span class="n">randint</span><span class="p">(</span><span class="mi">20</span><span class="p">,</span> <span class="n">size</span><span class="o">=</span><span class="p">[</span><span class="mi">2</span><span class="p">,</span><span class="mi">5</span><span class="p">])</span>
<span class="n">arr</span>
</code></pre></div></div>

<div class="language-plaintext highlighter-rouge"><div class="highlight"><pre class="highlight"><code>array([[ 9,  4, 15,  0, 17],
       [16, 17,  8,  9,  0]])
</code></pre></div></div>

<h4>Desire output</h4>

<div class="language-python highlighter-rouge"><div class="highlight"><pre class="highlight"><code><span class="c1"># array([[4, 2, 6, 0, 8],
#        [7, 9, 3, 5, 1]])
</span></code></pre></div></div>

<h4>Solution</h4>

<div class="language-python highlighter-rouge"><div class="highlight"><pre class="highlight"><code><span class="n">arr</span><span class="p">.</span><span class="n">ravel</span><span class="p">().</span><span class="n">argsort</span><span class="p">().</span><span class="n">argsort</span><span class="p">().</span><span class="n">reshape</span><span class="p">(</span><span class="n">arr</span><span class="p">.</span><span class="n">shape</span><span class="p">)</span>
</code></pre></div></div>

<div class="language-plaintext highlighter-rouge"><div class="highlight"><pre class="highlight"><code>array([[4, 2, 6, 0, 8],
       [7, 9, 3, 5, 1]])
</code></pre></div></div>

<p>We first flatten the array to a 1D array by using the ravel method, then get the rank just as we did in the previous exercise using two argsort method.</p>

<p>Finally, reshape it to the original array shape using the original array’s shape as the argument.</p>

<h3>Ex 57: How to find the maximum value in each row of a NumPy array 2D</h3>

<p>Q: Compute the maximum for each row in the given array.</p>

<div class="language-python highlighter-rouge"><div class="highlight"><pre class="highlight"><code><span class="n">np</span><span class="p">.</span><span class="n">random</span><span class="p">.</span><span class="n">seed</span><span class="p">(</span><span class="mi">100</span><span class="p">)</span>
<span class="n">the_arr</span> <span class="o">=</span> <span class="n">np</span><span class="p">.</span><span class="n">random</span><span class="p">.</span><span class="n">randint</span><span class="p">(</span><span class="mi">1</span><span class="p">,</span><span class="mi">10</span><span class="p">,</span> <span class="p">[</span><span class="mi">5</span><span class="p">,</span><span class="mi">3</span><span class="p">])</span>
<span class="n">the_arr</span>
</code></pre></div></div>

<div class="language-plaintext highlighter-rouge"><div class="highlight"><pre class="highlight"><code>array([[9, 9, 4],
       [8, 8, 1],
       [5, 3, 6],
       [3, 3, 3],
       [2, 1, 9]])
</code></pre></div></div>

<h4>Desire output</h4>

<div class="language-python highlighter-rouge"><div class="highlight"><pre class="highlight"><code><span class="c1">#array([9, 8, 6, 3, 9])
</span></code></pre></div></div>

<h4>Solution</h4>

<h4>1st Method</h4>

<div class="language-python highlighter-rouge"><div class="highlight"><pre class="highlight"><code><span class="n">the_arr</span><span class="p">.</span><span class="nb">max</span><span class="p">(</span><span class="n">axis</span><span class="o">=</span><span class="mi">1</span><span class="p">)</span>
</code></pre></div></div>

<div class="language-plaintext highlighter-rouge"><div class="highlight"><pre class="highlight"><code>array([9, 8, 6, 3, 9])
</code></pre></div></div>

<p>The first way to solve this question is by using the max method, which returns the highest number in an array. In our case, it is row-wise because we have specified the axis to be 1.</p>

<h4>2nd Method</h4>

<div class="language-python highlighter-rouge"><div class="highlight"><pre class="highlight"><code><span class="n">np</span><span class="p">.</span><span class="n">apply_along_axis</span><span class="p">(</span><span class="n">np</span><span class="p">.</span><span class="nb">max</span><span class="p">,</span><span class="n">axis</span><span class="o">=</span><span class="mi">1</span><span class="p">,</span><span class="n">arr</span><span class="o">=</span><span class="n">the_arr</span><span class="p">)</span>
</code></pre></div></div>

<div class="language-plaintext highlighter-rouge"><div class="highlight"><pre class="highlight"><code>array([9, 8, 6, 3, 9])
</code></pre></div></div>

<p>The second way is to use the apply_along_axis method, which will apply the function passed as an argument to the array row-wise because we set the axis parameter to 1.</p>

<h3>Ex 58: How to compute the min-by-max for each row for a NumPy array 2d</h3>

<p>Q: Compute the min-by-max for each row for a given 2d NumPy array.</p>

<div class="language-python highlighter-rouge"><div class="highlight"><pre class="highlight"><code><span class="n">np</span><span class="p">.</span><span class="n">random</span><span class="p">.</span><span class="n">seed</span><span class="p">(</span><span class="mi">100</span><span class="p">)</span>
<span class="n">the_arr</span> <span class="o">=</span> <span class="n">np</span><span class="p">.</span><span class="n">random</span><span class="p">.</span><span class="n">randint</span><span class="p">(</span><span class="mi">1</span><span class="p">,</span><span class="mi">10</span><span class="p">,</span> <span class="n">size</span><span class="o">=</span><span class="p">[</span><span class="mi">5</span><span class="p">,</span><span class="mi">3</span><span class="p">])</span>
<span class="n">the_arr</span>
</code></pre></div></div>

<div class="language-plaintext highlighter-rouge"><div class="highlight"><pre class="highlight"><code>array([[9, 9, 4],
       [8, 8, 1],
       [5, 3, 6],
       [3, 3, 3],
       [2, 1, 9]])
</code></pre></div></div>

<h4>Desired solution</h4>

<div class="language-python highlighter-rouge"><div class="highlight"><pre class="highlight"><code><span class="c1"># array([0.44444444, 0.125     , 0.5       , 1.        , 0.11111111])
</span></code></pre></div></div>

<h4>Solution</h4>

<h4>1st Method</h4>

<div class="language-python highlighter-rouge"><div class="highlight"><pre class="highlight"><code><span class="n">the_mins</span> <span class="o">=</span> <span class="n">np</span><span class="p">.</span><span class="n">amin</span><span class="p">(</span><span class="n">the_arr</span><span class="p">,</span><span class="n">axis</span><span class="o">=</span><span class="mi">1</span><span class="p">)</span>
<span class="n">the_maxs</span> <span class="o">=</span> <span class="n">np</span><span class="p">.</span><span class="n">amax</span><span class="p">(</span><span class="n">the_arr</span><span class="p">,</span><span class="n">axis</span><span class="o">=</span><span class="mi">1</span><span class="p">)</span>
</code></pre></div></div>

<div class="language-python highlighter-rouge"><div class="highlight"><pre class="highlight"><code><span class="n">the_mins</span>
</code></pre></div></div>

<div class="language-plaintext highlighter-rouge"><div class="highlight"><pre class="highlight"><code>array([4, 1, 3, 3, 1])
</code></pre></div></div>

<div class="language-python highlighter-rouge"><div class="highlight"><pre class="highlight"><code><span class="n">the_maxs</span>
</code></pre></div></div>

<div class="language-plaintext highlighter-rouge"><div class="highlight"><pre class="highlight"><code>array([9, 8, 6, 3, 9])
</code></pre></div></div>

<div class="language-python highlighter-rouge"><div class="highlight"><pre class="highlight"><code><span class="n">the_mins</span> <span class="o">/</span> <span class="n">the_maxs</span>
</code></pre></div></div>

<div class="language-plaintext highlighter-rouge"><div class="highlight"><pre class="highlight"><code>array([0.44444444, 0.125     , 0.5       , 1.        , 0.11111111])
</code></pre></div></div>

<p>The first method is straight forward; we get the minimum and the maximum elements on each row by using the amin and the amax method, pass in the array, and set the axis to 1, which correspond to the row to get back the lowest and highest values in the array.</p>

<p>Then divide the_mins and the_maxs values.</p>

<h4>2nd Method</h4>

<div class="language-python highlighter-rouge"><div class="highlight"><pre class="highlight"><code><span class="n">np</span><span class="p">.</span><span class="n">apply_along_axis</span><span class="p">(</span><span class="k">lambda</span> <span class="n">x</span><span class="p">:</span> <span class="n">np</span><span class="p">.</span><span class="nb">min</span><span class="p">(</span><span class="n">x</span><span class="p">)</span><span class="o">/</span><span class="n">np</span><span class="p">.</span><span class="nb">max</span><span class="p">(</span><span class="n">x</span><span class="p">),</span><span class="n">axis</span><span class="o">=</span><span class="mi">1</span><span class="p">,</span><span class="n">arr</span><span class="o">=</span><span class="n">the_arr</span><span class="p">)</span>
</code></pre></div></div>

<div class="language-plaintext highlighter-rouge"><div class="highlight"><pre class="highlight"><code>array([0.44, 0.12, 0.5 , 1.  , 0.11])
</code></pre></div></div>

<p>The second method is by using the apply_along_axis, pass in a lambda expression, which will return the division of each minimum number by maximum number, then specified that we are dealing with the row by setting axis to 1, then finally pass in the array.</p>

<h3>Ex 59: How to find the duplicate records in a NumPy array</h3>

<p>Q: Find the duplicate entries (2nd occurrence onwards) in the given NumPy array and mark them as True. First time occurrences should be False.</p>

<div class="language-python highlighter-rouge"><div class="highlight"><pre class="highlight"><code><span class="n">np</span><span class="p">.</span><span class="n">random</span><span class="p">.</span><span class="n">seed</span><span class="p">(</span><span class="mi">100</span><span class="p">)</span>
<span class="n">arr</span> <span class="o">=</span> <span class="n">np</span><span class="p">.</span><span class="n">random</span><span class="p">.</span><span class="n">randint</span><span class="p">(</span><span class="mi">0</span><span class="p">,</span> <span class="mi">5</span><span class="p">,</span> <span class="mi">10</span><span class="p">)</span>
<span class="n">arr</span>
</code></pre></div></div>

<div class="language-plaintext highlighter-rouge"><div class="highlight"><pre class="highlight"><code>array([0, 0, 3, 0, 2, 4, 2, 2, 2, 2])
</code></pre></div></div>

<h4>Desire output</h4>

<div class="language-python highlighter-rouge"><div class="highlight"><pre class="highlight"><code><span class="c1"># [False  True False  True False False  True  True  True  True]
</span></code></pre></div></div>

<h4>Solution</h4>

<div class="language-python highlighter-rouge"><div class="highlight"><pre class="highlight"><code><span class="n">all_True</span> <span class="o">=</span> <span class="n">np</span><span class="p">.</span><span class="n">full</span><span class="p">(</span><span class="n">arr</span><span class="p">.</span><span class="n">shape</span><span class="p">[</span><span class="mi">0</span><span class="p">],</span><span class="n">fill_value</span><span class="o">=</span><span class="bp">True</span><span class="p">)</span>
<span class="n">all_True</span>
</code></pre></div></div>

<div class="language-plaintext highlighter-rouge"><div class="highlight"><pre class="highlight"><code>array([ True,  True,  True,  True,  True,  True,  True,  True,  True,
        True])
</code></pre></div></div>

<div class="language-python highlighter-rouge"><div class="highlight"><pre class="highlight"><code><span class="n">unique_pos</span> <span class="o">=</span> <span class="n">np</span><span class="p">.</span><span class="n">unique</span><span class="p">(</span><span class="n">arr</span><span class="p">,</span><span class="n">return_index</span><span class="o">=</span><span class="bp">True</span><span class="p">)[</span><span class="mi">1</span><span class="p">]</span>
<span class="n">unique_pos</span>
</code></pre></div></div>

<div class="language-plaintext highlighter-rouge"><div class="highlight"><pre class="highlight"><code>array([0, 4, 2, 5])
</code></pre></div></div>

<div class="language-python highlighter-rouge"><div class="highlight"><pre class="highlight"><code><span class="n">all_True</span><span class="p">[</span><span class="n">unique_pos</span><span class="p">]</span> <span class="o">=</span> <span class="bp">False</span>
<span class="n">all_True</span>
</code></pre></div></div>

<div class="language-plaintext highlighter-rouge"><div class="highlight"><pre class="highlight"><code>array([False,  True, False,  True, False, False,  True,  True,  True,
        True])
</code></pre></div></div>

<p>As of NumPy version 1.16.4, There is no specific method to perform this task. We have to figure out how to use different means to solve this issue.</p>

<p>We first create an array comprised of only True values using the full method. The number of elements in this newly created array is the same as the number of elements in the original array.</p>

<p>Then we use the unique method to get back the indices (or positions) of each unique (not duplicated) value in the array by setting return_index to True.</p>

<p>Finally, we change all True values in the all_True array at the unique value position by False.</p>

<h3>Ex 60: How to find the grouped mean in NumPy</h3>

<p>Q: Find the mean of sepal width (2nd column) grouped by a categorical column in a 2D NumPy array.</p>

<div class="language-python highlighter-rouge"><div class="highlight"><pre class="highlight"><code><span class="n">url</span> <span class="o">=</span> <span class="s">'https://archive.ics.uci.edu/ml/machine-learning-databases/iris/iris.data'</span>
<span class="n">the_data_2d</span> <span class="o">=</span> <span class="n">np</span><span class="p">.</span><span class="n">genfromtxt</span><span class="p">(</span><span class="n">url</span><span class="p">,</span> <span class="n">delimiter</span><span class="o">=</span><span class="s">','</span><span class="p">,</span> <span class="n">dtype</span><span class="o">=</span><span class="s">'object'</span><span class="p">)</span>
<span class="n">names</span> <span class="o">=</span> <span class="p">(</span><span class="s">'sepallength'</span><span class="p">,</span> <span class="s">'sepalwidth'</span><span class="p">,</span> <span class="s">'petallength'</span><span class="p">,</span> <span class="s">'petalwidth'</span><span class="p">,</span> <span class="s">'species'</span><span class="p">)</span>
</code></pre></div></div>

<h4>Desire output</h4>

<div class="language-python highlighter-rouge"><div class="highlight"><pre class="highlight"><code><span class="c1"># [[b'Iris-setosa', 3.418],
# [b'Iris-versicolor', 2.770],
# [b'Iris-virginica', 2.974]]
</span></code></pre></div></div>

<h4>Solution</h4>

<h4>1st Method: using list comprehension</h4>

<div class="language-python highlighter-rouge"><div class="highlight"><pre class="highlight"><code><span class="n">numerical_column</span> <span class="o">=</span> <span class="n">the_data_2d</span><span class="p">[:,</span><span class="mi">1</span><span class="p">].</span><span class="n">astype</span><span class="p">(</span><span class="s">"float"</span><span class="p">)</span>
<span class="n">species_column</span> <span class="o">=</span> <span class="n">the_data_2d</span><span class="p">[:,</span><span class="mi">4</span><span class="p">]</span>
</code></pre></div></div>

<div class="language-python highlighter-rouge"><div class="highlight"><pre class="highlight"><code><span class="p">[[</span><span class="n">uniques_species</span><span class="p">,</span><span class="n">numerical_column</span><span class="p">[</span><span class="n">species_column</span><span class="o">==</span><span class="n">uniques_species</span><span class="p">].</span><span class="n">mean</span><span class="p">()]</span> <span class="k">for</span> <span class="n">uniques_species</span> <span class="ow">in</span> <span class="n">np</span><span class="p">.</span><span class="n">unique</span><span class="p">(</span><span class="n">species_column</span><span class="p">)]</span>
</code></pre></div></div>

<div class="language-plaintext highlighter-rouge"><div class="highlight"><pre class="highlight"><code>[[b'Iris-setosa', 3.418],
 [b'Iris-versicolor', 2.7700000000000005],
 [b'Iris-virginica', 2.974]]
</code></pre></div></div>

<p>We first get the sepal width column and cast it to float type and then extract the species column. Then we create a list comprehension expression and loop through the unique species in the column, which are Iris-setosa, Iris-versicolor, Iris-virginica.</p>

<p>After the loop, we place the unique species value as the first element in the list, and as the second element, we use indexing to get the mean of the sepal length for each species type by applying the mean function to the numerical_column value where species_column equals uniques_species.</p>

<h4>2nd Method: using for loop</h4>

<div class="language-python highlighter-rouge"><div class="highlight"><pre class="highlight"><code><span class="n">mean_species_grouped</span> <span class="o">=</span> <span class="p">[]</span>
<span class="k">for</span> <span class="n">uniques_species</span> <span class="ow">in</span> <span class="n">np</span><span class="p">.</span><span class="n">unique</span><span class="p">(</span><span class="n">species_column</span><span class="p">):</span>
    <span class="n">mean_species_grouped</span><span class="p">.</span><span class="n">append</span><span class="p">([</span><span class="n">uniques_species</span><span class="p">,</span><span class="n">numerical_column</span><span class="p">[</span><span class="n">species_column</span><span class="o">==</span><span class="n">uniques_species</span><span class="p">].</span><span class="n">mean</span><span class="p">()])</span>
<span class="n">mean_species_grouped</span>
</code></pre></div></div>

<div class="language-plaintext highlighter-rouge"><div class="highlight"><pre class="highlight"><code>[[b'Iris-setosa', 3.418],
 [b'Iris-versicolor', 2.7700000000000005],
 [b'Iris-virginica', 2.974]]
</code></pre></div></div>

<p>Using the loop, it is almost similar to using the list comprehension. The only difference is that we create an empty list, and then we loop through the unique species.</p>

<p>Then append to the empty list the unique species as the first element and as the second element, the mean of sepal length for each unique species just as we did for the list comprehension. Finally, we return the list.</p>

<h3>Ex 61:  How to convert a PIL image to NumPy array</h3>

<p>Q: Import the image from the following URL and convert it to a NumPy array and optionally convert it back to an image.</p>

<div class="language-python highlighter-rouge"><div class="highlight"><pre class="highlight"><code><span class="n">URL</span> <span class="o">=</span> <span class="s">'https://upload.wikimedia.org/wikipedia/commons/8/8b/Denali_Mt_McKinley.jpg'</span>
</code></pre></div></div>

<h4>Desire output</h4>

<div class="language-python highlighter-rouge"><div class="highlight"><pre class="highlight"><code><span class="c1"># array([[[  9,  72, 125],
#         [  9,  72, 125],
#         [  9,  72, 125],
#         ...,
#         [ 42, 103, 147],
#         [ 42, 103, 147],
#         [ 43, 104, 148]],
</span>
<span class="c1">#        [[  9,  72, 125],
#         [  9,  72, 125],
#         [ 10,  73, 126],
#         ...,
#         [ 42, 103, 147],
#         [ 42, 103, 147],
#         [ 43, 104, 148]],
</span>
<span class="c1">#        [[  9,  72, 125],
#         [ 10,  73, 126],
#         [ 10,  73, 126],
#         ...,
#         [ 44, 105, 150],
#         [ 45, 106, 151],
#         [ 45, 106, 151]],
</span>
<span class="c1">#        ...,
</span>
<span class="c1">#        [[ 21,  41,  50],
#         [ 29,  51,  64],
#         [ 28,  54,  69],
#         ...,
#         [ 27,  58,  79],
#         [ 22,  53,  74],
#         [ 19,  47,  69]],
</span>
<span class="c1">#        [[ 27,  51,  63],
#         [ 29,  55,  68],
#         [ 27,  56,  72],
#         ...,
#         [ 33,  70,  97],
#         [ 27,  64,  91],
#         [ 22,  57,  85]],
</span>
<span class="c1">#        [[ 18,  45,  56],
#         [ 20,  48,  62],
#         [ 21,  52,  70],
#         ...,
#         [ 15,  51,  77],
#         [ 12,  48,  74],
#         [ 11,  45,  72]]], dtype=uint8)
</span></code></pre></div></div>

<h4>Solution</h4>

<div class="language-python highlighter-rouge"><div class="highlight"><pre class="highlight"><code><span class="kn">from</span> <span class="nn">io</span> <span class="kn">import</span> <span class="n">BytesIO</span>
<span class="kn">from</span> <span class="nn">PIL</span> <span class="kn">import</span> <span class="n">Image</span>
<span class="kn">import</span> <span class="nn">PIL</span><span class="p">,</span> <span class="n">requests</span>


<span class="n">the_response</span> <span class="o">=</span> <span class="n">requests</span><span class="p">.</span><span class="n">get</span><span class="p">(</span><span class="n">URL</span><span class="p">)</span>
<span class="n">the_image</span> <span class="o">=</span> <span class="n">Image</span><span class="p">.</span><span class="nb">open</span><span class="p">(</span><span class="n">BytesIO</span><span class="p">(</span><span class="n">the_response</span><span class="p">.</span><span class="n">content</span><span class="p">))</span>
</code></pre></div></div>

<div class="language-python highlighter-rouge"><div class="highlight"><pre class="highlight"><code><span class="n">the_image</span>
</code></pre></div></div>

<p><img src="/blog/assets/post_cont_image/output_numpy_ex_61.png" alt="image" /></p>

<div class="language-python highlighter-rouge"><div class="highlight"><pre class="highlight"><code><span class="n">Image_arr</span> <span class="o">=</span> <span class="n">np</span><span class="p">.</span><span class="n">array</span><span class="p">(</span><span class="n">the_image</span><span class="p">)</span>
</code></pre></div></div>

<div class="language-python highlighter-rouge"><div class="highlight"><pre class="highlight"><code><span class="n">Image_arr</span>
</code></pre></div></div>

<div class="language-plaintext highlighter-rouge"><div class="highlight"><pre class="highlight"><code>array([[[  9,  72, 125],
        [  9,  72, 125],
        [  9,  72, 125],
        ...,
        [ 42, 103, 147],
        [ 42, 103, 147],
        [ 43, 104, 148]],

       [[  9,  72, 125],
        [  9,  72, 125],
        [ 10,  73, 126],
        ...,
        [ 42, 103, 147],
        [ 42, 103, 147],
        [ 43, 104, 148]],

       [[  9,  72, 125],
        [ 10,  73, 126],
        [ 10,  73, 126],
        ...,
        [ 44, 105, 150],
        [ 45, 106, 151],
        [ 45, 106, 151]],

       ...,

       [[ 21,  41,  50],
        [ 29,  51,  64],
        [ 28,  54,  69],
        ...,
        [ 27,  58,  79],
        [ 22,  53,  74],
        [ 19,  47,  69]],

       [[ 27,  51,  63],
        [ 29,  55,  68],
        [ 27,  56,  72],
        ...,
        [ 33,  70,  97],
        [ 27,  64,  91],
        [ 22,  57,  85]],

       [[ 18,  45,  56],
        [ 20,  48,  62],
        [ 21,  52,  70],
        ...,
        [ 15,  51,  77],
        [ 12,  48,  74],
        [ 11,  45,  72]]], dtype=uint8)
</code></pre></div></div>

<div class="language-python highlighter-rouge"><div class="highlight"><pre class="highlight"><code><span class="n">the_image_2</span> <span class="o">=</span> <span class="n">PIL</span><span class="p">.</span><span class="n">Image</span><span class="p">.</span><span class="n">fromarray</span><span class="p">(</span><span class="n">Image_arr</span><span class="p">)</span>
</code></pre></div></div>

<div class="language-python highlighter-rouge"><div class="highlight"><pre class="highlight"><code><span class="n">the_image_2</span>
</code></pre></div></div>

<p><img src="/blog/assets/post_cont_image/output_numpy_ex_61.png" alt="image" /></p>

<p>For this example, we are importing a couple of libraries first the PIL (python imagery library), the requests library for making HTTP requests in Python, and finally, the io library for input and output.</p>

<p>We start by getting the response from the URL given of the picture file by using the get method and store it in the_response variable.</p>

<p>To print the image locally, we apply the content method to the response to get the content of the response, then change it into bytes using the BytesIO method and then open it as an image file using Image.open and store it in the the_image variable.</p>

<p>To cast the image to an array, we use the np.array method and pass in the_image variable.</p>

<p>Optionally, to convert back the array to an image file, this time, we use PIL.Image.fromarray method and pass in the Image_arr variable.</p>

<h3>Ex 62: How to drop all missing values from a NumPy array</h3>

<p>Q: Drop all nan values from a 1D numpy array</p>

<div class="language-python highlighter-rouge"><div class="highlight"><pre class="highlight"><code><span class="n">the_arr</span> <span class="o">=</span> <span class="n">np</span><span class="p">.</span><span class="n">array</span><span class="p">([</span><span class="mi">1</span><span class="p">,</span><span class="mi">2</span><span class="p">,</span><span class="mi">3</span><span class="p">,</span><span class="n">np</span><span class="p">.</span><span class="n">nan</span><span class="p">,</span><span class="mi">5</span><span class="p">,</span><span class="mi">6</span><span class="p">,</span><span class="mi">7</span><span class="p">,</span><span class="n">np</span><span class="p">.</span><span class="n">nan</span><span class="p">])</span>
<span class="n">the_arr</span>
</code></pre></div></div>

<div class="language-plaintext highlighter-rouge"><div class="highlight"><pre class="highlight"><code>array([ 1.,  2.,  3., nan,  5.,  6.,  7., nan])
</code></pre></div></div>

<h4>Desired output</h4>

<div class="language-python highlighter-rouge"><div class="highlight"><pre class="highlight"><code><span class="c1"># array([ 1.,  2.,  3.,  5.,  6.,  7.])
</span></code></pre></div></div>

<h4>Solution</h4>

<div class="language-python highlighter-rouge"><div class="highlight"><pre class="highlight"><code><span class="n">the_arr</span><span class="p">[</span><span class="o">~</span><span class="n">np</span><span class="p">.</span><span class="n">isnan</span><span class="p">(</span><span class="n">the_arr</span><span class="p">)]</span>
</code></pre></div></div>

<div class="language-plaintext highlighter-rouge"><div class="highlight"><pre class="highlight"><code>array([1., 2., 3., 5., 6., 7.])
</code></pre></div></div>

<p>np.isnan method will return a boolean array where True is the position of the nan value in the array.</p>

<p>To drop nan values, we are going to use the ~ operator to inverse the boolean array. This time we will get False on the position where nan is found and True on the rest of the positions. It means that if we use indexing on the original array, we will get back only values that are not nan values.</p>

<h3>Ex 63: How to compute the euclidean distance between two arrays</h3>

<p>Q: Compute the Euclidean distance between two arrays a and b</p>

<div class="language-python highlighter-rouge"><div class="highlight"><pre class="highlight"><code><span class="n">a</span> <span class="o">=</span> <span class="n">np</span><span class="p">.</span><span class="n">array</span><span class="p">([</span><span class="mi">1</span><span class="p">,</span><span class="mi">2</span><span class="p">,</span><span class="mi">3</span><span class="p">,</span><span class="mi">4</span><span class="p">,</span><span class="mi">5</span><span class="p">])</span>
<span class="n">b</span> <span class="o">=</span> <span class="n">np</span><span class="p">.</span><span class="n">array</span><span class="p">([</span><span class="mi">4</span><span class="p">,</span><span class="mi">5</span><span class="p">,</span><span class="mi">6</span><span class="p">,</span><span class="mi">7</span><span class="p">,</span><span class="mi">8</span><span class="p">])</span>
</code></pre></div></div>

<h4>Desire output</h4>

<div class="language-python highlighter-rouge"><div class="highlight"><pre class="highlight"><code><span class="c1"># 6.708203932499369
</span></code></pre></div></div>

<h4>Solution</h4>

<div class="language-python highlighter-rouge"><div class="highlight"><pre class="highlight"><code><span class="n">euclidean_dist</span> <span class="o">=</span> <span class="n">np</span><span class="p">.</span><span class="n">linalg</span><span class="p">.</span><span class="n">norm</span><span class="p">(</span><span class="n">a</span><span class="o">-</span><span class="n">b</span><span class="p">,</span><span class="nb">ord</span><span class="o">=</span><span class="mi">2</span><span class="p">)</span>
</code></pre></div></div>

<div class="language-python highlighter-rouge"><div class="highlight"><pre class="highlight"><code><span class="k">print</span><span class="p">(</span><span class="n">euclidean_dist</span><span class="p">)</span>
</code></pre></div></div>

<div class="language-plaintext highlighter-rouge"><div class="highlight"><pre class="highlight"><code>6.708203932499369
</code></pre></div></div>

<p>Theory Behind this exercise is from <a href="https://www.amazon.com/dp/0321321367/" target="_blank">Introduction to Data Mining</a></p>

<p><img src="/blog/assets/post_cont_image/ex63.png" alt="title" /></p>

<p>This function can return one of eight different matrix norms, or one of an infinite number of vector norms (described above), depending on the value of the ord parameter.</p>

<p>It works because Euclidean distance is l2 norm and the value of ord parameter in numpy.linalg.norm method is 2.</p>

<h3>Ex 64: How to find all the local maxima (or peaks) in a 1d array</h3>

<p>Q: Find all the peaks in a 1D NumPy array a. Peaks are points surrounded by smaller values on both sides.</p>

<div class="language-python highlighter-rouge"><div class="highlight"><pre class="highlight"><code><span class="n">a</span> <span class="o">=</span> <span class="n">np</span><span class="p">.</span><span class="n">array</span><span class="p">([</span><span class="mi">1</span><span class="p">,</span> <span class="mi">3</span><span class="p">,</span> <span class="mi">7</span><span class="p">,</span> <span class="mi">1</span><span class="p">,</span> <span class="mi">2</span><span class="p">,</span> <span class="mi">6</span><span class="p">,</span> <span class="mi">0</span><span class="p">,</span> <span class="mi">1</span><span class="p">])</span>
</code></pre></div></div>

<h4>Desire output</h4>

<div class="language-python highlighter-rouge"><div class="highlight"><pre class="highlight"><code><span class="c1"># array([2, 5])
</span></code></pre></div></div>

<h4>Solution</h4>

<div class="language-python highlighter-rouge"><div class="highlight"><pre class="highlight"><code><span class="kn">import</span> <span class="nn">numpy</span> <span class="k">as</span> <span class="n">np</span>
<span class="kn">from</span> <span class="nn">scipy.signal</span> <span class="kn">import</span> <span class="n">argrelextrema</span>

<span class="n">maxInd</span> <span class="o">=</span> <span class="n">argrelextrema</span><span class="p">(</span><span class="n">a</span><span class="p">,</span> <span class="n">np</span><span class="p">.</span><span class="n">greater</span><span class="p">)</span>
</code></pre></div></div>

<div class="language-python highlighter-rouge"><div class="highlight"><pre class="highlight"><code><span class="n">maxInd</span><span class="p">[</span><span class="mi">0</span><span class="p">]</span>
</code></pre></div></div>

<div class="language-plaintext highlighter-rouge"><div class="highlight"><pre class="highlight"><code>array([2, 5])
</code></pre></div></div>

<p>To calculate the extrema of a NumPy array, we use the argrelextrema method (from scipy library) and pass in the array as the first argument and then as the second argument we use the np.greater function which is a function to compare the greatest number along with two elements in the array.</p>

<p>A tuple is returned and used [0] to get back the positions we are looking for.</p>

<h3>Ex 65: How to subtract a 1D array from a 2D array, where each item of 1D array subtracts from respective row</h3>

<p>Q: Subtract the 1D array b_1d from the 2D array a_2d, such that each item (element) of b_1d subtracts from the corresponding element in a row of a_2d.</p>

<div class="language-python highlighter-rouge"><div class="highlight"><pre class="highlight"><code><span class="n">a_2d</span> <span class="o">=</span> <span class="n">np</span><span class="p">.</span><span class="n">array</span><span class="p">([[</span><span class="mi">3</span><span class="p">,</span><span class="mi">3</span><span class="p">,</span><span class="mi">3</span><span class="p">],[</span><span class="mi">4</span><span class="p">,</span><span class="mi">4</span><span class="p">,</span><span class="mi">4</span><span class="p">],[</span><span class="mi">5</span><span class="p">,</span><span class="mi">5</span><span class="p">,</span><span class="mi">5</span><span class="p">]])</span>
<span class="n">b_1d</span> <span class="o">=</span> <span class="n">np</span><span class="p">.</span><span class="n">array</span><span class="p">([</span><span class="mi">1</span><span class="p">,</span><span class="mi">2</span><span class="p">,</span><span class="mi">3</span><span class="p">])</span>
</code></pre></div></div>

<h4>Desire output</h4>

<div class="language-python highlighter-rouge"><div class="highlight"><pre class="highlight"><code><span class="c1"># [[2 2 2]
#  [2 2 2]
#  [2 2 2]]
</span></code></pre></div></div>

<h4>Solution</h4>

<div class="language-python highlighter-rouge"><div class="highlight"><pre class="highlight"><code><span class="n">a_2d</span><span class="p">[:,:]</span> <span class="o">-</span> <span class="n">b_1d</span><span class="p">[:,</span><span class="bp">None</span><span class="p">]</span>
</code></pre></div></div>

<div class="language-plaintext highlighter-rouge"><div class="highlight"><pre class="highlight"><code>array([[2, 2, 2],
       [2, 2, 2],
       [2, 2, 2]])
</code></pre></div></div>

<p>We are taking each item in rows from the 2D array and subtract each item in each row by every element in the 1D array.</p>

<p>So we are taking all the 3s in the first row of the 2D array and subtract them by 1 from the 1D array and the results are placed in a new array, then all the 4s are subtracted by 2 and finally all the 5s by 3.</p>

<p>We will be left with a 2D array only comprised by 2s.</p>

<h3>Ex 66: How to subtract a 1D array from a 2D array, where each item of 2D array subtracts from respective column</h3>

<p>Q: Subtract the 1D array arr_1d from the 2D array arr_2d, such that each item (element) of arr_1d subtracts from the respective element in a column of arr_2d.</p>

<div class="language-python highlighter-rouge"><div class="highlight"><pre class="highlight"><code><span class="n">a_2d</span> <span class="o">=</span> <span class="n">np</span><span class="p">.</span><span class="n">array</span><span class="p">([[</span><span class="mi">3</span><span class="p">,</span><span class="mi">3</span><span class="p">,</span><span class="mi">3</span><span class="p">],[</span><span class="mi">4</span><span class="p">,</span><span class="mi">4</span><span class="p">,</span><span class="mi">4</span><span class="p">],[</span><span class="mi">5</span><span class="p">,</span><span class="mi">5</span><span class="p">,</span><span class="mi">5</span><span class="p">]])</span>
<span class="n">b_1d</span> <span class="o">=</span> <span class="n">np</span><span class="p">.</span><span class="n">array</span><span class="p">([</span><span class="mi">1</span><span class="p">,</span><span class="mi">2</span><span class="p">,</span><span class="mi">3</span><span class="p">])</span>
</code></pre></div></div>

<h4>Desired output</h4>

<div class="language-python highlighter-rouge"><div class="highlight"><pre class="highlight"><code><span class="c1"># array([[2, 1, 0],
#        [3, 2, 1],
#        [4, 3, 2]])
</span></code></pre></div></div>

<h4>Solution</h4>

<div class="language-python highlighter-rouge"><div class="highlight"><pre class="highlight"><code><span class="n">a_2d</span><span class="p">[:,:]</span> <span class="o">-</span> <span class="n">b_1d</span><span class="p">[</span><span class="bp">None</span><span class="p">,:]</span>
</code></pre></div></div>

<div class="language-plaintext highlighter-rouge"><div class="highlight"><pre class="highlight"><code>array([[2, 1, 0],
       [3, 2, 1],
       [4, 3, 2]])
</code></pre></div></div>

<p>This one is similar to the previous one, but the difference is that we are subtracting each item in the 2D array by the corresponding item in the 1D array.</p>

<p>So for the first row in the 2D array, we take 3 and subtract it by 1 from the 1D array, then we take the second 3 and subtract it by 2 in the 1D array and finally we take 3 at the third position and subtract it to 3 in the 1D array. We do the same for the rest of the arrays.</p>

<h3>Ex 67: How to find the index of n’th repetition of an item in an array</h3>

<p>Q: Find the index of 5th repetition of number 1 in x.</p>

<div class="language-python highlighter-rouge"><div class="highlight"><pre class="highlight"><code><span class="n">the_arr</span> <span class="o">=</span> <span class="n">np</span><span class="p">.</span><span class="n">array</span><span class="p">([</span><span class="mi">1</span><span class="p">,</span> <span class="mi">2</span><span class="p">,</span> <span class="mi">1</span><span class="p">,</span> <span class="mi">1</span><span class="p">,</span> <span class="mi">3</span><span class="p">,</span> <span class="mi">4</span><span class="p">,</span> <span class="mi">3</span><span class="p">,</span> <span class="mi">1</span><span class="p">,</span> <span class="mi">1</span><span class="p">,</span> <span class="mi">2</span><span class="p">,</span> <span class="mi">1</span><span class="p">,</span> <span class="mi">1</span><span class="p">,</span> <span class="mi">2</span><span class="p">])</span>
</code></pre></div></div>

<h4>Desire output</h4>

<div class="language-python highlighter-rouge"><div class="highlight"><pre class="highlight"><code><span class="c1"># 10
</span></code></pre></div></div>

<h4>Solution</h4>

<h4>1st Method: NumPy way</h4>

<div class="language-python highlighter-rouge"><div class="highlight"><pre class="highlight"><code><span class="n">rep_pos</span> <span class="o">=</span> <span class="n">np</span><span class="p">.</span><span class="n">where</span><span class="p">(</span><span class="n">the_arr</span><span class="o">==</span><span class="mi">1</span><span class="p">)[</span><span class="mi">0</span><span class="p">]</span>
<span class="n">rep_pos</span><span class="p">[</span><span class="mi">5</span><span class="p">]</span>
</code></pre></div></div>

<div class="language-plaintext highlighter-rouge"><div class="highlight"><pre class="highlight"><code>10
</code></pre></div></div>

<p>We use the where method to get the position of all the 1s in the array by using the condition the_arr == 1. We get back a tuple that is why we used [0] to select the first argument.</p>

<p>To select the 5th repetition of 1, we then use indexing on the array.</p>

<h4>2nd Method: Pythonic way</h4>

<div class="language-python highlighter-rouge"><div class="highlight"><pre class="highlight"><code><span class="n">tuple_pos_repeated</span> <span class="o">=</span> <span class="p">[</span><span class="n">i</span> <span class="k">for</span> <span class="n">i</span> <span class="ow">in</span> <span class="nb">enumerate</span><span class="p">(</span><span class="n">the_arr</span><span class="p">)</span> <span class="k">if</span> <span class="n">i</span><span class="p">[</span><span class="mi">1</span><span class="p">]</span> <span class="o">==</span> <span class="mi">1</span><span class="p">]</span>
<span class="n">tuple_pos_repeated</span>
</code></pre></div></div>

<div class="language-plaintext highlighter-rouge"><div class="highlight"><pre class="highlight"><code>[(0, 1), (2, 1), (3, 1), (7, 1), (8, 1), (10, 1), (11, 1)]
</code></pre></div></div>

<div class="language-python highlighter-rouge"><div class="highlight"><pre class="highlight"><code><span class="n">tuple_pos_repeated</span><span class="p">[</span><span class="mi">5</span><span class="p">][</span><span class="mi">0</span><span class="p">]</span>
</code></pre></div></div>

<div class="language-plaintext highlighter-rouge"><div class="highlight"><pre class="highlight"><code>10
</code></pre></div></div>

<p>The second way to approach this problem is by using list comprehension. We use the for loop and enumerate function to traverse the array and then use an if statement to only extract elements equal to 1. if you want to refresh your mind about loops and list comprehension, please read more <a href="https://semasuka.github.io/blog/2019/02/03/control-flow-part-2.html" target="_blank">here</a>.</p>

<p>Now that we have a tuple of all the positions of number 1 in the array, we can proceed by using indexing on tuple by using[5] to get the 5th repetition of 1 and then indexing again by adding [0] to get only the position we are looking for.</p>

<h3>Ex 68: How to convert NumPy’s datetime64 object to datetime’s datetime object</h3>

<p>Q: Convert NumPy’s datetime64 object to datetime’s datetime object</p>

<div class="language-python highlighter-rouge"><div class="highlight"><pre class="highlight"><code><span class="n">dt64</span> <span class="o">=</span> <span class="n">np</span><span class="p">.</span><span class="n">datetime64</span><span class="p">(</span><span class="s">'2018-02-25 22:10:10'</span><span class="p">)</span>
<span class="n">dt64</span><span class="p">.</span><span class="n">astype</span><span class="p">(</span><span class="nb">int</span><span class="p">)</span>
</code></pre></div></div>

<div class="language-plaintext highlighter-rouge"><div class="highlight"><pre class="highlight"><code>1519596610
</code></pre></div></div>

<h4>Desired output</h4>

<div class="language-python highlighter-rouge"><div class="highlight"><pre class="highlight"><code><span class="c1"># datetime.datetime(2018, 2, 25, 22, 10, 10)
</span></code></pre></div></div>

<h4>Solution</h4>

<div class="language-python highlighter-rouge"><div class="highlight"><pre class="highlight"><code><span class="kn">from</span> <span class="nn">datetime</span> <span class="kn">import</span> <span class="n">datetime</span>
<span class="n">datetime</span><span class="p">.</span><span class="n">utcfromtimestamp</span><span class="p">(</span><span class="n">dt64</span><span class="p">.</span><span class="n">astype</span><span class="p">(</span><span class="nb">int</span><span class="p">))</span>
</code></pre></div></div>

<div class="language-plaintext highlighter-rouge"><div class="highlight"><pre class="highlight"><code>datetime.datetime(2018, 2, 25, 22, 10, 10)
</code></pre></div></div>

<p>We first import the datetime function from the datetime module, then pass the Numpy datetime object (converted into int type) which returns the UTC datetime object. Yeah, it is that simple!</p>

<h3>Ex 69: How to compute the moving average of a NumPy array?</h3>

<p>Q: Compute the moving average of window size 3, for the given a random 1D array.</p>

<div class="language-python highlighter-rouge"><div class="highlight"><pre class="highlight"><code><span class="n">np</span><span class="p">.</span><span class="n">random</span><span class="p">.</span><span class="n">seed</span><span class="p">(</span><span class="mi">100</span><span class="p">)</span>
<span class="n">oneD_arr</span> <span class="o">=</span> <span class="n">np</span><span class="p">.</span><span class="n">random</span><span class="p">.</span><span class="n">randint</span><span class="p">(</span><span class="mi">10</span><span class="p">,</span> <span class="n">size</span><span class="o">=</span><span class="mi">10</span><span class="p">)</span>
<span class="n">oneD_arr</span>
</code></pre></div></div>

<div class="language-plaintext highlighter-rouge"><div class="highlight"><pre class="highlight"><code>array([8, 8, 3, 7, 7, 0, 4, 2, 5, 2])
</code></pre></div></div>

<h4>Desire output</h4>

<div class="language-python highlighter-rouge"><div class="highlight"><pre class="highlight"><code><span class="c1"># moving average:  [ 6.33  6.    5.67  4.67  3.67  2.    3.67  3.  ]
</span></code></pre></div></div>

<h4>Solution</h4>

<div class="language-python highlighter-rouge"><div class="highlight"><pre class="highlight"><code><span class="n">np</span><span class="p">.</span><span class="n">set_printoptions</span><span class="p">(</span><span class="n">precision</span><span class="o">=</span><span class="mi">2</span><span class="p">)</span>
<span class="k">def</span> <span class="nf">moving_average</span><span class="p">(</span><span class="n">arr</span><span class="p">,</span><span class="n">w</span><span class="o">=</span><span class="mi">3</span><span class="p">):</span>
    <span class="n">accum_arr</span> <span class="o">=</span> <span class="n">np</span><span class="p">.</span><span class="n">cumsum</span><span class="p">(</span><span class="n">arr</span><span class="p">,</span> <span class="n">dtype</span><span class="o">=</span><span class="nb">float</span><span class="p">)</span>
    <span class="n">accum_arr</span><span class="p">[</span><span class="n">w</span><span class="p">:]</span> <span class="o">=</span> <span class="n">accum_arr</span><span class="p">[</span><span class="n">w</span><span class="p">:]</span> <span class="o">-</span> <span class="n">accum_arr</span><span class="p">[:</span><span class="o">-</span><span class="n">w</span><span class="p">]</span>
    <span class="k">return</span> <span class="n">accum_arr</span><span class="p">[</span><span class="n">w</span><span class="o">-</span><span class="mi">1</span><span class="p">:]</span><span class="o">/</span><span class="n">w</span>
<span class="n">moving_average</span><span class="p">(</span><span class="n">oneD_arr</span><span class="p">)</span>
</code></pre></div></div>

<div class="language-plaintext highlighter-rouge"><div class="highlight"><pre class="highlight"><code>array([6.33, 6.  , 5.67, 4.67, 3.67, 2.  , 3.67, 3.  ])
</code></pre></div></div>

<p>To calculate the moving average of a set of data at a particular window, we first create a function that takes in the array itself and then set the window w by default to 3. Then we calculate the cumulative sum of the elements in the array, which in this case will be all the elements in the row axis since we only have a 1D array.</p>

<p>Now comes the fun part! we subtract each element in the accum_arr starting from index 4 (which correspond to window 3 of the moving average) by each element in another accum_arr array, this time ending at the 4th last element inclusive. The result is assigned to accum_arr starting from index 4.</p>

<p>Finally, we take the previous array this time starting from index 3(w-1) and we divide all the elements in that array by the window 3 to finally get the moving average of window 3 of that array.</p>

<p>These steps above are from the formula to compute the moving average of a NumPy. Please refer <a href="https://en.wikipedia.org/wiki/Moving_average" target="_blank">this Wikipedia page</a> for more information. Refer <a href="https://stackoverflow.com/questions/14313510/how-to-calculate-moving-average-using-numpy" target="_blank">to this link</a> on StackOverflow where this exercise is inspired from.</p>

<h3>Ex 70: How to create a NumPy array sequence given only the starting point, length and the step?</h3>

<p>Q: Create a NumPy array of length 10, starting from 5 and has a step of 3 between consecutive numbers</p>

<div class="language-python highlighter-rouge"><div class="highlight"><pre class="highlight"><code><span class="n">start_num</span> <span class="o">=</span> <span class="mi">5</span>
<span class="n">step_num</span> <span class="o">=</span> <span class="mi">3</span>
<span class="n">size_num</span> <span class="o">=</span> <span class="mi">10</span>
</code></pre></div></div>

<h4>Desire output</h4>

<div class="language-python highlighter-rouge"><div class="highlight"><pre class="highlight"><code><span class="c1"># array([ 5,  8, 11, 14, 17, 20, 23, 26, 29, 32])
</span></code></pre></div></div>

<h4>Solution</h4>

<div class="language-python highlighter-rouge"><div class="highlight"><pre class="highlight"><code><span class="n">start_num</span> <span class="o">=</span> <span class="mi">5</span>
<span class="n">step_num</span> <span class="o">=</span> <span class="mi">3</span>
<span class="n">size_num</span> <span class="o">=</span> <span class="mi">10</span>

<span class="k">def</span> <span class="nf">seq</span><span class="p">(</span><span class="n">start</span><span class="p">,</span><span class="n">step</span><span class="p">,</span><span class="n">size</span><span class="p">):</span>
    <span class="n">stop</span> <span class="o">=</span> <span class="n">start</span> <span class="o">+</span> <span class="p">(</span><span class="n">size</span><span class="o">*</span><span class="n">step</span><span class="p">)</span>
    <span class="k">return</span> <span class="n">np</span><span class="p">.</span><span class="n">arange</span><span class="p">(</span><span class="n">start</span><span class="p">,</span><span class="n">stop</span><span class="p">,</span><span class="n">step</span><span class="p">)</span>
<span class="n">seq</span><span class="p">(</span><span class="n">start_num</span><span class="p">,</span><span class="n">step_num</span><span class="p">,</span><span class="n">size_num</span><span class="p">)</span>
</code></pre></div></div>

<div class="language-plaintext highlighter-rouge"><div class="highlight"><pre class="highlight"><code>array([ 5,  8, 11, 14, 17, 20, 23, 26, 29, 32])
</code></pre></div></div>

<p>This is an interesting exercise because we have the length of the array, the start and the step. To use the arange method on the NumPy variable, we need the start, stop and step. In this case, we are missing the stop value.
So to get the stop, we can use the size, the step and the start.</p>

<p>That is what we did by creating a new function that takes as parameter the start, the step and the size. To calculate the stop, we add the start and the product of the size and the step.</p>

<p>Then returned the np.arange method with the start, the previously calculated stop and the step.</p>

<h3>Ex 71: How to fill in missing dates in an irregular series of NumPy dates?</h3>

<p>Q: Given an array of a non-continuous sequence of dates. Make it a continuous sequence of dates, by filling in the missing dates.</p>

<div class="language-python highlighter-rouge"><div class="highlight"><pre class="highlight"><code><span class="n">dates</span> <span class="o">=</span> <span class="n">np</span><span class="p">.</span><span class="n">arange</span><span class="p">(</span><span class="n">np</span><span class="p">.</span><span class="n">datetime64</span><span class="p">(</span><span class="s">'2018-02-01'</span><span class="p">),</span> <span class="n">np</span><span class="p">.</span><span class="n">datetime64</span><span class="p">(</span><span class="s">'2018-02-25'</span><span class="p">),</span> <span class="mi">2</span><span class="p">)</span>
<span class="n">dates</span>
</code></pre></div></div>

<div class="language-plaintext highlighter-rouge"><div class="highlight"><pre class="highlight"><code>array(['2018-02-01', '2018-02-03', '2018-02-05', '2018-02-07',
       '2018-02-09', '2018-02-11', '2018-02-13', '2018-02-15',
       '2018-02-17', '2018-02-19', '2018-02-21', '2018-02-23'],
      dtype='datetime64[D]')
</code></pre></div></div>

<h4>Desire output</h4>

<div class="language-python highlighter-rouge"><div class="highlight"><pre class="highlight"><code><span class="c1"># array(['2018-02-01', '2018-02-02', '2018-02-03', '2018-02-04',
#        '2018-02-05', '2018-02-06', '2018-02-07', '2018-02-08',
#        '2018-02-09', '2018-02-10', '2018-02-11', '2018-02-12',
#        '2018-02-13', '2018-02-14', '2018-02-15', '2018-02-16',
#        '2018-02-17', '2018-02-18', '2018-02-19', '2018-02-20',
#        '2018-02-21', '2018-02-22', '2018-02-23'], dtype='datetime64[D]')
</span></code></pre></div></div>

<h4>Solution</h4>

<h4>1st Method: using list comprehension</h4>

<div class="language-python highlighter-rouge"><div class="highlight"><pre class="highlight"><code><span class="n">cont_no_last_date</span> <span class="o">=</span> <span class="n">np</span><span class="p">.</span><span class="n">array</span><span class="p">([</span><span class="n">np</span><span class="p">.</span><span class="n">arange</span><span class="p">(</span><span class="n">date</span><span class="p">,(</span><span class="n">date</span><span class="o">+</span><span class="n">d</span><span class="p">))</span> <span class="k">for</span> <span class="n">date</span><span class="p">,</span><span class="n">d</span> <span class="ow">in</span> <span class="nb">zip</span><span class="p">(</span><span class="n">dates</span><span class="p">,</span> <span class="n">np</span><span class="p">.</span><span class="n">diff</span><span class="p">(</span><span class="n">dates</span><span class="p">))]).</span><span class="n">reshape</span><span class="p">(</span><span class="o">-</span><span class="mi">1</span><span class="p">)</span>
</code></pre></div></div>

<div class="language-python highlighter-rouge"><div class="highlight"><pre class="highlight"><code><span class="n">cont_with_last_date</span> <span class="o">=</span> <span class="n">np</span><span class="p">.</span><span class="n">hstack</span><span class="p">((</span><span class="n">cont_no_last_date</span><span class="p">,</span><span class="n">dates</span><span class="p">[</span><span class="o">-</span><span class="mi">1</span><span class="p">]))</span>
<span class="n">cont_with_last_date</span>
</code></pre></div></div>

<div class="language-plaintext highlighter-rouge"><div class="highlight"><pre class="highlight"><code>array(['2018-02-01', '2018-02-02', '2018-02-03', '2018-02-04',
       '2018-02-05', '2018-02-06', '2018-02-07', '2018-02-08',
       '2018-02-09', '2018-02-10', '2018-02-11', '2018-02-12',
       '2018-02-13', '2018-02-14', '2018-02-15', '2018-02-16',
       '2018-02-17', '2018-02-18', '2018-02-19', '2018-02-20',
       '2018-02-21', '2018-02-22', '2018-02-23'], dtype='datetime64[D]')
</code></pre></div></div>

<p>One of the ways to go about solving this issue is to use the list comprehension, we first loop through each date and the difference between those dates d (which is 2) and create a NumPy range starting from the date to a new date found using date + d and place those dates in an array. we end up with a continuous range of dates from ‘2018-02-01’ to ‘2018-02-22’ (notice how it is not ‘2018-02-23’) and reshape it using -1 which means that it is an unknown dimension and we want NumPy to figure out the correct dimension to use.</p>

<p>Now we need to add the last date by stacking it horizontally (column-wise) using the hstack function to cont_no_last_date and pass in the last date using indexing -1.</p>

<h4>2nd Method: using for loop</h4>

<div class="language-python highlighter-rouge"><div class="highlight"><pre class="highlight"><code><span class="n">cont_no_last_date</span> <span class="o">=</span> <span class="p">[]</span>
<span class="k">for</span> <span class="n">date</span><span class="p">,</span><span class="n">d</span> <span class="ow">in</span> <span class="nb">zip</span><span class="p">(</span><span class="n">dates</span><span class="p">,</span> <span class="n">np</span><span class="p">.</span><span class="n">diff</span><span class="p">(</span><span class="n">dates</span><span class="p">)):</span>
    <span class="n">cont_no_last_date</span><span class="p">.</span><span class="n">append</span><span class="p">(</span><span class="n">np</span><span class="p">.</span><span class="n">arange</span><span class="p">(</span><span class="n">date</span><span class="p">,</span><span class="n">date</span><span class="o">+</span><span class="n">d</span><span class="p">))</span>
<span class="n">cont_no_last_date</span> <span class="o">=</span> <span class="n">np</span><span class="p">.</span><span class="n">array</span><span class="p">(</span><span class="n">cont_no_last_date</span><span class="p">).</span><span class="n">reshape</span><span class="p">(</span><span class="o">-</span><span class="mi">1</span><span class="p">)</span>
</code></pre></div></div>

<div class="language-python highlighter-rouge"><div class="highlight"><pre class="highlight"><code><span class="n">cont_with_last_date</span> <span class="o">=</span> <span class="n">np</span><span class="p">.</span><span class="n">hstack</span><span class="p">((</span><span class="n">cont_no_last_date</span><span class="p">,</span><span class="n">dates</span><span class="p">[</span><span class="o">-</span><span class="mi">1</span><span class="p">]))</span>
<span class="n">cont_with_last_date</span>
</code></pre></div></div>

<div class="language-plaintext highlighter-rouge"><div class="highlight"><pre class="highlight"><code>array(['2018-02-01', '2018-02-02', '2018-02-03', '2018-02-04',
       '2018-02-05', '2018-02-06', '2018-02-07', '2018-02-08',
       '2018-02-09', '2018-02-10', '2018-02-11', '2018-02-12',
       '2018-02-13', '2018-02-14', '2018-02-15', '2018-02-16',
       '2018-02-17', '2018-02-18', '2018-02-19', '2018-02-20',
       '2018-02-21', '2018-02-22', '2018-02-23'], dtype='datetime64[D]')
</code></pre></div></div>

<p>The second way to approach this problem is by using the for loop statement. we first create an empty list and then loop through the dates and d value from zip method of the dates and the difference between the dates. Then inside the loop, we append the rage from the date to the date + d just as we did for the list comprehension.</p>

<p>After the loop, we cast the list to an array, reshape and assign it to the cont_no_last_date value. Then we add the last date just as we did for the list comprehension method.</p>

<h3>Ex 72: How to create strides from a given 1D array?</h3>

<p>Q: From the given 1D array arr, generate a 2D matrix using strides, with a window length of 4 and strides of 2, like [[0,1,2,3], [2,3,4,5], [4,5,6,7]..]</p>

<div class="language-python highlighter-rouge"><div class="highlight"><pre class="highlight"><code><span class="n">arr</span> <span class="o">=</span> <span class="n">np</span><span class="p">.</span><span class="n">arange</span><span class="p">(</span><span class="mi">15</span><span class="p">)</span> 
<span class="n">arr</span>
</code></pre></div></div>

<div class="language-plaintext highlighter-rouge"><div class="highlight"><pre class="highlight"><code>array([ 0,  1,  2,  3,  4,  5,  6,  7,  8,  9, 10, 11, 12, 13, 14])
</code></pre></div></div>

<h4>Desire output</h4>

<div class="language-python highlighter-rouge"><div class="highlight"><pre class="highlight"><code><span class="c1"># [[ 0  1  2  3]
#  [ 2  3  4  5]
#  [ 4  5  6  7]
#  [ 6  7  8  9]
#  [ 8  9 10 11]
#  [10 11 12 13]]
</span></code></pre></div></div>

<h4>Solution</h4>

<div class="language-python highlighter-rouge"><div class="highlight"><pre class="highlight"><code><span class="k">def</span> <span class="nf">gen_strides</span><span class="p">(</span><span class="n">arr</span><span class="p">,</span> <span class="n">stride_len</span><span class="o">=</span><span class="mi">2</span><span class="p">,</span> <span class="n">window_len</span><span class="o">=</span><span class="mi">4</span><span class="p">):</span>
    <span class="n">n_strides</span> <span class="o">=</span> <span class="p">((</span><span class="n">arr</span><span class="p">.</span><span class="n">size</span> <span class="o">-</span> <span class="n">window_len</span><span class="p">)</span><span class="o">//</span><span class="n">stride_len</span><span class="p">)</span> <span class="o">+</span> <span class="mi">1</span>
    <span class="c1"># n_strides = 6
</span>    <span class="k">print</span><span class="p">(</span><span class="n">stride_len</span><span class="p">)</span>
    <span class="k">return</span> <span class="n">np</span><span class="p">.</span><span class="n">array</span><span class="p">([</span><span class="n">arr</span><span class="p">[</span><span class="n">s</span><span class="p">:(</span><span class="n">s</span><span class="o">+</span><span class="n">window_len</span><span class="p">)]</span> <span class="k">for</span> <span class="n">s</span> <span class="ow">in</span> <span class="n">np</span><span class="p">.</span><span class="n">arange</span><span class="p">(</span><span class="mi">0</span><span class="p">,</span><span class="n">n_strides</span><span class="o">*</span><span class="n">stride_len</span><span class="p">,</span><span class="n">stride_len</span><span class="p">)])</span>
<span class="n">gen_strides</span><span class="p">(</span><span class="n">arr</span><span class="p">)</span>
</code></pre></div></div>

<div class="language-plaintext highlighter-rouge"><div class="highlight"><pre class="highlight"><code>2


array([[ 0,  1,  2,  3],
       [ 2,  3,  4,  5],
       [ 4,  5,  6,  7],
       [ 6,  7,  8,  9],
       [ 8,  9, 10, 11],
       [10, 11, 12, 13]])
</code></pre></div></div>

<p>We first create a function that takes in the array, set the stride length to 2 and then window length to 4. Then we calculate the n_strides value by subtracting the array size to window_len and then dividing it (using floor division or integer division) by stride_len and adding 1 to it.</p>

<p>Finally, we create a list comprehension that goes through a range from 0 to 12 (n_strides * stride_len) by stepping by 2 using s value which corresponds to the 6 lists that we are creating. We use indexing on the arr with the starting position s and the last element s + window_len in each of the 6 lists. At last, we place the 6 strides lists in an array.</p>

<h3>Conclusion</h3>

<p>There you go! 72 exercise on NumPy to solidify your understanding of NumPy. I can guaranty that if you completed all these exercises you are more than ready to start using NumPy in an end-to-end Machine Learning project.</p>

<p>The next post will be an introduction to one of my favorite Machine learning libraries, pandas Library for tabular data manipulation. Stay tuned and don’t forget to subscribe to get notified for the next post.</p>

<p>Find the jupyter notebook version of this post on my GitHub profile <a href="https://github.com/semasuka/blog/blob/gh-pages/ipynb/NumPy%20Exercises%20Part%203.ipynb" target="_blank">here.</a></p>

<p>Thank you again for doing these exercises with me. I hope you have learned one or two things. If you like this post, please subscribe to stay updated with new posts, and if you have a thought or a question, I would love to hear it by commenting below. Remember keep learning!</p>]]></content><author><name>Stern Semasuka</name></author><category term="python" /><category term="exercises" /><category term="numpy" /><summary type="html"><![CDATA[Welcome back, folks! This post is the last in the series of NumPy exercises. In this post, we will see intermediate and advanced level exercises. Remember, the more you practice, the more you will understand NumPy and will use it with ease in your ML projects.]]></summary><media:thumbnail xmlns:media="http://search.yahoo.com/mrss/" url="https://semasuka.github.io/blog/blog/assets/post_images/numpy.png" /><media:content medium="image" url="https://semasuka.github.io/blog/blog/assets/post_images/numpy.png" xmlns:media="http://search.yahoo.com/mrss/" /></entry><entry><title type="html">NumPy Exercises Part 2</title><link href="https://semasuka.github.io/blog/blog/2019/09/04/numpy-exercises-part-2.html" rel="alternate" type="text/html" title="NumPy Exercises Part 2" /><published>2019-09-04T00:00:00+00:00</published><updated>2019-09-04T00:00:00+00:00</updated><id>https://semasuka.github.io/blog/blog/2019/09/04/numpy-exercises-part-2</id><content type="html" xml:base="https://semasuka.github.io/blog/blog/2019/09/04/numpy-exercises-part-2.html"><![CDATA[<p>For this second post of NumPy exercises series, we will be doing intermediate level exercises in NumPy and will go through the solution together as we did in the first part. Try to solve the exercises on your own then compare your answer with mine. Let’s get started.<!-- more --></p>

<p>We first import the NumPy.</p>

<div class="language-python highlighter-rouge"><div class="highlight"><pre class="highlight"><code><span class="kn">import</span> <span class="nn">numpy</span> <span class="k">as</span> <span class="n">np</span>
</code></pre></div></div>

<h3>Ex 21: Create a two-dimensional array containing random floats between 5 and 10</h3>

<p>Q: Let’s create a two-dimensional array with a shape of 5x3 that contain random decimal between 5 and 10.</p>

<h4>Desire output</h4>

<div class="language-python highlighter-rouge"><div class="highlight"><pre class="highlight"><code><span class="c1"># Of course the numbers in the array will not be the same as mine, but your solution should have a similar format.
# [[9.60743436 9.93159453 5.13512998]
#  [9.12587012 9.52496391 5.38363015]
#  [6.78095565 9.78322155 8.06633546]
#  [6.52216894 9.34490397 7.42139115]
#  [7.22697926 8.63126859 7.72817642]]
</span></code></pre></div></div>

<h4>Solution</h4>

<h4>1st Method</h4>

<div class="language-python highlighter-rouge"><div class="highlight"><pre class="highlight"><code><span class="n">my_array</span> <span class="o">=</span> <span class="n">np</span><span class="p">.</span><span class="n">random</span><span class="p">.</span><span class="n">uniform</span><span class="p">(</span><span class="n">low</span><span class="o">=</span><span class="mi">5</span><span class="p">,</span><span class="n">high</span><span class="o">=</span><span class="mi">10</span><span class="p">,</span><span class="n">size</span><span class="o">=</span><span class="mi">15</span><span class="p">)</span>
<span class="n">resh_array</span> <span class="o">=</span> <span class="n">my_array</span><span class="p">.</span><span class="n">reshape</span><span class="p">(</span><span class="mi">5</span><span class="p">,</span><span class="o">-</span><span class="mi">1</span><span class="p">)</span>
</code></pre></div></div>

<div class="language-python highlighter-rouge"><div class="highlight"><pre class="highlight"><code><span class="k">print</span><span class="p">(</span><span class="n">resh_array</span><span class="p">)</span>
</code></pre></div></div>

<div class="language-plaintext highlighter-rouge"><div class="highlight"><pre class="highlight"><code>[[9.60743436 9.93159453 5.13512998]
 [9.12587012 9.52496391 5.38363015]
 [6.78095565 9.78322155 8.06633546]
 [6.52216894 9.34490397 7.42139115]
 [7.22697926 8.63126859 7.72817642]]
</code></pre></div></div>

<p>We use the uniform method on the random NumPy method and pass the lowest number, then the highest and finally the size.</p>

<p>Then use the reshape method to change it from a one-dimensional array to a two-dimensional array.</p>

<h4>2nd Method</h4>

<div class="language-python highlighter-rouge"><div class="highlight"><pre class="highlight"><code><span class="n">my_array</span> <span class="o">=</span> <span class="n">np</span><span class="p">.</span><span class="n">random</span><span class="p">.</span><span class="n">randint</span><span class="p">(</span><span class="n">low</span><span class="o">=</span><span class="mi">5</span><span class="p">,</span><span class="n">high</span><span class="o">=</span><span class="mi">10</span><span class="p">,</span><span class="n">size</span><span class="o">=</span><span class="p">(</span><span class="mi">5</span><span class="p">,</span><span class="mi">3</span><span class="p">))</span> <span class="o">+</span> <span class="n">np</span><span class="p">.</span><span class="n">random</span><span class="p">.</span><span class="n">random</span><span class="p">((</span><span class="mi">5</span><span class="p">,</span><span class="mi">3</span><span class="p">))</span>
</code></pre></div></div>

<div class="language-python highlighter-rouge"><div class="highlight"><pre class="highlight"><code><span class="k">print</span><span class="p">(</span><span class="n">my_array</span><span class="p">)</span>
</code></pre></div></div>

<div class="language-plaintext highlighter-rouge"><div class="highlight"><pre class="highlight"><code>[9.60743436 9.93159453 5.13512998 9.12587012 9.52496391 5.38363015
 6.78095565 9.78322155 8.06633546 6.52216894 9.34490397 7.42139115
 7.22697926 8.63126859 7.72817642]
</code></pre></div></div>

<p>We can achieve the same result by randomly generating integers using the randint method then concatenate (using addition) with randomly generated decimal parts to finally get a number (formed from the random integer and decimal) which is placed in a variable.</p>

<p>Note: The shape of the two arrays concatenated must be the same.</p>

<h3>Ex 22: Print only one decimal place in an array</h3>

<p>Q: Print the numbers in the array with only one decimal places.</p>

<div class="language-python highlighter-rouge"><div class="highlight"><pre class="highlight"><code><span class="n">my_array</span> <span class="o">=</span> <span class="n">np</span><span class="p">.</span><span class="n">random</span><span class="p">.</span><span class="n">rand</span><span class="p">(</span><span class="mi">3</span><span class="p">)</span>
</code></pre></div></div>

<div class="language-python highlighter-rouge"><div class="highlight"><pre class="highlight"><code><span class="k">print</span><span class="p">(</span><span class="n">my_array</span><span class="p">)</span>
</code></pre></div></div>

<div class="language-plaintext highlighter-rouge"><div class="highlight"><pre class="highlight"><code>[0.42306537 0.2529142  0.57457565]
</code></pre></div></div>

<h4>Desire output</h4>

<div class="language-python highlighter-rouge"><div class="highlight"><pre class="highlight"><code><span class="c1"># Of course the numbers in the array will not be the same as mine, but your solution should have a similar format.
#[0.4 0.3 0.6]
</span></code></pre></div></div>

<h4>Solution</h4>

<h4>1st Method</h4>

<div class="language-python highlighter-rouge"><div class="highlight"><pre class="highlight"><code><span class="n">my_array_decimal_place</span> <span class="o">=</span> <span class="n">np</span><span class="p">.</span><span class="n">around</span><span class="p">(</span><span class="n">my_array</span><span class="p">,</span><span class="n">decimals</span><span class="o">=</span><span class="mi">1</span><span class="p">)</span>
</code></pre></div></div>

<div class="language-python highlighter-rouge"><div class="highlight"><pre class="highlight"><code><span class="k">print</span><span class="p">(</span><span class="n">my_array_decimal_place</span><span class="p">)</span>
</code></pre></div></div>

<div class="language-plaintext highlighter-rouge"><div class="highlight"><pre class="highlight"><code>[0.4 0.3 0.6]
</code></pre></div></div>

<p>We use the around method, pass as arguments the array itself and the decimal place. In our case, it is 1.</p>

<h4>2nd Method</h4>

<div class="language-python highlighter-rouge"><div class="highlight"><pre class="highlight"><code><span class="n">np</span><span class="p">.</span><span class="n">set_printoptions</span><span class="p">(</span><span class="n">precision</span><span class="o">=</span><span class="mi">1</span><span class="p">)</span>
<span class="k">print</span><span class="p">(</span><span class="n">my_array</span><span class="p">)</span>
</code></pre></div></div>

<div class="language-plaintext highlighter-rouge"><div class="highlight"><pre class="highlight"><code>[0.4 0.3 0.6]
</code></pre></div></div>

<p>We can also set to 1 the precision argument in the set_printoptions method to the same results.</p>

<p>Note: changing any argument in the set_printoption method affect all the notebook, which means that in our case, all the decimals in all the remaining cells will be printed with one decimal place.  It is crucial to keep this in mind.</p>

<h3>Ex 23: Remove the exponential notation in an array</h3>

<p>Q: In this exercise, we want to change the elements written using the exponential scientific notation, to decimal notation.</p>

<div class="language-python highlighter-rouge"><div class="highlight"><pre class="highlight"><code><span class="n">my_array</span> <span class="o">=</span> <span class="n">np</span><span class="p">.</span><span class="n">random</span><span class="p">.</span><span class="n">rand</span><span class="p">(</span><span class="mi">16</span><span class="p">)</span><span class="o">/</span><span class="mf">1.34e4</span>
</code></pre></div></div>

<div class="language-python highlighter-rouge"><div class="highlight"><pre class="highlight"><code><span class="k">print</span><span class="p">(</span><span class="n">my_array</span><span class="p">)</span>
</code></pre></div></div>

<div class="language-plaintext highlighter-rouge"><div class="highlight"><pre class="highlight"><code>[5.315786434e-05 6.261432178e-05 1.816219472e-05 6.605228344e-05
 5.613819546e-05 6.026712672e-05 1.729978859e-05 8.851793521e-06
 1.456005418e-05 5.940398704e-05 3.211098305e-05 7.301915937e-05
 3.377834308e-05 6.710361776e-05 4.399697976e-05 1.909041117e-06]
</code></pre></div></div>

<h4>Desire output</h4>

<div class="language-python highlighter-rouge"><div class="highlight"><pre class="highlight"><code><span class="c1"># Of course the numbers in the array will not be the same as mine, but your solution should have a similar format.
# array([0.000053158, 0.000062614, 0.000018162, 0.000066052, 0.000056138,
#        0.000060267, 0.0000173  , 0.000008852, 0.00001456 , 0.000059404,
#        0.000032111, 0.000073019, 0.000033778, 0.000067104, 0.000043997,
#        0.000001909])
</span></code></pre></div></div>

<h4>Solution</h4>

<div class="language-python highlighter-rouge"><div class="highlight"><pre class="highlight"><code><span class="n">np</span><span class="p">.</span><span class="n">set_printoptions</span><span class="p">(</span><span class="n">suppress</span><span class="o">=</span><span class="bp">True</span><span class="p">,</span><span class="n">precision</span><span class="o">=</span><span class="mi">9</span><span class="p">)</span>
<span class="n">my_array</span>
</code></pre></div></div>

<div class="language-plaintext highlighter-rouge"><div class="highlight"><pre class="highlight"><code>array([0.000053158, 0.000062614, 0.000018162, 0.000066052, 0.000056138,
       0.000060267, 0.0000173  , 0.000008852, 0.00001456 , 0.000059404,
       0.000032111, 0.000073019, 0.000033778, 0.000067104, 0.000043997,
       0.000001909])
</code></pre></div></div>

<p>We remove the exponential scientific by setting the suppress argument to True inside the set_printoptions method and set the precision to 9 because the numbers are too small to be printed using the default precision (which is 1) and it will make the whole array to be composed of 0.0.</p>

<h3>Ex 24: Generate the same random array using the random method</h3>

<p>Q: Keep on generating the same random array composed of elements under 30, even on a different system using the random method.</p>

<h4>Solution</h4>

<div class="language-python highlighter-rouge"><div class="highlight"><pre class="highlight"><code><span class="n">np</span><span class="p">.</span><span class="n">random</span><span class="p">.</span><span class="n">seed</span><span class="p">(</span><span class="mi">2</span><span class="p">)</span>
<span class="n">my_array</span> <span class="o">=</span> <span class="n">np</span><span class="p">.</span><span class="n">random</span><span class="p">.</span><span class="n">random</span><span class="p">(</span><span class="mi">30</span><span class="p">)</span>
</code></pre></div></div>

<div class="language-python highlighter-rouge"><div class="highlight"><pre class="highlight"><code><span class="k">print</span><span class="p">(</span><span class="n">my_array</span><span class="p">)</span>
</code></pre></div></div>

<div class="language-plaintext highlighter-rouge"><div class="highlight"><pre class="highlight"><code>[0.435994902 0.025926232 0.549662478 0.435322393 0.420367802 0.330334821
 0.204648634 0.619270966 0.299654674 0.266827275 0.621133833 0.529142094
 0.134579945 0.513578121 0.184439866 0.785335148 0.853975293 0.494236837
 0.846561485 0.079645477 0.50524609  0.065286504 0.428122328 0.096530916
 0.127159972 0.596745309 0.226012001 0.106945684 0.220306207 0.349826285]
</code></pre></div></div>

<p>We can generate the same array each time by using the seed method. The numbers passed in will determine the array that will be created. In other words, if the number passed in the seed method remain the same, we will keep on generating the exact array.</p>

<h3>Ex 25: Limit the number of elements printed in an array</h3>

<p>Q: Limit the number of items printed in an array to a maximum of 6 elements (The first 3 elements and the last 3).</p>

<div class="language-python highlighter-rouge"><div class="highlight"><pre class="highlight"><code><span class="n">my_array</span> <span class="o">=</span> <span class="n">np</span><span class="p">.</span><span class="n">arange</span><span class="p">(</span><span class="mi">0</span><span class="p">,</span><span class="mi">100</span><span class="p">)</span>
</code></pre></div></div>

<div class="language-python highlighter-rouge"><div class="highlight"><pre class="highlight"><code><span class="k">print</span><span class="p">(</span><span class="n">my_array</span><span class="p">)</span>
</code></pre></div></div>

<div class="language-plaintext highlighter-rouge"><div class="highlight"><pre class="highlight"><code>[ 0  1  2  3  4  5  6  7  8  9 10 11 12 13 14 15 16 17 18 19 20 21 22 23
 24 25 26 27 28 29 30 31 32 33 34 35 36 37 38 39 40 41 42 43 44 45 46 47
 48 49 50 51 52 53 54 55 56 57 58 59 60 61 62 63 64 65 66 67 68 69 70 71
 72 73 74 75 76 77 78 79 80 81 82 83 84 85 86 87 88 89 90 91 92 93 94 95
 96 97 98 99]
</code></pre></div></div>

<h4>Desire output</h4>

<div class="language-python highlighter-rouge"><div class="highlight"><pre class="highlight"><code><span class="c1"># [ 0  1  2 ... 97 98 99]
</span></code></pre></div></div>

<h4>Solution</h4>

<div class="language-python highlighter-rouge"><div class="highlight"><pre class="highlight"><code><span class="n">np</span><span class="p">.</span><span class="n">set_printoptions</span><span class="p">(</span><span class="n">threshold</span><span class="o">=</span><span class="mi">6</span><span class="p">)</span>
</code></pre></div></div>

<div class="language-python highlighter-rouge"><div class="highlight"><pre class="highlight"><code><span class="k">print</span><span class="p">(</span><span class="n">my_array</span><span class="p">)</span>
</code></pre></div></div>

<div class="language-plaintext highlighter-rouge"><div class="highlight"><pre class="highlight"><code>[ 0  1  2 ... 97 98 99]
</code></pre></div></div>

<p>Setting threshold argument to 6, we telling NumPy only to print the first three and last three elements in an array.</p>

<h3>Ex 26: Print the full array</h3>

<p>Q: This time, we are going to do the opposite of what we did in the previous exercise.</p>

<h4>Desire output</h4>

<div class="language-python highlighter-rouge"><div class="highlight"><pre class="highlight"><code><span class="c1"># [ 0  1  2  3  4  5  6  7  8  9 10 11 12 13 14 15 16 17 18 19 20 21 22 23
#  24 25 26 27 28 29 30 31 32 33 34 35 36 37 38 39 40 41 42 43 44 45 46 47
#  48 49 50 51 52 53 54 55 56 57 58 59 60 61 62 63 64 65 66 67 68 69 70 71
#  72 73 74 75 76 77 78 79 80 81 82 83 84 85 86 87 88 89 90 91 92 93 94 95
#  96 97 98 99]
</span></code></pre></div></div>

<h4>Solution</h4>

<div class="language-python highlighter-rouge"><div class="highlight"><pre class="highlight"><code><span class="n">np</span><span class="p">.</span><span class="n">set_printoptions</span><span class="p">(</span><span class="n">threshold</span><span class="o">=</span><span class="mi">1000</span><span class="p">)</span>
</code></pre></div></div>

<div class="language-python highlighter-rouge"><div class="highlight"><pre class="highlight"><code><span class="k">print</span><span class="p">(</span><span class="n">my_array</span><span class="p">)</span>
</code></pre></div></div>

<div class="language-plaintext highlighter-rouge"><div class="highlight"><pre class="highlight"><code>[ 0  1  2  3  4  5  6  7  8  9 10 11 12 13 14 15 16 17 18 19 20 21 22 23
 24 25 26 27 28 29 30 31 32 33 34 35 36 37 38 39 40 41 42 43 44 45 46 47
 48 49 50 51 52 53 54 55 56 57 58 59 60 61 62 63 64 65 66 67 68 69 70 71
 72 73 74 75 76 77 78 79 80 81 82 83 84 85 86 87 88 89 90 91 92 93 94 95
 96 97 98 99]
</code></pre></div></div>

<p>We set back the threshold to the default value, which is 1000. NumPy will print up to 1000 elements in an array before starting hiding the elements in the middle of the array.</p>

<h3>Ex 27: Import the text from a dataset without changing the text</h3>

<p>Q: We are going to import <a href="https://archive.ics.uci.edu/ml/machine-learning-databases/iris/iris.data" target="_blank">this</a> dataset and place it in NumPy array then print only the first three rows.</p>

<h4>Desire output</h4>

<div class="language-python highlighter-rouge"><div class="highlight"><pre class="highlight"><code><span class="c1"># [(5.1, 3.5, 1.4, 0.2, b'Iris-setosa') (4.9, 3. , 1.4, 0.2, b'Iris-setosa')
#  (4.7, 3.2, 1.3, 0.2, b'Iris-setosa')]
</span></code></pre></div></div>

<h4>Solution</h4>

<h4>1st Method</h4>

<div class="language-python highlighter-rouge"><div class="highlight"><pre class="highlight"><code><span class="n">the_data_1</span> <span class="o">=</span> <span class="n">np</span><span class="p">.</span><span class="n">loadtxt</span><span class="p">(</span><span class="s">"https://archive.ics.uci.edu/ml/machine-learning-databases/iris/iris.data"</span><span class="p">,</span><span class="n">dtype</span><span class="o">=</span><span class="p">{</span><span class="s">'names'</span><span class="p">:</span> <span class="p">(</span><span class="s">'sepal length'</span><span class="p">,</span> <span class="s">'sepal width'</span><span class="p">,</span> <span class="s">'petal length'</span><span class="p">,</span> <span class="s">'petal width'</span><span class="p">,</span> <span class="s">'species'</span><span class="p">),</span>
          <span class="s">'formats'</span><span class="p">:</span> <span class="p">(</span><span class="n">np</span><span class="p">.</span><span class="nb">float</span><span class="p">,</span> <span class="n">np</span><span class="p">.</span><span class="nb">float</span><span class="p">,</span> <span class="n">np</span><span class="p">.</span><span class="nb">float</span><span class="p">,</span> <span class="n">np</span><span class="p">.</span><span class="nb">float</span><span class="p">,</span> <span class="s">'|S15'</span><span class="p">)},</span><span class="n">delimiter</span><span class="o">=</span><span class="s">","</span><span class="p">)</span>
</code></pre></div></div>

<div class="language-python highlighter-rouge"><div class="highlight"><pre class="highlight"><code><span class="k">print</span><span class="p">(</span><span class="n">the_data_1</span><span class="p">[:</span><span class="mi">3</span><span class="p">])</span>
</code></pre></div></div>

<div class="language-plaintext highlighter-rouge"><div class="highlight"><pre class="highlight"><code>[(5.1, 3.5, 1.4, 0.2, b'Iris-setosa') (4.9, 3. , 1.4, 0.2, b'Iris-setosa')
 (4.7, 3.2, 1.3, 0.2, b'Iris-setosa')]
</code></pre></div></div>

<p>So we can store the data in an array using the loadtxt method, the first argument is the path (online URL or path on a local machine) to the dataset, then a dictionary that will hold the name and the data type of each column and finally, we set the delimiter to be a comma since we are importing from a CSV file.</p>

<h4>2nd Method</h4>

<div class="language-python highlighter-rouge"><div class="highlight"><pre class="highlight"><code><span class="n">the_data_2</span> <span class="o">=</span> <span class="n">np</span><span class="p">.</span><span class="n">genfromtxt</span><span class="p">(</span><span class="s">"https://archive.ics.uci.edu/ml/machine-learning-databases/iris/iris.data"</span><span class="p">,</span><span class="n">dtype</span><span class="o">=</span><span class="p">{</span><span class="s">'names'</span><span class="p">:</span> <span class="p">(</span><span class="s">'sepal length'</span><span class="p">,</span> <span class="s">'sepal width'</span><span class="p">,</span> <span class="s">'petal length'</span><span class="p">,</span> <span class="s">'petal width'</span><span class="p">,</span> <span class="s">'species'</span><span class="p">),</span>
          <span class="s">'formats'</span><span class="p">:</span> <span class="p">(</span><span class="n">np</span><span class="p">.</span><span class="nb">float</span><span class="p">,</span> <span class="n">np</span><span class="p">.</span><span class="nb">float</span><span class="p">,</span> <span class="n">np</span><span class="p">.</span><span class="nb">float</span><span class="p">,</span> <span class="n">np</span><span class="p">.</span><span class="nb">float</span><span class="p">,</span> <span class="s">'|S15'</span><span class="p">)},</span><span class="n">delimiter</span><span class="o">=</span><span class="s">","</span><span class="p">)</span>
</code></pre></div></div>

<div class="language-python highlighter-rouge"><div class="highlight"><pre class="highlight"><code><span class="k">print</span><span class="p">(</span><span class="n">the_data_2</span><span class="p">[:</span><span class="mi">3</span><span class="p">])</span>
</code></pre></div></div>

<div class="language-plaintext highlighter-rouge"><div class="highlight"><pre class="highlight"><code>[(5.1, 3.5, 1.4, 0.2, b'Iris-setosa') (4.9, 3. , 1.4, 0.2, b'Iris-setosa')
 (4.7, 3.2, 1.3, 0.2, b'Iris-setosa')]
</code></pre></div></div>

<p>We can achieve the same result by using the genfromtxt method, which does also takes the path (online or local) to the dataset, then the name and data type of each column in a key-value pair format (dictionaries) and finally the delimiter.</p>

<h3>Ex 28: Extract a specific column from the previous dataset</h3>

<p>Q: get the sepal width column from the previous dataset.</p>

<h4>Desire output</h4>

<div class="language-python highlighter-rouge"><div class="highlight"><pre class="highlight"><code><span class="c1">#array([b'Iris-setosa', b'Iris-setosa', b'Iris-setosa', b'Iris-setosa',
#       b'Iris-setosa'], dtype='|S15')
</span></code></pre></div></div>

<h4>Solution</h4>

<div class="language-python highlighter-rouge"><div class="highlight"><pre class="highlight"><code><span class="n">the_data_1</span><span class="p">[</span><span class="s">'species'</span><span class="p">][:</span><span class="mi">5</span><span class="p">]</span>
</code></pre></div></div>

<div class="language-plaintext highlighter-rouge"><div class="highlight"><pre class="highlight"><code>array([b'Iris-setosa', b'Iris-setosa', b'Iris-setosa', b'Iris-setosa',
       b'Iris-setosa'], dtype='|S15')
</code></pre></div></div>

<p>We are using the indexing on the_data_1 array to get back the specified name of the column then print the first five rows.</p>

<h3>Ex 29: Import specific columns in the dataset as a two-dimensional array</h3>

<p>Q: Import only the columns that contain numbers (as float) in the dataset as a two-dimensional array by omitting the species column. Then print the first five rows.</p>

<h4>Desire output</h4>

<div class="language-python highlighter-rouge"><div class="highlight"><pre class="highlight"><code><span class="c1"># array([[5.1, 3.5, 1.4, 0.2],
#        [4.9, 3. , 1.4, 0.2],
#        [4.7, 3.2, 1.3, 0.2],
#        [4.6, 3.1, 1.5, 0.2],
#        [5. , 3.6, 1.4, 0.2]])
</span></code></pre></div></div>

<h4>Solution</h4>

<div class="language-python highlighter-rouge"><div class="highlight"><pre class="highlight"><code><span class="n">the_data</span> <span class="o">=</span> <span class="n">np</span><span class="p">.</span><span class="n">genfromtxt</span><span class="p">(</span><span class="s">"https://archive.ics.uci.edu/ml/machine-learning-databases/iris/iris.data"</span><span class="p">,</span><span class="n">delimiter</span><span class="o">=</span><span class="s">","</span><span class="p">,</span><span class="n">dtype</span><span class="o">=</span><span class="s">"float"</span><span class="p">,</span><span class="n">usecols</span><span class="o">=</span><span class="p">[</span><span class="mi">0</span><span class="p">,</span><span class="mi">1</span><span class="p">,</span><span class="mi">2</span><span class="p">,</span><span class="mi">3</span><span class="p">])</span>
</code></pre></div></div>

<div class="language-python highlighter-rouge"><div class="highlight"><pre class="highlight"><code><span class="n">the_data</span><span class="p">[:</span><span class="mi">5</span><span class="p">]</span>
</code></pre></div></div>

<div class="language-plaintext highlighter-rouge"><div class="highlight"><pre class="highlight"><code>array([[5.1, 3.5, 1.4, 0.2],
       [4.9, 3. , 1.4, 0.2],
       [4.7, 3.2, 1.3, 0.2],
       [4.6, 3.1, 1.5, 0.2],
       [5. , 3.6, 1.4, 0.2]])
</code></pre></div></div>

<p>We can use the genfromtxt or loadtxt method, pass in the path to the dataset, the delimiter, set the data type of all the columns to be float and finally select the desired columns (column 0 to 3) which will exclude the species column. The returned array will be a two-dimensional array.</p>

<h3>Ex 30: Compute the mean, median, standard deviation of a NumPy column</h3>

<p>Q: Find the mean, median, standard deviation of iris’s sepal length (1st column).</p>

<h4>Desire output</h4>

<div class="language-python highlighter-rouge"><div class="highlight"><pre class="highlight"><code><span class="c1"># The mean is 5.84, the median is 5.80, the std is 0.8253012917851409
</span></code></pre></div></div>

<h4>Solution</h4>

<div class="language-python highlighter-rouge"><div class="highlight"><pre class="highlight"><code><span class="n">sepal_lenght_mean</span> <span class="o">=</span> <span class="n">np</span><span class="p">.</span><span class="n">mean</span><span class="p">(</span><span class="n">the_data_1</span><span class="p">[</span><span class="s">"sepal length"</span><span class="p">])</span>
</code></pre></div></div>

<div class="language-python highlighter-rouge"><div class="highlight"><pre class="highlight"><code><span class="n">sepal_lenght_std</span> <span class="o">=</span> <span class="n">np</span><span class="p">.</span><span class="n">std</span><span class="p">(</span><span class="n">the_data_1</span><span class="p">[</span><span class="s">"sepal length"</span><span class="p">])</span>
</code></pre></div></div>

<div class="language-python highlighter-rouge"><div class="highlight"><pre class="highlight"><code><span class="n">sepal_lenght_median</span> <span class="o">=</span> <span class="n">np</span><span class="p">.</span><span class="n">median</span><span class="p">(</span><span class="n">the_data_1</span><span class="p">[</span><span class="s">"sepal length"</span><span class="p">])</span>
</code></pre></div></div>

<div class="language-python highlighter-rouge"><div class="highlight"><pre class="highlight"><code><span class="k">print</span><span class="p">(</span><span class="s">"The mean is {:.2f}, the median is {:.2f}, the std is {}"</span><span class="p">.</span><span class="nb">format</span><span class="p">(</span><span class="n">sepal_lenght_mean</span><span class="p">,</span><span class="n">sepal_lenght_median</span><span class="p">,</span><span class="n">sepal_lenght_std</span><span class="p">))</span>
</code></pre></div></div>

<div class="language-plaintext highlighter-rouge"><div class="highlight"><pre class="highlight"><code>The mean is 5.84, the median is 5.80, the std is 0.8253012917851409
</code></pre></div></div>

<p>We first used indexing to get the specified column and passed it as an argument to the NumPy mean, std and the median method.</p>

<h3>Ex 31: Normalize an array so that all the values range between 0 and 1?</h3>

<p>Q: Create a normalized form of iris’s sepal length on a scale of 0 and 1, where 0 is the lowest number, and 1 the highest number.</p>

<h4>Desire output</h4>

<div class="language-python highlighter-rouge"><div class="highlight"><pre class="highlight"><code><span class="c1"># [0.22222 0.16667 0.11111 0.08333 0.19444 0.30556 0.08333 0.19444 0.02778
#  0.16667 0.30556 0.13889 0.13889 0.      0.41667 0.38889 0.30556 0.22222
#  0.38889 0.22222 0.30556 0.22222 0.08333 0.22222 0.13889 0.19444 0.19444
#  0.25    0.25    0.11111 0.13889 0.30556 0.25    0.33333 0.16667 0.19444
#  0.33333 0.16667 0.02778 0.22222 0.19444 0.05556 0.02778 0.19444 0.22222
#  0.13889 0.22222 0.08333 0.27778 0.19444 0.75    0.58333 0.72222 0.33333
#  0.61111 0.38889 0.55556 0.16667 0.63889 0.25    0.19444 0.44444 0.47222
#  0.5     0.36111 0.66667 0.36111 0.41667 0.52778 0.36111 0.44444 0.5
#  0.55556 0.5     0.58333 0.63889 0.69444 0.66667 0.47222 0.38889 0.33333
#  0.33333 0.41667 0.47222 0.30556 0.47222 0.66667 0.55556 0.36111 0.33333
#  0.33333 0.5     0.41667 0.19444 0.36111 0.38889 0.38889 0.52778 0.22222
#  0.38889 0.55556 0.41667 0.77778 0.55556 0.61111 0.91667 0.16667 0.83333
#  0.66667 0.80556 0.61111 0.58333 0.69444 0.38889 0.41667 0.58333 0.61111
#  0.94444 0.94444 0.47222 0.72222 0.36111 0.94444 0.55556 0.66667 0.80556
#  0.52778 0.5     0.58333 0.80556 0.86111 1.      0.58333 0.55556 0.5
#  0.94444 0.55556 0.58333 0.47222 0.72222 0.66667 0.72222 0.41667 0.69444
#  0.66667 0.66667 0.55556 0.61111 0.52778 0.44444]
</span></code></pre></div></div>

<h4>Solution</h4>

<div class="language-python highlighter-rouge"><div class="highlight"><pre class="highlight"><code><span class="n">the_min</span> <span class="o">=</span> <span class="n">the_data_1</span><span class="p">[</span><span class="s">"sepal length"</span><span class="p">].</span><span class="nb">min</span><span class="p">()</span>
<span class="n">the_max</span> <span class="o">=</span> <span class="n">the_data_1</span><span class="p">[</span><span class="s">"sepal length"</span><span class="p">].</span><span class="nb">max</span><span class="p">()</span>
</code></pre></div></div>

<div class="language-python highlighter-rouge"><div class="highlight"><pre class="highlight"><code><span class="n">norm_data</span> <span class="o">=</span> <span class="p">(</span><span class="n">the_data_1</span><span class="p">[</span><span class="s">"sepal length"</span><span class="p">]</span> <span class="o">-</span> <span class="n">the_min</span><span class="p">)</span> <span class="o">/</span> <span class="p">(</span><span class="n">the_max</span> <span class="o">-</span> <span class="n">the_min</span><span class="p">)</span>
</code></pre></div></div>

<div class="language-python highlighter-rouge"><div class="highlight"><pre class="highlight"><code><span class="n">np</span><span class="p">.</span><span class="n">set_printoptions</span><span class="p">(</span><span class="n">precision</span><span class="o">=</span><span class="mi">5</span><span class="p">)</span>
<span class="k">print</span><span class="p">(</span><span class="n">norm_data</span><span class="p">)</span>
</code></pre></div></div>

<div class="language-plaintext highlighter-rouge"><div class="highlight"><pre class="highlight"><code>[0.22222 0.16667 0.11111 0.08333 0.19444 0.30556 0.08333 0.19444 0.02778
 0.16667 0.30556 0.13889 0.13889 0.      0.41667 0.38889 0.30556 0.22222
 0.38889 0.22222 0.30556 0.22222 0.08333 0.22222 0.13889 0.19444 0.19444
 0.25    0.25    0.11111 0.13889 0.30556 0.25    0.33333 0.16667 0.19444
 0.33333 0.16667 0.02778 0.22222 0.19444 0.05556 0.02778 0.19444 0.22222
 0.13889 0.22222 0.08333 0.27778 0.19444 0.75    0.58333 0.72222 0.33333
 0.61111 0.38889 0.55556 0.16667 0.63889 0.25    0.19444 0.44444 0.47222
 0.5     0.36111 0.66667 0.36111 0.41667 0.52778 0.36111 0.44444 0.5
 0.55556 0.5     0.58333 0.63889 0.69444 0.66667 0.47222 0.38889 0.33333
 0.33333 0.41667 0.47222 0.30556 0.47222 0.66667 0.55556 0.36111 0.33333
 0.33333 0.5     0.41667 0.19444 0.36111 0.38889 0.38889 0.52778 0.22222
 0.38889 0.55556 0.41667 0.77778 0.55556 0.61111 0.91667 0.16667 0.83333
 0.66667 0.80556 0.61111 0.58333 0.69444 0.38889 0.41667 0.58333 0.61111
 0.94444 0.94444 0.47222 0.72222 0.36111 0.94444 0.55556 0.66667 0.80556
 0.52778 0.5     0.58333 0.80556 0.86111 1.      0.58333 0.55556 0.5
 0.94444 0.55556 0.58333 0.47222 0.72222 0.66667 0.72222 0.41667 0.69444
 0.66667 0.66667 0.55556 0.61111 0.52778 0.44444]
</code></pre></div></div>

<p>We first get the lowest and the highest number in the sepal length column.</p>

<p>Then calculate the norm by subtracting each element in the column by the minimum and dividing it by the maximum minus the minimum.</p>

<p>Finally, we set the precision to 5.</p>

<h3>Ex 32: Find the softmax score</h3>

<p>Q: Compute the softmax score of the sepal length column and print only the first five values.</p>

<h4>Desire output</h4>

<div class="language-python highlighter-rouge"><div class="highlight"><pre class="highlight"><code><span class="c1"># [0.002219585 0.001817243 0.001487833 0.001346247 0.002008364]
</span></code></pre></div></div>

<h4>Solution</h4>

<h4>1st Method</h4>

<div class="language-python highlighter-rouge"><div class="highlight"><pre class="highlight"><code><span class="n">softmax_score</span> <span class="o">=</span> <span class="n">np</span><span class="p">.</span><span class="n">exp</span><span class="p">(</span><span class="n">the_data_1</span><span class="p">[</span><span class="s">"sepal length"</span><span class="p">])</span><span class="o">/</span><span class="nb">sum</span><span class="p">(</span><span class="n">np</span><span class="p">.</span><span class="n">exp</span><span class="p">(</span><span class="n">the_data_1</span><span class="p">[</span><span class="s">"sepal length"</span><span class="p">]))</span>
<span class="k">print</span><span class="p">(</span><span class="n">softmax_score</span><span class="p">[:</span><span class="mi">5</span><span class="p">])</span>
</code></pre></div></div>

<div class="language-plaintext highlighter-rouge"><div class="highlight"><pre class="highlight"><code>[0.002219585 0.001817243 0.001487833 0.001346247 0.002008364]
</code></pre></div></div>

<p>The softmax score is obtained by getting the exponential of each element in the sepal length column then dividing it with the sum of all exponentials of elements in the sepal length column.</p>

<h4>2nd Method</h4>

<div class="language-python highlighter-rouge"><div class="highlight"><pre class="highlight"><code><span class="kn">from</span> <span class="nn">scipy.special</span> <span class="kn">import</span> <span class="n">softmax</span>

<span class="n">softmax_score</span> <span class="o">=</span> <span class="n">softmax</span><span class="p">(</span><span class="n">the_data_1</span><span class="p">[</span><span class="s">"sepal length"</span><span class="p">])</span>
<span class="k">print</span><span class="p">(</span><span class="n">softmax_score</span><span class="p">[:</span><span class="mi">5</span><span class="p">])</span>
</code></pre></div></div>

<div class="language-plaintext highlighter-rouge"><div class="highlight"><pre class="highlight"><code>[0.002219585 0.001817243 0.001487833 0.001346247 0.002008364]
</code></pre></div></div>

<p>We can avoid hardcoding the softmax by importing the softmax method from SciPy library.</p>

<h3>Ex 33: Find different percentile scores of a column</h3>

<p>Q: Find the 5th and 95th percentile of iris’s sepal length column.</p>

<h4>Desire output</h4>

<div class="language-python highlighter-rouge"><div class="highlight"><pre class="highlight"><code><span class="c1"># The 5th percentile of iris's sepal length column 4.6 and the 95th percentile is 7.25
</span></code></pre></div></div>

<h4>Solution</h4>

<div class="language-python highlighter-rouge"><div class="highlight"><pre class="highlight"><code><span class="n">percentile_5</span> <span class="o">=</span> <span class="n">np</span><span class="p">.</span><span class="n">percentile</span><span class="p">(</span><span class="n">the_data_1</span><span class="p">[</span><span class="s">"sepal length"</span><span class="p">],</span><span class="mi">5</span><span class="p">)</span>
</code></pre></div></div>

<div class="language-python highlighter-rouge"><div class="highlight"><pre class="highlight"><code><span class="n">percentile_95</span> <span class="o">=</span> <span class="n">np</span><span class="p">.</span><span class="n">percentile</span><span class="p">(</span><span class="n">the_data_1</span><span class="p">[</span><span class="s">"sepal length"</span><span class="p">],</span><span class="mi">95</span><span class="p">)</span>
</code></pre></div></div>

<div class="language-python highlighter-rouge"><div class="highlight"><pre class="highlight"><code><span class="k">print</span><span class="p">(</span><span class="s">"The 5th percentile of iris's sepal length column {} and the 95th percentile is {:.2f}"</span><span class="p">.</span><span class="nb">format</span><span class="p">(</span><span class="n">percentile_5</span><span class="p">,</span><span class="n">percentile_95</span><span class="p">))</span>
</code></pre></div></div>

<div class="language-plaintext highlighter-rouge"><div class="highlight"><pre class="highlight"><code>The 5th percentile of iris's sepal length column 4.6 and the 95th percentile is 7.25
</code></pre></div></div>

<p>We are using the percentile method from NumPy, pass in the sepal length column then we specify the percentile number as a second argument.</p>

<h3>Ex 34: Insert a nan value at a random position in an array</h3>

<p>Q: Insert np.nan values at 20 random positions in dataset.</p>

<div class="language-python highlighter-rouge"><div class="highlight"><pre class="highlight"><code><span class="n">url</span> <span class="o">=</span> <span class="s">'https://archive.ics.uci.edu/ml/machine-learning-databases/iris/iris.data'</span>
<span class="n">the_data_2d</span> <span class="o">=</span> <span class="n">np</span><span class="p">.</span><span class="n">genfromtxt</span><span class="p">(</span><span class="n">url</span><span class="p">,</span><span class="n">dtype</span><span class="o">=</span><span class="s">"object"</span><span class="p">,</span><span class="n">delimiter</span><span class="o">=</span><span class="s">","</span><span class="p">)</span>
</code></pre></div></div>

<h4>Desire output</h4>

<div class="language-python highlighter-rouge"><div class="highlight"><pre class="highlight"><code><span class="c1"># use random.seed(100) to choose the number so that you can compare your answer with mine
# array([[b'5.1', b'3.5', b'1.4', b'0.2', nan],
#        [b'4.9', b'3.0', b'1.4', b'0.2', b'Iris-setosa'],
#        [b'4.7', b'3.2', b'1.3', b'0.2', b'Iris-setosa'],
#        [b'4.6', b'3.1', b'1.5', b'0.2', b'Iris-setosa'],
#        [b'5.0', b'3.6', b'1.4', b'0.2', b'Iris-setosa'],
#        [b'5.4', b'3.9', b'1.7', b'0.4', b'Iris-setosa'],
#        [b'4.6', b'3.4', b'1.4', b'0.3', b'Iris-setosa'],
#        [b'5.0', b'3.4', b'1.5', b'0.2', b'Iris-setosa'],
#        [nan, b'2.9', b'1.4', b'0.2', b'Iris-setosa'],
#        [b'4.9', b'3.1', b'1.5', b'0.1', b'Iris-setosa']], dtype=object)
</span></code></pre></div></div>

<h4>Solution</h4>

<div class="language-python highlighter-rouge"><div class="highlight"><pre class="highlight"><code><span class="n">np</span><span class="p">.</span><span class="n">random</span><span class="p">.</span><span class="n">seed</span><span class="p">(</span><span class="mi">100</span><span class="p">)</span>
<span class="n">the_data_2d</span><span class="p">[</span><span class="n">np</span><span class="p">.</span><span class="n">random</span><span class="p">.</span><span class="n">randint</span><span class="p">(</span><span class="mi">150</span><span class="p">,</span><span class="n">size</span><span class="o">=</span><span class="mi">20</span><span class="p">),</span><span class="n">np</span><span class="p">.</span><span class="n">random</span><span class="p">.</span><span class="n">randint</span><span class="p">(</span><span class="mi">5</span><span class="p">,</span><span class="n">size</span><span class="o">=</span><span class="mi">20</span><span class="p">)]</span> <span class="o">=</span> <span class="n">np</span><span class="p">.</span><span class="n">nan</span>
</code></pre></div></div>

<div class="language-python highlighter-rouge"><div class="highlight"><pre class="highlight"><code><span class="n">the_data_2d</span><span class="p">[:</span><span class="mi">10</span><span class="p">]</span>
</code></pre></div></div>

<div class="language-plaintext highlighter-rouge"><div class="highlight"><pre class="highlight"><code>array([[b'5.1', b'3.5', b'1.4', b'0.2', b'Iris-setosa'],
       [b'4.9', b'3.0', b'1.4', b'0.2', b'Iris-setosa'],
       [b'4.7', b'3.2', b'1.3', b'0.2', b'Iris-setosa'],
       [b'4.6', b'3.1', b'1.5', b'0.2', b'Iris-setosa'],
       [b'5.0', b'3.6', b'1.4', b'0.2', b'Iris-setosa'],
       [b'5.4', b'3.9', b'1.7', b'0.4', b'Iris-setosa'],
       [b'4.6', b'3.4', b'1.4', b'0.3', b'Iris-setosa'],
       [b'5.0', b'3.4', b'1.5', b'0.2', b'Iris-setosa'],
       [b'4.4', b'2.9', nan, b'0.2', b'Iris-setosa'],
       [b'4.9', b'3.1', b'1.5', b'0.1', b'Iris-setosa']], dtype=object)
</code></pre></div></div>

<p>We have used indexing on this data set to insert np.nan randomly. The first part of indexing, we are randomly selecting 20 positions from 0 to 149, which correspond to the number of rows.</p>

<p>Then the second part, we have also randomly chosen 20 positions between 0 to 4. In the end, we will have 20 pairs (rows and columns) of positions randomly generated. Nan will replace the element at those positions.</p>

<p>Finally, we print the first ten rows.</p>

<h3>Ex 35: Find the position of missing values (nan) in NumPy array</h3>

<p>Q: Find the number of times nan occurs and which row is it in the sepal length column (1st column).</p>

<div class="language-python highlighter-rouge"><div class="highlight"><pre class="highlight"><code><span class="n">np</span><span class="p">.</span><span class="n">random</span><span class="p">.</span><span class="n">seed</span><span class="p">(</span><span class="mi">100</span><span class="p">)</span>
<span class="n">url</span> <span class="o">=</span> <span class="s">'https://archive.ics.uci.edu/ml/machine-learning-databases/iris/iris.data'</span>
<span class="n">the_data_2d</span> <span class="o">=</span> <span class="n">np</span><span class="p">.</span><span class="n">genfromtxt</span><span class="p">(</span><span class="n">url</span><span class="p">,</span> <span class="n">delimiter</span><span class="o">=</span><span class="s">','</span><span class="p">,</span> <span class="n">dtype</span><span class="o">=</span><span class="s">'float'</span><span class="p">,</span><span class="n">usecols</span><span class="o">=</span><span class="p">[</span><span class="mi">0</span><span class="p">,</span><span class="mi">1</span><span class="p">,</span><span class="mi">2</span><span class="p">,</span><span class="mi">3</span><span class="p">])</span>
<span class="n">the_data_2d</span><span class="p">[</span><span class="n">np</span><span class="p">.</span><span class="n">random</span><span class="p">.</span><span class="n">randint</span><span class="p">(</span><span class="mi">150</span><span class="p">,</span> <span class="n">size</span><span class="o">=</span><span class="mi">20</span><span class="p">),</span> <span class="n">np</span><span class="p">.</span><span class="n">random</span><span class="p">.</span><span class="n">randint</span><span class="p">(</span><span class="mi">4</span><span class="p">,</span> <span class="n">size</span><span class="o">=</span><span class="mi">20</span><span class="p">)]</span> <span class="o">=</span> <span class="n">np</span><span class="p">.</span><span class="n">nan</span>
</code></pre></div></div>

<h4>Desire output</h4>

<div class="language-python highlighter-rouge"><div class="highlight"><pre class="highlight"><code><span class="c1"># The total number of nan in the sepal length column is 4 and the position of nan is [14 34 79 87]
</span></code></pre></div></div>

<h4>Solution</h4>

<div class="language-python highlighter-rouge"><div class="highlight"><pre class="highlight"><code><span class="n">nan_total</span> <span class="o">=</span> <span class="n">np</span><span class="p">.</span><span class="n">isnan</span><span class="p">(</span><span class="n">the_data_2d</span><span class="p">[:,</span><span class="mi">0</span><span class="p">]).</span><span class="nb">sum</span><span class="p">()</span>
<span class="n">nan_position</span> <span class="o">=</span> <span class="n">np</span><span class="p">.</span><span class="n">where</span><span class="p">(</span><span class="n">np</span><span class="p">.</span><span class="n">isnan</span><span class="p">(</span><span class="n">the_data_2d</span><span class="p">[:,</span><span class="mi">0</span><span class="p">]))[</span><span class="mi">0</span><span class="p">]</span>
</code></pre></div></div>

<div class="language-python highlighter-rouge"><div class="highlight"><pre class="highlight"><code><span class="k">print</span><span class="p">(</span><span class="s">"The total number of nan in the sepal length column is {} and the position of nan is {}"</span><span class="p">.</span><span class="nb">format</span><span class="p">(</span><span class="n">nan_total</span><span class="p">,</span><span class="n">nan_position</span><span class="p">))</span>
</code></pre></div></div>

<div class="language-plaintext highlighter-rouge"><div class="highlight"><pre class="highlight"><code>The total number of nan in the sepal length column is 4 and the position of nan is [14 34 79 87]
</code></pre></div></div>

<p>To get the total number of nan in the first column, we use indexing to get all the elements in the first column and apply isnan method only to get back all the occurrence of nan in the column, then use the sum to get the total number of nan.</p>

<p>To get the position, we start by extracting the column and apply the isnan method again, but this time we are using the where method to get back a boolean array composed where True is the position nan is found, and False is the position of any value other than nan.</p>

<p>The where method returns a tuple, but we are only interested in the first element that is why we used [0] at the end.</p>

<h3>Ex 36: Filter a NumPy array based on two or more conditions</h3>

<p>Q: Filter the rows of the_data_2d dataset that have a petal length (3rd column) &gt; 1.5 and sepal length (1st column) &lt; 5.0.</p>

<div class="language-python highlighter-rouge"><div class="highlight"><pre class="highlight"><code><span class="n">url</span> <span class="o">=</span> <span class="s">'https://archive.ics.uci.edu/ml/machine-learning-databases/iris/iris.data'</span>
<span class="n">the_data_2d</span> <span class="o">=</span> <span class="n">np</span><span class="p">.</span><span class="n">genfromtxt</span><span class="p">(</span><span class="n">url</span><span class="p">,</span> <span class="n">delimiter</span><span class="o">=</span><span class="s">','</span><span class="p">,</span> <span class="n">dtype</span><span class="o">=</span><span class="s">'float'</span><span class="p">,</span><span class="n">usecols</span><span class="o">=</span><span class="p">[</span><span class="mi">0</span><span class="p">,</span><span class="mi">1</span><span class="p">,</span><span class="mi">2</span><span class="p">,</span><span class="mi">3</span><span class="p">])</span>
</code></pre></div></div>

<h4>Desire output</h4>

<div class="language-python highlighter-rouge"><div class="highlight"><pre class="highlight"><code><span class="c1"># array([[4.8, 3.4, 1.6, 0.2],
#        [4.8, 3.4, 1.9, 0.2],
#        [4.7, 3.2, 1.6, 0.2],
#        [4.8, 3.1, 1.6, 0.2],
#        [4.9, 2.4, 3.3, 1. ],
#        [4.9, 2.5, 4.5, 1.7]])
</span></code></pre></div></div>

<h4>Solution</h4>

<div class="language-python highlighter-rouge"><div class="highlight"><pre class="highlight"><code><span class="n">the_condition</span> <span class="o">=</span> <span class="p">(</span><span class="n">the_data_2d</span><span class="p">[:,</span><span class="mi">2</span><span class="p">]</span><span class="o">&gt;</span><span class="mf">1.5</span><span class="p">)</span> <span class="o">&amp;</span> <span class="p">(</span><span class="n">the_data_2d</span><span class="p">[:,</span><span class="mi">0</span><span class="p">]</span><span class="o">&lt;</span><span class="mf">5.0</span><span class="p">)</span>
<span class="n">the_data_2d</span><span class="p">[</span><span class="n">the_condition</span><span class="p">]</span>
</code></pre></div></div>

<div class="language-plaintext highlighter-rouge"><div class="highlight"><pre class="highlight"><code>array([[4.8, 3.4, 1.6, 0.2],
       [4.8, 3.4, 1.9, 0.2],
       [4.7, 3.2, 1.6, 0.2],
       [4.8, 3.1, 1.6, 0.2],
       [4.9, 2.4, 3.3, 1. ],
       [4.9, 2.5, 4.5, 1.7]])
</code></pre></div></div>

<p>We get the rows where the elements are greater than 1.5  in the third column and bigger than five the in the first column.</p>

<p>We are using indexing with the and operator (&amp;) to get the elements that meet those two conditions in the two columns and store them in a variable.</p>

<p>Finally, we use the variable with indexing to get back all the rows that meet the two conditions.</p>

<h3>Ex 37: Drop rows that contain a missing value</h3>

<p>Q: Select only the rows in the_data_2d that does not have any nan value.</p>

<div class="language-python highlighter-rouge"><div class="highlight"><pre class="highlight"><code><span class="n">url</span> <span class="o">=</span> <span class="s">'https://archive.ics.uci.edu/ml/machine-learning-databases/iris/iris.data'</span>
<span class="n">the_data_2d</span> <span class="o">=</span> <span class="n">np</span><span class="p">.</span><span class="n">genfromtxt</span><span class="p">(</span><span class="n">url</span><span class="p">,</span><span class="n">usecols</span><span class="o">=</span><span class="p">[</span><span class="mi">0</span><span class="p">,</span><span class="mi">1</span><span class="p">,</span><span class="mi">2</span><span class="p">,</span><span class="mi">3</span><span class="p">],</span><span class="n">delimiter</span><span class="o">=</span><span class="s">","</span><span class="p">,</span><span class="n">dtype</span><span class="o">=</span><span class="s">"float"</span><span class="p">)</span>
<span class="n">np</span><span class="p">.</span><span class="n">random</span><span class="p">.</span><span class="n">seed</span><span class="p">(</span><span class="mi">100</span><span class="p">)</span>
<span class="c1">#injecting nan value in the dataset
</span><span class="n">the_data_2d</span><span class="p">[</span><span class="n">np</span><span class="p">.</span><span class="n">random</span><span class="p">.</span><span class="n">randint</span><span class="p">(</span><span class="mi">150</span><span class="p">,</span><span class="n">size</span><span class="o">=</span><span class="mi">20</span><span class="p">),</span><span class="n">np</span><span class="p">.</span><span class="n">random</span><span class="p">.</span><span class="n">randint</span><span class="p">(</span><span class="mi">4</span><span class="p">,</span><span class="n">size</span><span class="o">=</span><span class="mi">20</span><span class="p">)]</span> <span class="o">=</span> <span class="n">np</span><span class="p">.</span><span class="n">nan</span>
</code></pre></div></div>

<h4>Desire output</h4>

<div class="language-python highlighter-rouge"><div class="highlight"><pre class="highlight"><code><span class="c1"># The output should be the same by using the seed method with 
# array([[5.1, 3.5, 1.4, 0.2],
#        [4.9, 3. , 1.4, 0.2],
#        [4.7, 3.2, 1.3, 0.2],
#        [4.6, 3.1, 1.5, 0.2],
#        [5. , 3.6, 1.4, 0.2]])
</span></code></pre></div></div>

<h4>Solution</h4>

<div class="language-python highlighter-rouge"><div class="highlight"><pre class="highlight"><code><span class="n">the_condition</span> <span class="o">=</span> <span class="p">[</span><span class="n">np</span><span class="p">.</span><span class="nb">sum</span><span class="p">(</span><span class="n">np</span><span class="p">.</span><span class="n">isnan</span><span class="p">(</span><span class="n">the_data_2d</span><span class="p">),</span> <span class="n">axis</span> <span class="o">=</span> <span class="mi">1</span><span class="p">)</span><span class="o">==</span><span class="mi">0</span><span class="p">]</span>
<span class="n">the_data_2d</span><span class="p">[</span><span class="nb">tuple</span><span class="p">(</span><span class="n">the_condition</span><span class="p">)][:</span><span class="mi">5</span><span class="p">]</span>
</code></pre></div></div>

<div class="language-plaintext highlighter-rouge"><div class="highlight"><pre class="highlight"><code>array([[5.1, 3.5, 1.4, 0.2],
       [4.9, 3. , 1.4, 0.2],
       [4.7, 3.2, 1.3, 0.2],
       [4.6, 3.1, 1.5, 0.2],
       [5. , 3.6, 1.4, 0.2]])
</code></pre></div></div>

<p>We use the isnan method to get all the occurrences of nan in the whole dataset. We get back a boolean array where True is a nan value and False represents any other value. This boolean is then placed in a sum method which will sum up all the occurrences of True value row-wise because we have set the axis to 1.</p>

<p>After getting the total counts for each row, we compare it to 0 to get back a boolean array where True represents the rows that don’t contain any nan value.</p>

<p>Now that we have this array, we can use indexing on the original array to get back the first five rows which don’t contain any nan value.</p>

<h3>Ex 38: Find the correlation between two columns of a NumPy array?</h3>

<p>Q: Find the correlation between sepal length(1st column) and petal length(3rd column) in the_data_2d dataset.</p>

<div class="language-python highlighter-rouge"><div class="highlight"><pre class="highlight"><code><span class="n">url</span> <span class="o">=</span> <span class="s">'https://archive.ics.uci.edu/ml/machine-learning-databases/iris/iris.data'</span>
<span class="n">the_data_2d</span> <span class="o">=</span> <span class="n">np</span><span class="p">.</span><span class="n">genfromtxt</span><span class="p">(</span><span class="n">url</span><span class="p">,</span> <span class="n">delimiter</span><span class="o">=</span><span class="s">','</span><span class="p">,</span> <span class="n">dtype</span><span class="o">=</span><span class="s">'float'</span><span class="p">,</span> <span class="n">usecols</span><span class="o">=</span><span class="p">[</span><span class="mi">0</span><span class="p">,</span><span class="mi">1</span><span class="p">,</span><span class="mi">2</span><span class="p">,</span><span class="mi">3</span><span class="p">])</span>
</code></pre></div></div>

<h4>Desired output</h4>

<div class="language-python highlighter-rouge"><div class="highlight"><pre class="highlight"><code><span class="c1"># 0.8717541573048718
</span></code></pre></div></div>

<h4>Solution</h4>

<p>For this exercise, we are asked to calculate the correlation. But what is a correlation in the first place? Well, it is a dependence or association is any statistical relationship, whether causal or not, between two random variables or bivariate data. In simple words, correlation indicates the degree of a linear relationship between two numeric variables. Remember, correlation does not imply causation. Sometimes, a correlation is also called Pearson’s correlation</p>

<p>Strictly speaking, Pearson’s correlation requires a normally distributed dataset and not necessarily zero-mean. Like other correlation coefficients, this one varies between -1 and +1 with 0 implying no correlation. Correlations of -1 or +1 imply an exact linear relationship. Positive correlations indicate that as x increases, so
does y. Negative correlations suggest that as x increases, y decreases.</p>

<h4>1st Method</h4>

<div class="language-python highlighter-rouge"><div class="highlight"><pre class="highlight"><code><span class="n">all_correlation</span> <span class="o">=</span> <span class="n">np</span><span class="p">.</span><span class="n">corrcoef</span><span class="p">((</span><span class="n">the_data_2d</span><span class="p">[:,</span><span class="mi">0</span><span class="p">],</span><span class="n">the_data_2d</span><span class="p">[:,</span><span class="mi">2</span><span class="p">]))</span>
<span class="n">all_correlation</span>
</code></pre></div></div>

<div class="language-plaintext highlighter-rouge"><div class="highlight"><pre class="highlight"><code>array([[1.         , 0.871754157],
       [0.871754157, 1.         ]])
</code></pre></div></div>

<div class="language-python highlighter-rouge"><div class="highlight"><pre class="highlight"><code><span class="k">print</span><span class="p">(</span><span class="n">all_correlation</span><span class="p">[</span><span class="mi">0</span><span class="p">][</span><span class="mi">1</span><span class="p">])</span>
</code></pre></div></div>

<div class="language-plaintext highlighter-rouge"><div class="highlight"><pre class="highlight"><code>0.8717541573048718
</code></pre></div></div>

<p>The first way, we can get the correlation in any row or column is by using the corrcoef method. We pass in a tuple composed of sepal length column (which is the first column) and petal length column (which is the second column).</p>

<p>We get back a two-dimensional array of all possible combination of the sepal length and petal length column including correlation of each column with itself (which is +1). Now we only have to extract the correlation of sepal length and petal length located in the first row (position 0), the second column (1).</p>

<h4>2nd Method</h4>

<div class="language-python highlighter-rouge"><div class="highlight"><pre class="highlight"><code><span class="kn">from</span> <span class="nn">scipy.stats.stats</span> <span class="kn">import</span> <span class="n">pearsonr</span>
</code></pre></div></div>

<div class="language-python highlighter-rouge"><div class="highlight"><pre class="highlight"><code><span class="n">corr</span><span class="p">,</span><span class="n">p_value</span> <span class="o">=</span> <span class="n">pearsonr</span><span class="p">(</span><span class="n">the_data_2d</span><span class="p">[:,</span><span class="mi">0</span><span class="p">],</span><span class="n">the_data_2d</span><span class="p">[:,</span><span class="mi">2</span><span class="p">])</span>
</code></pre></div></div>

<div class="language-python highlighter-rouge"><div class="highlight"><pre class="highlight"><code><span class="k">print</span><span class="p">(</span><span class="s">"The correlation is {} and the p value is {}"</span><span class="p">.</span><span class="nb">format</span><span class="p">(</span><span class="n">corr</span><span class="p">,</span><span class="n">p_value</span><span class="p">))</span>
</code></pre></div></div>

<div class="language-plaintext highlighter-rouge"><div class="highlight"><pre class="highlight"><code>The correlation is 0.8717541573048712 and the p value is 1.0384540627941809e-47
</code></pre></div></div>

<p>We can import the Pearson’s correlation method from SciPy and pass in the two columns. We get back two values, correlation and p-value.</p>

<p>The p-value roughly indicates the probability of an uncorrelated system producing datasets that correlate at least as extreme as the one computed. The lower the p-value (&lt;0.01), the stronger is the significance of the relationship. It is not an indicator of strength. The p-values are not entirely reliable but are probably reasonable for datasets larger than 500 or so.</p>

<h3>Ex 39: Find out if a given array has any null or nan values</h3>

<p>Q: Find out if the_data_2d has any missing values.</p>

<div class="language-python highlighter-rouge"><div class="highlight"><pre class="highlight"><code><span class="n">url</span> <span class="o">=</span> <span class="s">'https://archive.ics.uci.edu/ml/machine-learning-databases/iris/iris.data'</span>
<span class="n">the_data_2d</span> <span class="o">=</span> <span class="n">np</span><span class="p">.</span><span class="n">genfromtxt</span><span class="p">(</span><span class="n">url</span><span class="p">,</span> <span class="n">delimiter</span><span class="o">=</span><span class="s">','</span><span class="p">,</span> <span class="n">dtype</span><span class="o">=</span><span class="s">'float'</span><span class="p">,</span> <span class="n">usecols</span><span class="o">=</span><span class="p">[</span><span class="mi">0</span><span class="p">,</span><span class="mi">1</span><span class="p">,</span><span class="mi">2</span><span class="p">,</span><span class="mi">3</span><span class="p">])</span>
<span class="n">np</span><span class="p">.</span><span class="n">random</span><span class="p">.</span><span class="n">seed</span><span class="p">(</span><span class="mi">100</span><span class="p">)</span>
<span class="n">the_data_2d</span><span class="p">[</span><span class="n">np</span><span class="p">.</span><span class="n">random</span><span class="p">.</span><span class="n">randint</span><span class="p">(</span><span class="mi">150</span><span class="p">,</span><span class="n">size</span><span class="o">=</span><span class="mi">20</span><span class="p">),</span><span class="n">np</span><span class="p">.</span><span class="n">random</span><span class="p">.</span><span class="n">randint</span><span class="p">(</span><span class="mi">4</span><span class="p">,</span><span class="n">size</span><span class="o">=</span><span class="mi">20</span><span class="p">)]</span> <span class="o">=</span> <span class="n">np</span><span class="p">.</span><span class="n">nan</span>
</code></pre></div></div>

<h4>Desire output</h4>

<div class="language-python highlighter-rouge"><div class="highlight"><pre class="highlight"><code><span class="c1">#True
</span></code></pre></div></div>

<h4>Solution</h4>

<div class="language-python highlighter-rouge"><div class="highlight"><pre class="highlight"><code><span class="n">np</span><span class="p">.</span><span class="n">isnan</span><span class="p">(</span><span class="n">the_data_2d</span><span class="p">).</span><span class="nb">any</span><span class="p">()</span>
</code></pre></div></div>

<div class="language-plaintext highlighter-rouge"><div class="highlight"><pre class="highlight"><code>True
</code></pre></div></div>

<p>We use the isnan method to get back an array of boolean where True is a nan value, and False is any other value other than nan. We apply the any method to the boolean array which will return True because there is at least one True value in the boolean array.</p>

<h3>Ex 40: Replace all nan values by 0 in the array</h3>

<p>Q: Replace all the occurrences of nan by 0 in the array.</p>

<div class="language-python highlighter-rouge"><div class="highlight"><pre class="highlight"><code><span class="n">url</span> <span class="o">=</span> <span class="s">'https://archive.ics.uci.edu/ml/machine-learning-databases/iris/iris.data'</span>
<span class="n">the_data_2d</span> <span class="o">=</span> <span class="n">np</span><span class="p">.</span><span class="n">genfromtxt</span><span class="p">(</span><span class="n">url</span><span class="p">,</span> <span class="n">delimiter</span><span class="o">=</span><span class="s">','</span><span class="p">,</span> <span class="n">dtype</span><span class="o">=</span><span class="s">'float'</span><span class="p">,</span> <span class="n">usecols</span><span class="o">=</span><span class="p">[</span><span class="mi">0</span><span class="p">,</span><span class="mi">1</span><span class="p">,</span><span class="mi">2</span><span class="p">,</span><span class="mi">3</span><span class="p">])</span>
<span class="n">np</span><span class="p">.</span><span class="n">random</span><span class="p">.</span><span class="n">seed</span><span class="p">(</span><span class="mi">100</span><span class="p">)</span>
<span class="c1">#injecting nan values
</span><span class="n">the_data_2d</span><span class="p">[</span><span class="n">np</span><span class="p">.</span><span class="n">random</span><span class="p">.</span><span class="n">randint</span><span class="p">(</span><span class="mi">150</span><span class="p">,</span><span class="n">size</span><span class="o">=</span><span class="mi">20</span><span class="p">),</span><span class="n">np</span><span class="p">.</span><span class="n">random</span><span class="p">.</span><span class="n">randint</span><span class="p">(</span><span class="mi">4</span><span class="p">,</span><span class="n">size</span><span class="o">=</span><span class="mi">20</span><span class="p">)]</span> <span class="o">=</span> <span class="n">np</span><span class="p">.</span><span class="n">nan</span>
</code></pre></div></div>

<h4>Desire output</h4>

<div class="language-python highlighter-rouge"><div class="highlight"><pre class="highlight"><code><span class="c1">#the_data_2d[:10]
# array([[5.1, 3.5, 1.4, 0.2],
#        [4.9, 3. , 1.4, 0.2],
#        [4.7, 3.2, 1.3, 0.2],
#        [4.6, 3.1, 1.5, 0.2],
#        [5. , 3.6, 1.4, 0.2],
#        [5.4, 3.9, 1.7, 0.4],
#        [4.6, 3.4, 1.4, 0.3],
#        [5. , 3.4, 1.5, 0.2],
#        [4.4, 0. , 1.4, 0.2],
#        [4.9, 3.1, 1.5, 0.1]])
</span></code></pre></div></div>

<h4>Solution</h4>

<div class="language-python highlighter-rouge"><div class="highlight"><pre class="highlight"><code><span class="n">the_data_2d</span><span class="p">[</span><span class="n">np</span><span class="p">.</span><span class="n">isnan</span><span class="p">(</span><span class="n">the_data_2d</span><span class="p">)]</span> <span class="o">=</span> <span class="mi">0</span>
</code></pre></div></div>

<div class="language-python highlighter-rouge"><div class="highlight"><pre class="highlight"><code><span class="n">the_data_2d</span><span class="p">[:</span><span class="mi">10</span><span class="p">]</span>
</code></pre></div></div>

<div class="language-plaintext highlighter-rouge"><div class="highlight"><pre class="highlight"><code>array([[5.1, 3.5, 1.4, 0.2],
       [4.9, 3. , 1.4, 0.2],
       [4.7, 3.2, 1.3, 0.2],
       [4.6, 3.1, 1.5, 0.2],
       [5. , 3.6, 1.4, 0.2],
       [5.4, 3.9, 1.7, 0.4],
       [4.6, 3.4, 1.4, 0.3],
       [5. , 3.4, 1.5, 0.2],
       [4.4, 0. , 1.4, 0.2],
       [4.9, 3.1, 1.5, 0.1]])
</code></pre></div></div>

<p>We used the isnan method again to get back all the instances of nan, then replace each of these instances by assigning 0 to the indexed array.</p>

<h3>Conclusion</h3>

<p>By now, you should have a great understanding of NumPy and most importantly, how you can use Google and the NumPy’s documentation to see how to perform a specific task in NumPy.</p>

<p>If you were able to do half of these exercises from these two posts, congratulation!! I am confident to tell you that you can start using NumPy into your ML projects. Most ML projects won’t require advanced NumPy knowledge than this. The last post from these series is coming soon. It has some advanced NumPy exercises for those who want to master NumPy.</p>

<p>Find the jupyter notebook version of this post on my GitHub profile <a href="https://github.com/semasuka/blog/blob/gh-pages/ipynb/NumPy%20Exercises%20Part%202.ipynb" target="_blank">here.</a></p>

<p>Thank you for doing these exercises with me. I hope you have learned one or two things. If you like this post, please subscribe to stay updated with new posts, and if you have a thought or a question, I would love to hear it by commenting below. Remember keep learning!</p>]]></content><author><name>Stern Semasuka</name></author><category term="python" /><category term="exercises" /><category term="numpy" /><summary type="html"><![CDATA[For this second post of NumPy exercises series, we will be doing intermediate level exercises in NumPy and will go through the solution together as we did in the first part. Try to solve the exercises on your own then compare your answer with mine. Let’s get started.]]></summary><media:thumbnail xmlns:media="http://search.yahoo.com/mrss/" url="https://semasuka.github.io/blog/blog/assets/post_images/numpy.png" /><media:content medium="image" url="https://semasuka.github.io/blog/blog/assets/post_images/numpy.png" xmlns:media="http://search.yahoo.com/mrss/" /></entry><entry><title type="html">NumPy Exercises Part 1</title><link href="https://semasuka.github.io/blog/blog/2019/08/11/numpy-exercises-part-1.html" rel="alternate" type="text/html" title="NumPy Exercises Part 1" /><published>2019-08-11T00:00:00+00:00</published><updated>2019-08-11T00:00:00+00:00</updated><id>https://semasuka.github.io/blog/blog/2019/08/11/numpy-exercises-part-1</id><content type="html" xml:base="https://semasuka.github.io/blog/blog/2019/08/11/numpy-exercises-part-1.html"><![CDATA[<p>In this post, we will be solving 20 exercises in NumPy to sharpen what you have learnt from the NumPy introduction post. If you have not read the NumPy post, I highly encourage to go first through that post <a href="https://semasuka.github.io/blog/2019/07/21/numpy-crash-course.html" target="_blank">on this link</a> and then come back to try out the exercises.<!-- more --></p>

<p>Before we start, please allow me to give you some update about the blog. It is with an honour that I am announcing that MIB has been ranked among the top 40 Machine Learning blog to follow in 2019 alongside some very known Machine Learning blog like Google Machine Learning News, MIT News, Machine Learning Mastery and many more great blogs. To see the full list, please visit this <a href="https://blog.feedspot.com/machine_learning_blogs/" target="_blank">link</a>.</p>

<p>As of the time of writing this post, MIB is just 8 months old and has been ranked already among the top 40 ML blogs. I want to thank all the readers of this blog and Feedspot because you are, indeed my motivation to keep on posting and learning ML. Many of you had asked me how they could support the blog; now you can donate by scrolling to the bottom of the about page <a href="https://semasuka.github.io/blog/about/" target="_blank">here</a>.</p>

<p>I am also taking this occasion to tell you a little bit about Feedspot, Feedspot is for all of us who have busy lives and don’t have the time to check the contents/news from each one of our favourite platforms like blog, RSS, YouTube channel, Podcast, Magazine and many more, Feedspot will take care of all the contents and compile them in one place for you and save you time. Please visit the website at <a href="https://www.feedspot.com/" target="_blank">https://www.feedspot.com/</a>.</p>

<p>Now let get back to work; this first part of NumPy exercises posts series is composed of relatively easy exercise compared to part 2. Part 3 will be composed of intermediate and advanced level exercises. These exercises are inspired from <a href="https://www.machinelearningplus.com/python/101-numpy-exercises-python/" target="_blank">this</a> fantastic blog post and I want to give credit to the author of their amazing work, but unfortunately, there are no explanations of the “why” which is the most important thing to understand when trying to grasp a new concept, so I will try to explain in my solutions.</p>

<p>Here is how we will proceed for these series of exercises, I will first post the exercise then you will go and try on your own, only after trying you shall come back and compare your result with mine. Do not cheat ;p</p>

<p>If you can’t solve the challenge after giving all your best, it is ok to come back and check the solution. Don’t feel bad about it; that is how everyone learns, yes! by failling first and figure it out after but most importantly try to understand how the exercise is solved. If you still don’t understand, jump at the comments section below and ask me the question, I will happy to assist you as much as I can.</p>

<p>Note: You will also need to do a little bit of research online for some of the exercises, which is a good thing because googling is an art you must learn and practice as programmer. Use also the handy <a href="https://numpy.org/devdocs/" target="_blank">NumPy’s documentation</a>. An exercise will most likely have more than one way to solve it, as long as the desired output is the same as the solution. You’re good!</p>

<h3>Ex 1: Import NumPy and check its version</h3>

<p>Q: For our first exercise, we will import NumPy library simple right? also, print its version</p>

<h4>Solution</h4>

<div class="language-python highlighter-rouge"><div class="highlight"><pre class="highlight"><code><span class="kn">import</span> <span class="nn">numpy</span> <span class="k">as</span> <span class="n">np</span>
</code></pre></div></div>

<p>Before using NumPy anywhere, you must import it.</p>

<p>I hope this one, everyone got it right and you could have called NumPy anything else, but np is what is commonly accepted.</p>

<div class="language-python highlighter-rouge"><div class="highlight"><pre class="highlight"><code><span class="k">print</span><span class="p">(</span><span class="n">np</span><span class="p">.</span><span class="n">version</span><span class="p">.</span><span class="n">version</span><span class="p">)</span>
</code></pre></div></div>

<div class="language-plaintext highlighter-rouge"><div class="highlight"><pre class="highlight"><code>1.16.4
</code></pre></div></div>

<p>Now to see which version of NumPy we are using, we the version method twice on the NumPy.</p>

<h3>Ex 2: Create a one-dimensional NumPy array</h3>

<p>Q: Now let’s create a one-dimensional NumPy array from 0 to 9.</p>

<h4>Desired output:</h4>

<div class="language-python highlighter-rouge"><div class="highlight"><pre class="highlight"><code><span class="c1"># [0 1 2 3 4 5 6 7 8 9]
</span></code></pre></div></div>

<h4>Solution</h4>

<div class="language-python highlighter-rouge"><div class="highlight"><pre class="highlight"><code><span class="n">my_arr</span> <span class="o">=</span> <span class="n">np</span><span class="p">.</span><span class="n">arange</span><span class="p">(</span><span class="mi">10</span><span class="p">)</span>
<span class="k">print</span><span class="p">(</span><span class="n">my_arr</span><span class="p">)</span>
</code></pre></div></div>

<div class="language-plaintext highlighter-rouge"><div class="highlight"><pre class="highlight"><code>[0 1 2 3 4 5 6 7 8 9]
</code></pre></div></div>

<p>We use the arange method to generate a sequence from 0 to 9.</p>

<h3>Ex 3: Create a boolean NumPy array</h3>

<p>Q: Let’s create a three-dimensional array composed each of three boolean True value elements (3X3).</p>

<h4>Desired output:</h4>

<div class="language-python highlighter-rouge"><div class="highlight"><pre class="highlight"><code><span class="c1"># [[ True  True  True]
# [ True  True  True]
# [ True  True  True]]
</span></code></pre></div></div>

<h4>Solution</h4>

<div class="language-python highlighter-rouge"><div class="highlight"><pre class="highlight"><code><span class="n">my_arr</span> <span class="o">=</span> <span class="n">np</span><span class="p">.</span><span class="n">full</span><span class="p">((</span><span class="mi">3</span><span class="p">,</span><span class="mi">3</span><span class="p">),</span><span class="bp">True</span><span class="p">)</span>
<span class="k">print</span><span class="p">(</span><span class="n">my_arr</span><span class="p">)</span>
</code></pre></div></div>

<div class="language-plaintext highlighter-rouge"><div class="highlight"><pre class="highlight"><code>[[ True  True  True]
 [ True  True  True]
 [ True  True  True]]
</code></pre></div></div>

<p>We used the full method and passed in as the first argument, the shape of the array, and as the second argument, the value that will populate the array.</p>

<h3>Ex 4: Extract elements in a one-dimension array given specific condition</h3>

<p>Q: Let’s extract only even numbers from the following array.</p>

<div class="language-python highlighter-rouge"><div class="highlight"><pre class="highlight"><code><span class="n">my_arr</span> <span class="o">=</span> <span class="n">np</span><span class="p">.</span><span class="n">arange</span><span class="p">(</span><span class="mi">1</span><span class="p">,</span><span class="mi">21</span><span class="p">)</span>
<span class="k">print</span><span class="p">(</span><span class="n">my_arr</span><span class="p">)</span>
</code></pre></div></div>

<div class="language-plaintext highlighter-rouge"><div class="highlight"><pre class="highlight"><code>[ 1  2  3  4  5  6  7  8  9 10 11 12 13 14 15 16 17 18 19 20]
</code></pre></div></div>

<h4>Desired output:</h4>

<div class="language-python highlighter-rouge"><div class="highlight"><pre class="highlight"><code><span class="c1"># [ 2  4  6  8 10 12 14 16 18 20]
</span></code></pre></div></div>

<h4>Solution</h4>

<div class="language-python highlighter-rouge"><div class="highlight"><pre class="highlight"><code><span class="n">even_array</span> <span class="o">=</span> <span class="n">my_arr</span><span class="p">[</span><span class="n">my_arr</span><span class="o">%</span><span class="mi">2</span><span class="o">==</span><span class="mi">0</span><span class="p">]</span>
</code></pre></div></div>

<div class="language-python highlighter-rouge"><div class="highlight"><pre class="highlight"><code><span class="k">print</span><span class="p">(</span><span class="n">even_array</span><span class="p">)</span>
</code></pre></div></div>

<div class="language-plaintext highlighter-rouge"><div class="highlight"><pre class="highlight"><code>[ 2  4  6  8 10 12 14 16 18 20]
</code></pre></div></div>

<p>We use indexing with a condition as the argument. For the condition to be True, it is required that for each element modulo 2 to be equal to 0. Modulo is the remainder(the rest) from the division of each element in the array with the divisor. In our case, the divisor is 2, and if the rest is 0, then we know that it is True because only even numbers divided by 2 return 0. Using this technique, we were able to get back all the even numbers in the array.</p>

<h3>Ex 5: Replace elements in a one-dimension array given specific condition</h3>

<p>Q: Let’s replace each odd number from the following array with a -1.</p>

<div class="language-python highlighter-rouge"><div class="highlight"><pre class="highlight"><code><span class="n">my_arr</span> <span class="o">=</span> <span class="n">np</span><span class="p">.</span><span class="n">arange</span><span class="p">(</span><span class="mi">1</span><span class="p">,</span><span class="mi">21</span><span class="p">)</span>
<span class="k">print</span><span class="p">(</span><span class="n">my_arr</span><span class="p">)</span>
</code></pre></div></div>

<div class="language-plaintext highlighter-rouge"><div class="highlight"><pre class="highlight"><code>[ 1  2  3  4  5  6  7  8  9 10 11 12 13 14 15 16 17 18 19 20]
</code></pre></div></div>

<h4>Desired output</h4>

<div class="language-python highlighter-rouge"><div class="highlight"><pre class="highlight"><code><span class="c1"># [-1  2 -1  4 -1  6 -1  8 -1 10 -1 12 -1 14 -1 16 -1 18 -1 20]
</span></code></pre></div></div>

<h4>Solution</h4>

<div class="language-python highlighter-rouge"><div class="highlight"><pre class="highlight"><code><span class="n">odd_array</span> <span class="o">=</span> <span class="p">(</span><span class="n">my_arr</span><span class="o">%</span><span class="mi">2</span><span class="o">!=</span><span class="mi">0</span><span class="p">)</span>
</code></pre></div></div>

<div class="language-python highlighter-rouge"><div class="highlight"><pre class="highlight"><code><span class="n">my_arr</span><span class="p">[</span><span class="n">odd_array</span><span class="p">]</span> <span class="o">=</span> <span class="o">-</span><span class="mi">1</span>
</code></pre></div></div>

<div class="language-python highlighter-rouge"><div class="highlight"><pre class="highlight"><code><span class="k">print</span><span class="p">(</span><span class="n">my_arr</span><span class="p">)</span>
</code></pre></div></div>

<div class="language-plaintext highlighter-rouge"><div class="highlight"><pre class="highlight"><code>[-1  2 -1  4 -1  6 -1  8 -1 10 -1 12 -1 14 -1 16 -1 18 -1 20]
</code></pre></div></div>

<p>We first get a boolean array that returns True if the element is odd or return False if the element is even using modulus by 2. After getting the boolean array, we use indexing on the original array and set it to -1 which will replace all the position where there is a True value by -1.</p>

<h3>Ex 6: Replace elements in a one-dimension array given particular condition without affecting the original array</h3>

<p>Q: Same question as to the previous one, just that this time the original array should not be changed.</p>

<div class="language-python highlighter-rouge"><div class="highlight"><pre class="highlight"><code><span class="n">my_arr</span> <span class="o">=</span> <span class="n">np</span><span class="p">.</span><span class="n">arange</span><span class="p">(</span><span class="mi">1</span><span class="p">,</span><span class="mi">21</span><span class="p">)</span>
<span class="k">print</span><span class="p">(</span><span class="n">my_arr</span><span class="p">)</span>
</code></pre></div></div>

<div class="language-plaintext highlighter-rouge"><div class="highlight"><pre class="highlight"><code>[ 1  2  3  4  5  6  7  8  9 10 11 12 13 14 15 16 17 18 19 20]
</code></pre></div></div>

<h4>Desired output</h4>

<div class="language-python highlighter-rouge"><div class="highlight"><pre class="highlight"><code><span class="c1"># new_arr
# [-1  2 -1  4 -1  6 -1  8 -1 10 -1 12 -1 14 -1 16 -1 18 -1 20]
# my_arr
# [ 1  2  3  4  5  6  7  8  9 10 11 12 13 14 15 16 17 18 19 20]
</span></code></pre></div></div>

<h4>Solution</h4>

<h4>1st Method</h4>

<div class="language-python highlighter-rouge"><div class="highlight"><pre class="highlight"><code><span class="n">odd_array</span> <span class="o">=</span> <span class="p">(</span><span class="n">my_arr</span><span class="o">%</span><span class="mi">2</span><span class="o">!=</span><span class="mi">0</span><span class="p">)</span>
</code></pre></div></div>

<div class="language-python highlighter-rouge"><div class="highlight"><pre class="highlight"><code><span class="n">new_array</span> <span class="o">=</span> <span class="n">my_arr</span><span class="p">.</span><span class="n">copy</span><span class="p">()</span>
<span class="n">new_array</span><span class="p">[</span><span class="n">odd_array</span><span class="p">]</span> <span class="o">=</span> <span class="o">-</span><span class="mi">1</span>
</code></pre></div></div>

<div class="language-python highlighter-rouge"><div class="highlight"><pre class="highlight"><code><span class="k">print</span><span class="p">(</span><span class="n">new_array</span><span class="p">)</span>
</code></pre></div></div>

<div class="language-plaintext highlighter-rouge"><div class="highlight"><pre class="highlight"><code>[-1  2 -1  4 -1  6 -1  8 -1 10 -1 12 -1 14 -1 16 -1 18 -1 20]
</code></pre></div></div>

<div class="language-python highlighter-rouge"><div class="highlight"><pre class="highlight"><code><span class="k">print</span><span class="p">(</span><span class="n">my_arr</span><span class="p">)</span>
</code></pre></div></div>

<div class="language-plaintext highlighter-rouge"><div class="highlight"><pre class="highlight"><code>[ 1  2  3  4  5  6  7  8  9 10 11 12 13 14 15 16 17 18 19 20]
</code></pre></div></div>

<p>This example is very similar to the previous one, the only difference is that instead of using the indexing on the original array, we are using a copy of the original array which won’t be affected at all by the changes.</p>

<h4>2nd Method</h4>

<div class="language-python highlighter-rouge"><div class="highlight"><pre class="highlight"><code><span class="n">new_array</span> <span class="o">=</span> <span class="n">np</span><span class="p">.</span><span class="n">where</span><span class="p">(</span><span class="n">my_arr</span><span class="o">%</span><span class="mi">2</span> <span class="o">!=</span> <span class="mi">0</span><span class="p">,</span><span class="o">-</span><span class="mi">1</span><span class="p">,</span><span class="n">my_arr</span><span class="p">)</span>
</code></pre></div></div>

<div class="language-python highlighter-rouge"><div class="highlight"><pre class="highlight"><code><span class="k">print</span><span class="p">(</span><span class="n">new_array</span><span class="p">)</span>
</code></pre></div></div>

<div class="language-plaintext highlighter-rouge"><div class="highlight"><pre class="highlight"><code>[-1  2 -1  4 -1  6 -1  8 -1 10 -1 12 -1 14 -1 16 -1 18 -1 20]
</code></pre></div></div>

<p>There is a handy where method, which can is more concise than the first method. We first pass the condition, then the value to use where the condition was evaluated to True and finally, the original array.</p>

<h3>Ex 7: Reshape an array</h3>

<p>Q: Let’s change a one-dimensional array into a two-dimensional array with two rows.</p>

<div class="language-python highlighter-rouge"><div class="highlight"><pre class="highlight"><code><span class="n">my_arr</span> <span class="o">=</span> <span class="n">np</span><span class="p">.</span><span class="n">arange</span><span class="p">(</span><span class="mi">1</span><span class="p">,</span><span class="mi">41</span><span class="p">)</span>
</code></pre></div></div>

<div class="language-python highlighter-rouge"><div class="highlight"><pre class="highlight"><code><span class="k">print</span><span class="p">(</span><span class="n">my_arr</span><span class="p">)</span>
</code></pre></div></div>

<div class="language-plaintext highlighter-rouge"><div class="highlight"><pre class="highlight"><code>[ 1  2  3  4  5  6  7  8  9 10 11 12 13 14 15 16 17 18 19 20 21 22 23 24
 25 26 27 28 29 30 31 32 33 34 35 36 37 38 39 40]
</code></pre></div></div>

<h4>Desired output</h4>

<div class="language-python highlighter-rouge"><div class="highlight"><pre class="highlight"><code><span class="c1"># my_array
# [[ 1  2  3  4  5  6  7  8  9 10 11 12 13 14 15 16 17 18 19 20]
# [21 22 23 24 25 26 27 28 29 30 31 32 33 34 35 36 37 38 39 40]]
</span></code></pre></div></div>

<h4>Solution</h4>

<h4>1st Method</h4>

<div class="language-python highlighter-rouge"><div class="highlight"><pre class="highlight"><code><span class="n">resh_arr</span> <span class="o">=</span> <span class="n">my_arr</span><span class="p">.</span><span class="n">reshape</span><span class="p">((</span><span class="mi">2</span><span class="p">,</span><span class="mi">20</span><span class="p">))</span>
</code></pre></div></div>

<div class="language-python highlighter-rouge"><div class="highlight"><pre class="highlight"><code><span class="k">print</span><span class="p">(</span><span class="n">resh_arr</span><span class="p">)</span>
</code></pre></div></div>

<div class="language-plaintext highlighter-rouge"><div class="highlight"><pre class="highlight"><code>[[ 1  2  3  4  5  6  7  8  9 10 11 12 13 14 15 16 17 18 19 20]
 [21 22 23 24 25 26 27 28 29 30 31 32 33 34 35 36 37 38 39 40]]
</code></pre></div></div>

<p>We have applied the reshape method to the original array, pass in as argument a tuple with a first number being the number of rows and the second number being the number of elements in each row.</p>

<p>Note: Remember that the number of elements must fit in the rows. Here is a formula that can help you reshape an array and avoid errors. The number of elements in 1D = number of row in nD X number of elements in each row.</p>

<h4>2nd Method</h4>

<p>We can avoid all the hustle of figuring out how to fit the elements in the row with the correct numbers of row and column, we can use just -1 as the second argument in the tuple. Using -1, NumPy will figure out how many elements need to be placed in each array depending on the number of rows.</p>

<div class="language-python highlighter-rouge"><div class="highlight"><pre class="highlight"><code><span class="n">resh_arr</span> <span class="o">=</span> <span class="n">my_arr</span><span class="p">.</span><span class="n">reshape</span><span class="p">((</span><span class="mi">2</span><span class="p">,</span><span class="o">-</span><span class="mi">1</span><span class="p">))</span>
</code></pre></div></div>

<div class="language-python highlighter-rouge"><div class="highlight"><pre class="highlight"><code><span class="k">print</span><span class="p">(</span><span class="n">resh_arr</span><span class="p">)</span>
</code></pre></div></div>

<div class="language-plaintext highlighter-rouge"><div class="highlight"><pre class="highlight"><code>[[ 1  2  3  4  5  6  7  8  9 10 11 12 13 14 15 16 17 18 19 20]
 [21 22 23 24 25 26 27 28 29 30 31 32 33 34 35 36 37 38 39 40]]
</code></pre></div></div>

<p>Let’s do another example.</p>

<div class="language-python highlighter-rouge"><div class="highlight"><pre class="highlight"><code><span class="n">resh_arr</span> <span class="o">=</span> <span class="n">my_arr</span><span class="p">.</span><span class="n">reshape</span><span class="p">((</span><span class="mi">4</span><span class="p">,</span><span class="o">-</span><span class="mi">1</span><span class="p">))</span>
</code></pre></div></div>

<div class="language-python highlighter-rouge"><div class="highlight"><pre class="highlight"><code><span class="k">print</span><span class="p">(</span><span class="n">resh_arr</span><span class="p">)</span>
</code></pre></div></div>

<div class="language-plaintext highlighter-rouge"><div class="highlight"><pre class="highlight"><code>[[ 1  2  3  4  5  6  7  8  9 10]
 [11 12 13 14 15 16 17 18 19 20]
 [21 22 23 24 25 26 27 28 29 30]
 [31 32 33 34 35 36 37 38 39 40]]
</code></pre></div></div>

<p>Using -1 as the second parameter in the tuple, NumPy has figured out that to have a four-dimensional array; each array needs to have 10 elements each.</p>

<h3>Ex 8: Stack arrays together vertically</h3>

<p>Q: Let’s stack two arrays together vertically (row-wise) to form one array.</p>

<div class="language-python highlighter-rouge"><div class="highlight"><pre class="highlight"><code><span class="n">my_arr_1</span> <span class="o">=</span> <span class="n">np</span><span class="p">.</span><span class="n">arange</span><span class="p">(</span><span class="mi">1</span><span class="p">,</span><span class="mi">21</span><span class="p">).</span><span class="n">reshape</span><span class="p">(</span><span class="mi">2</span><span class="p">,</span><span class="o">-</span><span class="mi">1</span><span class="p">)</span>
<span class="n">my_arr_2</span> <span class="o">=</span> <span class="n">np</span><span class="p">.</span><span class="n">arange</span><span class="p">(</span><span class="mi">21</span><span class="p">,</span><span class="mi">41</span><span class="p">).</span><span class="n">reshape</span><span class="p">(</span><span class="mi">2</span><span class="p">,</span><span class="o">-</span><span class="mi">1</span><span class="p">)</span>
</code></pre></div></div>

<h4>Desired output</h4>

<div class="language-python highlighter-rouge"><div class="highlight"><pre class="highlight"><code><span class="c1"># [[ 1  2  3  4  5  6  7  8  9 10]
#  [11 12 13 14 15 16 17 18 19 20]
#  [21 22 23 24 25 26 27 28 29 30]
#  [31 32 33 34 35 36 37 38 39 40]]
</span></code></pre></div></div>

<h4>Solution</h4>

<h4>1st Method</h4>

<div class="language-python highlighter-rouge"><div class="highlight"><pre class="highlight"><code><span class="n">my_arr_3</span> <span class="o">=</span> <span class="n">np</span><span class="p">.</span><span class="n">vstack</span><span class="p">((</span><span class="n">my_arr_1</span><span class="p">,</span><span class="n">my_arr_2</span><span class="p">))</span>
</code></pre></div></div>

<div class="language-python highlighter-rouge"><div class="highlight"><pre class="highlight"><code><span class="k">print</span><span class="p">(</span><span class="n">my_arr_3</span><span class="p">)</span>
</code></pre></div></div>

<div class="language-plaintext highlighter-rouge"><div class="highlight"><pre class="highlight"><code>[[ 1  2  3  4  5  6  7  8  9 10]
 [11 12 13 14 15 16 17 18 19 20]
 [21 22 23 24 25 26 27 28 29 30]
 [31 32 33 34 35 36 37 38 39 40]]
</code></pre></div></div>

<p>the vstack method stack together arrays vertically.</p>

<p>Note: if two arrays don’t have the same number of columns, they can not stack together vertically.</p>

<div class="language-python highlighter-rouge"><div class="highlight"><pre class="highlight"><code><span class="n">my_arr_4</span> <span class="o">=</span> <span class="n">np</span><span class="p">.</span><span class="n">arange</span><span class="p">(</span><span class="mi">1</span><span class="p">,</span><span class="mi">16</span><span class="p">).</span><span class="n">reshape</span><span class="p">(</span><span class="mi">3</span><span class="p">,</span><span class="o">-</span><span class="mi">1</span><span class="p">)</span>
</code></pre></div></div>

<div class="language-plaintext highlighter-rouge"><div class="highlight"><pre class="highlight"><code>array([[ 1,  2,  3,  4,  5],
       [ 6,  7,  8,  9, 10],
       [11, 12, 13, 14, 15]])
</code></pre></div></div>

<div class="language-python highlighter-rouge"><div class="highlight"><pre class="highlight"><code><span class="n">my_arr_5</span> <span class="o">=</span> <span class="n">np</span><span class="p">.</span><span class="n">vstack</span><span class="p">((</span><span class="n">my_arr_1</span><span class="p">,</span><span class="n">my_arr_4</span><span class="p">))</span>
</code></pre></div></div>

<div class="language-plaintext highlighter-rouge"><div class="highlight"><pre class="highlight"><code>---------------------------------------------------------------------------

ValueError                                Traceback (most recent call last)

&lt;ipython-input-189-f8c619030909&gt; in &lt;module&gt;
----&gt; 1 my_arr_5 = np.vstack((my_arr_1,my_arr_4))


/anaconda3/lib/python3.7/site-packages/numpy/core/shape_base.py in vstack(tup)
    281     """
    282     _warn_for_nonsequence(tup)
--&gt; 283     return _nx.concatenate([atleast_2d(_m) for _m in tup], 0)
    284 
    285 


ValueError: all the input array dimensions except for the concatenation axis must match exactly
</code></pre></div></div>

<p>my_arr_4 with 5 columns can not be concatenated with my_arr_1 which has 10 columns.</p>

<h4>2nd Method</h4>

<div class="language-python highlighter-rouge"><div class="highlight"><pre class="highlight"><code><span class="n">my_arr_3</span> <span class="o">=</span> <span class="n">np</span><span class="p">.</span><span class="n">concatenate</span><span class="p">((</span><span class="n">my_arr_1</span><span class="p">,</span><span class="n">my_arr_2</span><span class="p">),</span><span class="n">axis</span><span class="o">=</span><span class="mi">0</span><span class="p">)</span>
</code></pre></div></div>

<div class="language-python highlighter-rouge"><div class="highlight"><pre class="highlight"><code><span class="k">print</span><span class="p">(</span><span class="n">my_arr_3</span><span class="p">)</span>
</code></pre></div></div>

<div class="language-plaintext highlighter-rouge"><div class="highlight"><pre class="highlight"><code>[[ 1  2  3  4  5  6  7  8  9 10]
 [11 12 13 14 15 16 17 18 19 20]
 [21 22 23 24 25 26 27 28 29 30]
 [31 32 33 34 35 36 37 38 39 40]]
</code></pre></div></div>

<p>We can achieve the same result using the concatenate method; we must pass another argument, which is the axis. If we set the axis to 0, this means that we are stacking the array vertically (row-wise) and if we set it to 1, this means that we are stacking the array horizontally (column-wise).</p>

<h3>Ex 9: Stack arrays together horizontally</h3>

<p>Q: Let’s stack two arrays together horizontally (column-wise) to form one array.</p>

<div class="language-python highlighter-rouge"><div class="highlight"><pre class="highlight"><code><span class="n">my_arr_1</span> <span class="o">=</span> <span class="n">np</span><span class="p">.</span><span class="n">arange</span><span class="p">(</span><span class="mi">1</span><span class="p">,</span><span class="mi">21</span><span class="p">).</span><span class="n">reshape</span><span class="p">(</span><span class="mi">2</span><span class="p">,</span><span class="o">-</span><span class="mi">1</span><span class="p">)</span>
<span class="n">my_arr_2</span> <span class="o">=</span> <span class="n">np</span><span class="p">.</span><span class="n">arange</span><span class="p">(</span><span class="mi">21</span><span class="p">,</span><span class="mi">41</span><span class="p">).</span><span class="n">reshape</span><span class="p">(</span><span class="mi">2</span><span class="p">,</span><span class="o">-</span><span class="mi">1</span><span class="p">)</span>
</code></pre></div></div>

<h4>Desired output</h4>

<div class="language-python highlighter-rouge"><div class="highlight"><pre class="highlight"><code><span class="c1"># [[ 1  2  3  4  5  6  7  8  9 10 21 22 23 24 25 26 27 28 29 30]
#  [11 12 13 14 15 16 17 18 19 20 31 32 33 34 35 36 37 38 39 40]]
</span></code></pre></div></div>

<h4>Solution</h4>

<h4>1st Method</h4>

<div class="language-python highlighter-rouge"><div class="highlight"><pre class="highlight"><code><span class="n">my_arr_3</span> <span class="o">=</span> <span class="n">np</span><span class="p">.</span><span class="n">hstack</span><span class="p">((</span><span class="n">my_arr_1</span><span class="p">,</span><span class="n">my_arr_2</span><span class="p">))</span>
</code></pre></div></div>

<div class="language-python highlighter-rouge"><div class="highlight"><pre class="highlight"><code><span class="k">print</span><span class="p">(</span><span class="n">my_arr_3</span><span class="p">)</span>
</code></pre></div></div>

<div class="language-plaintext highlighter-rouge"><div class="highlight"><pre class="highlight"><code>[[ 1  2  3  4  5  6  7  8  9 10 21 22 23 24 25 26 27 28 29 30]
 [11 12 13 14 15 16 17 18 19 20 31 32 33 34 35 36 37 38 39 40]]
</code></pre></div></div>

<p>Same as we did with the vstack method, we can do the same using the hstack method this time to stack horizontally.</p>

<h4>2nd Method</h4>

<div class="language-python highlighter-rouge"><div class="highlight"><pre class="highlight"><code><span class="n">my_arr_3</span> <span class="o">=</span> <span class="n">np</span><span class="p">.</span><span class="n">concatenate</span><span class="p">((</span><span class="n">my_arr_1</span><span class="p">,</span><span class="n">my_arr_2</span><span class="p">),</span><span class="n">axis</span><span class="o">=</span><span class="mi">1</span><span class="p">)</span>
</code></pre></div></div>

<div class="language-python highlighter-rouge"><div class="highlight"><pre class="highlight"><code><span class="k">print</span><span class="p">(</span><span class="n">my_arr_3</span><span class="p">)</span>
</code></pre></div></div>

<div class="language-plaintext highlighter-rouge"><div class="highlight"><pre class="highlight"><code>[[ 1  2  3  4  5  6  7  8  9 10 21 22 23 24 25 26 27 28 29 30]
 [11 12 13 14 15 16 17 18 19 20 31 32 33 34 35 36 37 38 39 40]]
</code></pre></div></div>

<p>We can use concatenate; we need only to set the axis to 1.</p>

<h3>Ex 10: Generate a sequence without hardcoding</h3>

<p>Q: Create the following sequence given my_arr array with only numpy methods. No hardcoding.</p>

<div class="language-python highlighter-rouge"><div class="highlight"><pre class="highlight"><code><span class="n">my_arr</span> <span class="o">=</span> <span class="n">np</span><span class="p">.</span><span class="n">array</span><span class="p">([</span><span class="mi">11</span><span class="p">,</span><span class="mi">22</span><span class="p">,</span><span class="mi">33</span><span class="p">])</span>
</code></pre></div></div>

<h4>Desired output</h4>

<div class="language-python highlighter-rouge"><div class="highlight"><pre class="highlight"><code><span class="c1">#[11 11 11 22 22 22 33 33 33 11 22 33 11 22 33]
</span></code></pre></div></div>

<h4>Solution</h4>

<div class="language-python highlighter-rouge"><div class="highlight"><pre class="highlight"><code><span class="n">trip_each</span> <span class="o">=</span> <span class="n">np</span><span class="p">.</span><span class="n">repeat</span><span class="p">(</span><span class="n">my_arr</span><span class="p">,</span><span class="mi">3</span><span class="p">)</span>
</code></pre></div></div>

<div class="language-python highlighter-rouge"><div class="highlight"><pre class="highlight"><code><span class="n">double_array</span> <span class="o">=</span> <span class="n">np</span><span class="p">.</span><span class="n">tile</span><span class="p">(</span><span class="n">my_arr</span><span class="p">,</span><span class="mi">2</span><span class="p">)</span>
</code></pre></div></div>

<div class="language-python highlighter-rouge"><div class="highlight"><pre class="highlight"><code><span class="n">final_arr</span> <span class="o">=</span> <span class="n">np</span><span class="p">.</span><span class="n">concatenate</span><span class="p">((</span><span class="n">trip_each</span><span class="p">,</span><span class="n">double_array</span><span class="p">),</span><span class="n">axis</span><span class="o">=</span><span class="mi">0</span><span class="p">)</span>
</code></pre></div></div>

<div class="language-python highlighter-rouge"><div class="highlight"><pre class="highlight"><code><span class="k">print</span><span class="p">(</span><span class="n">final_arr</span><span class="p">)</span>
</code></pre></div></div>

<div class="language-plaintext highlighter-rouge"><div class="highlight"><pre class="highlight"><code>[11 11 11 22 22 22 33 33 33 11 22 33 11 22 33]
</code></pre></div></div>

<p>In this example, we have used 3 different methods to achieve the desired result.</p>

<p>First, we used the repeat method to repeat each element in the array. The first argument in this method is the array itself, and the second argument is the number of repeats to be executed then store it in a variable.</p>

<p>Second is the tile method which will duplicate the entire array. The first argument will be the array, and the second will be how many times we repeat the array then store it in another variable.</p>

<p>The third method is the concatenate method, which does a concatenation of trip_each with double_array horizontally by setting the axis to 0 (column-wise).</p>

<h3>Ex 11: Get the common elements in arrays</h3>

<p>Q: Get common elements in two arrays</p>

<div class="language-python highlighter-rouge"><div class="highlight"><pre class="highlight"><code><span class="n">array_1</span> <span class="o">=</span> <span class="n">np</span><span class="p">.</span><span class="n">arange</span><span class="p">(</span><span class="mi">0</span><span class="p">,</span><span class="mi">31</span><span class="p">)</span>
<span class="n">array_2</span> <span class="o">=</span> <span class="n">np</span><span class="p">.</span><span class="n">arange</span><span class="p">(</span><span class="mi">20</span><span class="p">,</span><span class="mi">51</span><span class="p">)</span>
</code></pre></div></div>

<h4>Desire output</h4>

<div class="language-python highlighter-rouge"><div class="highlight"><pre class="highlight"><code><span class="c1"># [20 21 22 23 24 25 26 27 28 29 30]
</span></code></pre></div></div>

<h4>Solution</h4>

<div class="language-python highlighter-rouge"><div class="highlight"><pre class="highlight"><code><span class="n">inters_arr</span> <span class="o">=</span> <span class="n">np</span><span class="p">.</span><span class="n">intersect1d</span><span class="p">(</span><span class="n">array_1</span><span class="p">,</span><span class="n">array_2</span><span class="p">)</span>
</code></pre></div></div>

<div class="language-python highlighter-rouge"><div class="highlight"><pre class="highlight"><code><span class="k">print</span><span class="p">(</span><span class="n">inters_arr</span><span class="p">)</span>
</code></pre></div></div>

<div class="language-plaintext highlighter-rouge"><div class="highlight"><pre class="highlight"><code>[20 21 22 23 24 25 26 27 28 29 30]
</code></pre></div></div>

<p>The intersect1d method will return a new array composed of elements both present in the first and second array. We stored it in the inters_arr variable then printed it.</p>

<h3>Ex 12: Remove the elements that are found in the first arrays but not the second</h3>

<p>Q: Delete the elements that are present in the first array but not in the second array. In another world, we want to keep elements in the first array that are not present in the second array.</p>

<div class="language-python highlighter-rouge"><div class="highlight"><pre class="highlight"><code><span class="n">array_1</span> <span class="o">=</span> <span class="n">np</span><span class="p">.</span><span class="n">arange</span><span class="p">(</span><span class="mi">0</span><span class="p">,</span><span class="mi">31</span><span class="p">)</span>
<span class="n">array_2</span> <span class="o">=</span> <span class="n">np</span><span class="p">.</span><span class="n">arange</span><span class="p">(</span><span class="mi">20</span><span class="p">,</span><span class="mi">51</span><span class="p">)</span>
</code></pre></div></div>

<h4>Desire output</h4>

<div class="language-python highlighter-rouge"><div class="highlight"><pre class="highlight"><code><span class="c1"># [ 0  1  2  3  4  5  6  7  8  9 10 11 12 13 14 15 16 17 18 19]
</span></code></pre></div></div>

<h4>Solution</h4>

<div class="language-python highlighter-rouge"><div class="highlight"><pre class="highlight"><code><span class="n">array_1</span> <span class="o">=</span> <span class="n">np</span><span class="p">.</span><span class="n">setdiff1d</span><span class="p">(</span><span class="n">array_1</span><span class="p">,</span><span class="n">array_2</span><span class="p">)</span>
</code></pre></div></div>

<div class="language-python highlighter-rouge"><div class="highlight"><pre class="highlight"><code><span class="k">print</span><span class="p">(</span><span class="n">array_1</span><span class="p">)</span>
</code></pre></div></div>

<div class="language-plaintext highlighter-rouge"><div class="highlight"><pre class="highlight"><code>[ 0  1  2  3  4  5  6  7  8  9 10 11 12 13 14 15 16 17 18 19]
</code></pre></div></div>

<p>the setdiff1d method will return elements present in the first array but not found in the second array. We set it to array_1 and override the original array_1.</p>

<p>Note: If this time, we want elements found in the second array only we inverse the arguments like this</p>

<div class="language-python highlighter-rouge"><div class="highlight"><pre class="highlight"><code><span class="n">uniq_in_2nd_arr</span> <span class="o">=</span> <span class="n">np</span><span class="p">.</span><span class="n">setdiff1d</span><span class="p">(</span><span class="n">array_2</span><span class="p">,</span><span class="n">array_1</span><span class="p">)</span>
</code></pre></div></div>

<div class="language-python highlighter-rouge"><div class="highlight"><pre class="highlight"><code><span class="k">print</span><span class="p">(</span><span class="n">uniq_in_2nd_arr</span><span class="p">)</span>
</code></pre></div></div>

<div class="language-plaintext highlighter-rouge"><div class="highlight"><pre class="highlight"><code>[31 32 33 34 35 36 37 38 39 40 41 42 43 44 45 46 47 48 49 50]
</code></pre></div></div>

<h3>Ex 13: Get the elements that are unique in an array</h3>

<p>Q: Get only elements that are not duplicated in an array.</p>

<div class="language-python highlighter-rouge"><div class="highlight"><pre class="highlight"><code><span class="n">my_arr</span> <span class="o">=</span> <span class="n">np</span><span class="p">.</span><span class="n">array</span><span class="p">([</span><span class="mi">5</span><span class="p">,</span><span class="mi">2</span><span class="p">,</span><span class="mi">1</span><span class="p">,</span><span class="mi">2</span><span class="p">,</span><span class="mi">89</span><span class="p">,</span><span class="mi">44</span><span class="p">,</span><span class="mi">5</span><span class="p">,</span><span class="mi">89</span><span class="p">,</span><span class="mi">5</span><span class="p">,</span><span class="mi">90</span><span class="p">,</span><span class="mi">104</span><span class="p">,</span><span class="mi">44</span><span class="p">,</span><span class="mi">88</span><span class="p">,</span><span class="mi">1</span><span class="p">])</span>
</code></pre></div></div>

<h4>Desired output</h4>

<div class="language-python highlighter-rouge"><div class="highlight"><pre class="highlight"><code><span class="c1"># [  1,   2,   5,  44,  88,  89,  90, 104]
</span></code></pre></div></div>

<h4>Solution</h4>

<div class="language-python highlighter-rouge"><div class="highlight"><pre class="highlight"><code><span class="n">uniq_arr</span> <span class="o">=</span> <span class="n">np</span><span class="p">.</span><span class="n">unique</span><span class="p">(</span><span class="n">my_arr</span><span class="p">)</span>
</code></pre></div></div>

<div class="language-python highlighter-rouge"><div class="highlight"><pre class="highlight"><code><span class="k">print</span><span class="p">(</span><span class="n">uniq_arr</span><span class="p">)</span>
</code></pre></div></div>

<div class="language-plaintext highlighter-rouge"><div class="highlight"><pre class="highlight"><code>[  1   2   5  44  88  89  90 104]
</code></pre></div></div>

<p>The unique method will return an array composed of only non-repeated elements in a given array.</p>

<h3>Ex 14: Get the position where two arrays have common elements</h3>

<p>Q: Find all the position where elements in array_1 match the elements in array_2.</p>

<div class="language-python highlighter-rouge"><div class="highlight"><pre class="highlight"><code><span class="n">array_1</span> <span class="o">=</span> <span class="n">np</span><span class="p">.</span><span class="n">arange</span><span class="p">(</span><span class="mi">100</span><span class="p">,</span><span class="mi">121</span><span class="p">)</span>
<span class="n">array_2</span> <span class="o">=</span> <span class="n">np</span><span class="p">.</span><span class="n">arange</span><span class="p">(</span><span class="mi">115</span><span class="p">,</span><span class="mi">151</span><span class="p">)</span>
</code></pre></div></div>

<h4>Desire output</h4>

<div class="language-python highlighter-rouge"><div class="highlight"><pre class="highlight"><code><span class="c1"># (array([15, 16, 17, 18, 19, 20]),)
</span></code></pre></div></div>

<h4>Solution</h4>

<h4>1st Method</h4>

<div class="language-python highlighter-rouge"><div class="highlight"><pre class="highlight"><code><span class="n">bool_array</span> <span class="o">=</span> <span class="n">np</span><span class="p">.</span><span class="n">in1d</span><span class="p">(</span><span class="n">array_1</span><span class="p">,</span><span class="n">array_2</span><span class="p">)</span>
</code></pre></div></div>

<div class="language-python highlighter-rouge"><div class="highlight"><pre class="highlight"><code><span class="n">repeat_idx_arr</span> <span class="o">=</span> <span class="n">np</span><span class="p">.</span><span class="n">where</span><span class="p">(</span><span class="n">bool_array</span><span class="p">)</span>
</code></pre></div></div>

<div class="language-python highlighter-rouge"><div class="highlight"><pre class="highlight"><code><span class="k">print</span><span class="p">(</span><span class="n">repeat_idx_arr</span><span class="p">)</span>
</code></pre></div></div>

<div class="language-plaintext highlighter-rouge"><div class="highlight"><pre class="highlight"><code>(array([15, 16, 17, 18, 19, 20]),)
</code></pre></div></div>

<p>For this example, we have used two different NumPy’s methods</p>

<p>The first method is in1d, which will return a boolean array where True on the position where there is a common element in the first and second array.</p>

<p>The second method is the where method which takes the boolean array as an argument and then returns the index position of the True values.</p>

<h4>2nd Method</h4>

<div class="language-python highlighter-rouge"><div class="highlight"><pre class="highlight"><code><span class="n">bool_array</span> <span class="o">=</span> <span class="n">np</span><span class="p">.</span><span class="n">in1d</span><span class="p">(</span><span class="n">array_1</span><span class="p">,</span><span class="n">array_2</span><span class="p">)</span>
</code></pre></div></div>

<div class="language-python highlighter-rouge"><div class="highlight"><pre class="highlight"><code><span class="n">repeat_idx_arr</span> <span class="o">=</span> <span class="n">np</span><span class="p">.</span><span class="n">nonzero</span><span class="p">(</span><span class="n">bool_array</span><span class="p">)</span>
</code></pre></div></div>

<div class="language-python highlighter-rouge"><div class="highlight"><pre class="highlight"><code><span class="k">print</span><span class="p">(</span><span class="n">repeat_idx_arr</span><span class="p">)</span>
</code></pre></div></div>

<div class="language-plaintext highlighter-rouge"><div class="highlight"><pre class="highlight"><code>(array([15, 16, 17, 18, 19, 20]),)
</code></pre></div></div>

<p>Here, we achieved the same result using the nonzero method.</p>

<h3>Ex 15: Extract all the elements within a given range</h3>

<p>Q: Get all the numbers between 50 and 110 in the following randomly generated array.</p>

<div class="language-python highlighter-rouge"><div class="highlight"><pre class="highlight"><code><span class="n">my_arr</span> <span class="o">=</span> <span class="n">np</span><span class="p">.</span><span class="n">random</span><span class="p">.</span><span class="n">randint</span><span class="p">(</span><span class="mi">0</span><span class="p">,</span><span class="mi">150</span><span class="p">,</span><span class="n">size</span><span class="o">=</span><span class="mi">200</span><span class="p">)</span>
</code></pre></div></div>

<div class="language-python highlighter-rouge"><div class="highlight"><pre class="highlight"><code><span class="k">print</span><span class="p">(</span><span class="n">my_arr</span><span class="p">)</span>
</code></pre></div></div>

<div class="language-plaintext highlighter-rouge"><div class="highlight"><pre class="highlight"><code>[ 43  74  68  78  47  21  37 112  82  76  75  63 108 115 143 137 100  21
  32 100 105   6  48 110  44 106 113  19  95  81  57  44 137 137  53   2
  67  93 139 114 130  18 118  74  72   8  52  63   4 149 125  39   2  69
 120 111  84   0 100  80   7 112  94  16  20 138  73 145 114  41 145  32
  91  10  51 106  90 128  93 135  67  63  54  86 128  76   7 146 104  83
  88 103  43 134  98  68  90 108  86  30 142  41  30  67 104  81  10  93
  68  82  34  26  40 147  26  89  18 119  15  17  93 145 123  62  32   1
   5  95  22  64   3 111  62  84  29 143  94  31  93 123 149  92 142  10
 112  80  19  77 142  50  78  52  22  16   9  93  56  66  61  69  70  11
  13 119  87 141 102  12  97  66 107  99  51  30  36  78  99  76 115 141
 134  71 112  98  11  85 112 148 119  20  36  19 120  27 137 101  31 149
   3  82]
</code></pre></div></div>

<h4>Desired output</h4>

<div class="language-python highlighter-rouge"><div class="highlight"><pre class="highlight"><code><span class="c1"># Can't give the exact array because obviously it is randomly generated. Your array will be most likely different from mine
# We will see how we can fix this in the upcoming exercises.
</span></code></pre></div></div>

<h4>Solution</h4>

<h4>1st Method</h4>

<div class="language-python highlighter-rouge"><div class="highlight"><pre class="highlight"><code><span class="n">extract_arr</span> <span class="o">=</span> <span class="n">my_arr</span><span class="p">[(</span><span class="n">my_arr</span> <span class="o">&gt;=</span> <span class="mi">50</span><span class="p">)</span> <span class="o">&amp;</span> <span class="p">(</span><span class="n">my_arr</span> <span class="o">&lt;=</span><span class="mi">110</span><span class="p">)]</span>
</code></pre></div></div>

<div class="language-python highlighter-rouge"><div class="highlight"><pre class="highlight"><code><span class="k">print</span><span class="p">(</span><span class="n">extract_arr</span><span class="p">)</span>
</code></pre></div></div>

<div class="language-plaintext highlighter-rouge"><div class="highlight"><pre class="highlight"><code>[ 74  68  78  82  76  75  63 108 100 100 105 110 106  95  81  57  53  67
  93  74  72  52  63  69  84 100  80  94  73  91  51 106  90  93  67  63
  54  86  76 104  83  88 103  98  68  90 108  86  67 104  81  93  68  82
  89  93  62  95  64  62  84  94  93  92  80  77  50  78  52  93  56  66
  61  69  70  87 102  97  66 107  99  51  78  99  76  71  98  85 101  82]
</code></pre></div></div>

<p>We use indexing on the array and pass in the condition which will only return elements greater or equal to 50.</p>

<h4>2nd Method</h4>

<div class="language-python highlighter-rouge"><div class="highlight"><pre class="highlight"><code><span class="n">extract_arr</span> <span class="o">=</span> <span class="n">np</span><span class="p">.</span><span class="n">where</span><span class="p">((</span><span class="n">my_arr</span> <span class="o">&gt;=</span> <span class="mi">50</span><span class="p">)</span> <span class="o">&amp;</span> <span class="p">(</span><span class="n">my_arr</span> <span class="o">&lt;=</span><span class="mi">110</span><span class="p">))</span>
</code></pre></div></div>

<div class="language-python highlighter-rouge"><div class="highlight"><pre class="highlight"><code><span class="k">print</span><span class="p">(</span><span class="n">my_arr</span><span class="p">[</span><span class="n">extract_arr</span><span class="p">])</span>
</code></pre></div></div>

<div class="language-plaintext highlighter-rouge"><div class="highlight"><pre class="highlight"><code>[ 74  68  78  82  76  75  63 108 100 100 105 110 106  95  81  57  53  67
  93  74  72  52  63  69  84 100  80  94  73  91  51 106  90  93  67  63
  54  86  76 104  83  88 103  98  68  90 108  86  67 104  81  93  68  82
  89  93  62  95  64  62  84  94  93  92  80  77  50  78  52  93  56  66
  61  69  70  87 102  97  66 107  99  51  78  99  76  71  98  85 101  82]
</code></pre></div></div>

<p>Where method will evaluate the condition given to it and then return all the position place where the conditions are met, we stored these positions into a variable then use indexing technique to retrieve the numbers in my_arr.</p>

<h4>3rd Method</h4>

<div class="language-python highlighter-rouge"><div class="highlight"><pre class="highlight"><code><span class="n">extract_arr</span> <span class="o">=</span> <span class="n">np</span><span class="p">.</span><span class="n">where</span><span class="p">(</span><span class="n">np</span><span class="p">.</span><span class="n">logical_and</span><span class="p">((</span><span class="n">my_arr</span> <span class="o">&gt;=</span> <span class="mi">50</span><span class="p">),(</span><span class="n">my_arr</span> <span class="o">&lt;=</span><span class="mi">110</span><span class="p">)))</span>
</code></pre></div></div>

<div class="language-python highlighter-rouge"><div class="highlight"><pre class="highlight"><code><span class="k">print</span><span class="p">(</span><span class="n">my_arr</span><span class="p">[</span><span class="n">extract_arr</span><span class="p">])</span>
</code></pre></div></div>

<div class="language-plaintext highlighter-rouge"><div class="highlight"><pre class="highlight"><code>[ 74  68  78  82  76  75  63 108 100 100 105 110 106  95  81  57  53  67
  93  74  72  52  63  69  84 100  80  94  73  91  51 106  90  93  67  63
  54  86  76 104  83  88 103  98  68  90 108  86  67 104  81  93  68  82
  89  93  62  95  64  62  84  94  93  92  80  77  50  78  52  93  56  66
  61  69  70  87 102  97  66 107  99  51  78  99  76  71  98  85 101  82]
</code></pre></div></div>

<p>Instead of explicitly use the &amp; symbol, we can use the built-in NumPy equivalent using logical_and method then pass the two condition and use the where method as we did before.</p>

<h3>Ex 16: Create a function that compares elements wise two arrays.</h3>

<p>Q: Compare the corresponding elements in two arrays and return a new arrays with the maximum number.</p>

<div class="language-python highlighter-rouge"><div class="highlight"><pre class="highlight"><code><span class="n">array_1</span> <span class="o">=</span> <span class="n">np</span><span class="p">.</span><span class="n">random</span><span class="p">.</span><span class="n">randint</span><span class="p">(</span><span class="mi">0</span><span class="p">,</span><span class="mi">100</span><span class="p">,</span><span class="n">size</span><span class="o">=</span><span class="mi">10</span><span class="p">)</span>
<span class="n">array_2</span> <span class="o">=</span> <span class="n">np</span><span class="p">.</span><span class="n">random</span><span class="p">.</span><span class="n">randint</span><span class="p">(</span><span class="mi">0</span><span class="p">,</span><span class="mi">100</span><span class="p">,</span><span class="n">size</span><span class="o">=</span><span class="mi">10</span><span class="p">)</span>
<span class="k">print</span><span class="p">(</span><span class="n">array_1</span><span class="p">)</span>
<span class="k">print</span><span class="p">(</span><span class="n">array_2</span><span class="p">)</span>
</code></pre></div></div>

<div class="language-plaintext highlighter-rouge"><div class="highlight"><pre class="highlight"><code>[44 47 27 22 39 98 55 74 69 79]
[56 53 78 48 12  4 84 50 47 61]
</code></pre></div></div>

<div class="language-python highlighter-rouge"><div class="highlight"><pre class="highlight"><code><span class="c1"># The function to use
</span><span class="k">def</span> <span class="nf">comparison</span><span class="p">(</span><span class="n">x</span><span class="p">,</span><span class="n">y</span><span class="p">):</span>
    <span class="k">if</span> <span class="n">x</span> <span class="o">&gt;</span> <span class="n">y</span><span class="p">:</span>
        <span class="k">return</span> <span class="n">x</span>
    <span class="k">else</span><span class="p">:</span>
        <span class="k">return</span> <span class="n">y</span>
</code></pre></div></div>

<h4>Desire output</h4>

<div class="language-python highlighter-rouge"><div class="highlight"><pre class="highlight"><code><span class="c1"># Your result will most likely be different because the two arrays are randomly generated
# [56 53 78 48 39 98 84 74 69 79]
</span></code></pre></div></div>

<h4>Solution</h4>

<div class="language-python highlighter-rouge"><div class="highlight"><pre class="highlight"><code><span class="n">arr_comparisonr</span> <span class="o">=</span> <span class="n">np</span><span class="p">.</span><span class="n">vectorize</span><span class="p">(</span><span class="n">comparison</span><span class="p">)</span>
<span class="k">print</span><span class="p">(</span><span class="n">arr_comparison</span><span class="p">(</span><span class="n">array_1</span><span class="p">,</span><span class="n">array_2</span><span class="p">))</span>
</code></pre></div></div>

<div class="language-plaintext highlighter-rouge"><div class="highlight"><pre class="highlight"><code>[56 53 78 48 39 98 84 74 69 79]
</code></pre></div></div>

<p>Think of the vectorize method as the map function of Python but this time for NumPy arrays. This method will take as argument the function which will be applied on all the corresponding elements of the two arrays. Then we store it in a variable which will be used to call the function by passing in the two arrays.</p>

<h3>Ex 17: Swap two columns in a two-dimensional array</h3>

<p>Q: We want to swap the 4th column with the 7th column in the following array.</p>

<div class="language-python highlighter-rouge"><div class="highlight"><pre class="highlight"><code><span class="n">my_arr</span> <span class="o">=</span> <span class="n">np</span><span class="p">.</span><span class="n">arange</span><span class="p">(</span><span class="mi">27</span><span class="p">).</span><span class="n">reshape</span><span class="p">(</span><span class="mi">3</span><span class="p">,</span><span class="o">-</span><span class="mi">1</span><span class="p">)</span>
</code></pre></div></div>

<div class="language-python highlighter-rouge"><div class="highlight"><pre class="highlight"><code><span class="k">print</span><span class="p">(</span><span class="n">my_arr</span><span class="p">)</span>
</code></pre></div></div>

<div class="language-plaintext highlighter-rouge"><div class="highlight"><pre class="highlight"><code>[[ 0  1  2  3  4  5  6  7  8]
 [ 9 10 11 12 13 14 15 16 17]
 [18 19 20 21 22 23 24 25 26]]
</code></pre></div></div>

<h4>Desire output</h4>

<div class="language-python highlighter-rouge"><div class="highlight"><pre class="highlight"><code><span class="c1"># [[ 0  1  2  6  4  5  3  7  8]
#  [ 9 10 11 15 13 14 12 16 17]
#  [18 19 20 24 22 23 21 25 26]]
</span></code></pre></div></div>

<h4>Solution</h4>

<div class="language-python highlighter-rouge"><div class="highlight"><pre class="highlight"><code><span class="n">my_arr</span><span class="p">[:,[</span><span class="mi">6</span><span class="p">,</span><span class="mi">3</span><span class="p">]]</span> <span class="o">=</span> <span class="n">my_arr</span><span class="p">[:,[</span><span class="mi">3</span><span class="p">,</span><span class="mi">6</span><span class="p">]]</span>
</code></pre></div></div>

<div class="language-python highlighter-rouge"><div class="highlight"><pre class="highlight"><code><span class="k">print</span><span class="p">(</span><span class="n">my_arr</span><span class="p">)</span>
</code></pre></div></div>

<div class="language-plaintext highlighter-rouge"><div class="highlight"><pre class="highlight"><code>[[ 0  1  2  6  4  5  3  7  8]
 [ 9 10 11 15 13 14 12 16 17]
 [18 19 20 24 22 23 21 25 26]]
</code></pre></div></div>

<p>We use indexing to swap two columns. A comma separates the two arguments inside the square bracket [ ], the first argument is the row, and we use a colon to get all the elements in the row then the second argument is another square bracket which selects the 7th and 4th columns respectively.</p>

<p>Now comes the following expression on the right of the equal sign, we select all the elements in the row using a colon, and then we select the 4th and 7th column. You see this time we have started with the 4th and then the 7th column.</p>

<p>We have understood what both sides are doing, now comes the magic moment where we set the two sides using the equal sign and keep in mind that the operator precedence of the equal sign is from left to right, so we are changing the 4th column to be the 7th at the same time setting the 7th column to be equal to the 4th. There you go! The swap just happened.</p>

<h3>Ex 18: Swap two rows in a two-dimensional array</h3>

<p>Q: Now let’s swap the second row with the third row.</p>

<div class="language-python highlighter-rouge"><div class="highlight"><pre class="highlight"><code><span class="n">my_arr</span> <span class="o">=</span> <span class="n">np</span><span class="p">.</span><span class="n">arange</span><span class="p">(</span><span class="mi">27</span><span class="p">).</span><span class="n">reshape</span><span class="p">(</span><span class="mi">3</span><span class="p">,</span><span class="o">-</span><span class="mi">1</span><span class="p">)</span>
</code></pre></div></div>

<div class="language-python highlighter-rouge"><div class="highlight"><pre class="highlight"><code><span class="k">print</span><span class="p">(</span><span class="n">my_arr</span><span class="p">)</span>
</code></pre></div></div>

<div class="language-plaintext highlighter-rouge"><div class="highlight"><pre class="highlight"><code>[[ 0  1  2  3  4  5  6  7  8]
 [ 9 10 11 12 13 14 15 16 17]
 [18 19 20 21 22 23 24 25 26]]
</code></pre></div></div>

<h4>Desired output</h4>

<div class="language-python highlighter-rouge"><div class="highlight"><pre class="highlight"><code><span class="c1"># [[ 0  1  2  3  4  5  6  7  8]
#  [18 19 20 21 22 23 24 25 26]
#  [ 9 10 11 12 13 14 15 16 17]]
</span></code></pre></div></div>

<h4>Solution</h4>

<div class="language-python highlighter-rouge"><div class="highlight"><pre class="highlight"><code><span class="n">my_arr</span><span class="p">[[</span><span class="mi">1</span><span class="p">,</span><span class="mi">2</span><span class="p">],:]</span> <span class="o">=</span> <span class="n">my_arr</span><span class="p">[[</span><span class="mi">2</span><span class="p">,</span><span class="mi">1</span><span class="p">],:]</span>
</code></pre></div></div>

<div class="language-python highlighter-rouge"><div class="highlight"><pre class="highlight"><code><span class="k">print</span><span class="p">(</span><span class="n">my_arr</span><span class="p">)</span>
</code></pre></div></div>

<div class="language-plaintext highlighter-rouge"><div class="highlight"><pre class="highlight"><code>[[ 0  1  2  3  4  5  6  7  8]
 [18 19 20 21 22 23 24 25 26]
 [ 9 10 11 12 13 14 15 16 17]]
</code></pre></div></div>

<p>This exercise is almost identical to the previous one; this time, we are executing the same code row-wise instead of column-wise.</p>

<h3>Ex 19: Reverse rows in a two-dimensional array</h3>

<p>Q: Let’s reverse rows in a two-dimensional array.</p>

<div class="language-python highlighter-rouge"><div class="highlight"><pre class="highlight"><code><span class="n">my_arr</span> <span class="o">=</span> <span class="n">np</span><span class="p">.</span><span class="n">arange</span><span class="p">(</span><span class="mi">27</span><span class="p">).</span><span class="n">reshape</span><span class="p">(</span><span class="mi">3</span><span class="p">,</span><span class="o">-</span><span class="mi">1</span><span class="p">)</span>
</code></pre></div></div>

<div class="language-python highlighter-rouge"><div class="highlight"><pre class="highlight"><code><span class="k">print</span><span class="p">(</span><span class="n">my_arr</span><span class="p">)</span>
</code></pre></div></div>

<div class="language-plaintext highlighter-rouge"><div class="highlight"><pre class="highlight"><code>[[ 0  1  2  3  4  5  6  7  8]
 [ 9 10 11 12 13 14 15 16 17]
 [18 19 20 21 22 23 24 25 26]]
</code></pre></div></div>

<h4>Desired output</h4>

<div class="language-python highlighter-rouge"><div class="highlight"><pre class="highlight"><code><span class="c1"># [[18 19 20 21 22 23 24 25 26]
#  [ 9 10 11 12 13 14 15 16 17]
#  [ 0  1  2  3  4  5  6  7  8]]
</span></code></pre></div></div>

<h4>Solution</h4>

<div class="language-python highlighter-rouge"><div class="highlight"><pre class="highlight"><code><span class="n">rev_row_arr</span> <span class="o">=</span> <span class="n">np</span><span class="p">.</span><span class="n">flip</span><span class="p">(</span><span class="n">my_arr</span><span class="p">,</span><span class="n">axis</span><span class="o">=</span><span class="mi">0</span><span class="p">)</span>
</code></pre></div></div>

<div class="language-python highlighter-rouge"><div class="highlight"><pre class="highlight"><code><span class="k">print</span><span class="p">(</span><span class="n">rev_row_arr</span><span class="p">)</span>
</code></pre></div></div>

<div class="language-plaintext highlighter-rouge"><div class="highlight"><pre class="highlight"><code>[[18 19 20 21 22 23 24 25 26]
 [ 9 10 11 12 13 14 15 16 17]
 [ 0  1  2  3  4  5  6  7  8]]
</code></pre></div></div>

<p>We used the flip method to reverse the order in the row by setting the axis to 0, which corresponds to the row.</p>

<h3>Ex 20: Reverse columns in two-dimensional array</h3>

<p>Q: Let’s reverse columns in a two-dimensional array.</p>

<div class="language-python highlighter-rouge"><div class="highlight"><pre class="highlight"><code><span class="n">my_arr</span> <span class="o">=</span> <span class="n">np</span><span class="p">.</span><span class="n">arange</span><span class="p">(</span><span class="mi">27</span><span class="p">).</span><span class="n">reshape</span><span class="p">(</span><span class="mi">3</span><span class="p">,</span><span class="o">-</span><span class="mi">1</span><span class="p">)</span>
</code></pre></div></div>

<div class="language-python highlighter-rouge"><div class="highlight"><pre class="highlight"><code><span class="k">print</span><span class="p">(</span><span class="n">my_arr</span><span class="p">)</span>
</code></pre></div></div>

<div class="language-plaintext highlighter-rouge"><div class="highlight"><pre class="highlight"><code>[[ 0  1  2  3  4  5  6  7  8]
 [ 9 10 11 12 13 14 15 16 17]
 [18 19 20 21 22 23 24 25 26]]
</code></pre></div></div>

<h4>Desired output</h4>

<div class="language-python highlighter-rouge"><div class="highlight"><pre class="highlight"><code><span class="c1"># [[ 8  7  6  5  4  3  2  1  0]
#  [17 16 15 14 13 12 11 10  9]
#  [26 25 24 23 22 21 20 19 18]]
</span></code></pre></div></div>

<h4>Solution</h4>

<div class="language-python highlighter-rouge"><div class="highlight"><pre class="highlight"><code><span class="n">rev_col_arr</span> <span class="o">=</span> <span class="n">np</span><span class="p">.</span><span class="n">flip</span><span class="p">(</span><span class="n">my_arr</span><span class="p">,</span><span class="n">axis</span><span class="o">=</span><span class="mi">1</span><span class="p">)</span>
</code></pre></div></div>

<div class="language-python highlighter-rouge"><div class="highlight"><pre class="highlight"><code><span class="k">print</span><span class="p">(</span><span class="n">rev_col_arr</span><span class="p">)</span>
</code></pre></div></div>

<div class="language-plaintext highlighter-rouge"><div class="highlight"><pre class="highlight"><code>[[ 8  7  6  5  4  3  2  1  0]
 [17 16 15 14 13 12 11 10  9]
 [26 25 24 23 22 21 20 19 18]]
</code></pre></div></div>

<p>Same as the previous exercise, the only difference is that we have set the axis argument to 1 to refer to the columns.</p>

<h3>Conclusion</h3>

<p>Hope by now you are starting to gain confidence in your NumPy skills, this is was the first part in a series of three posts entirely dedicated to exercise in NumPy. I am pretty sure that at the end of these series, you will have a strong understanding of NumPy and you start using it in your projects. Stay tuned for part 2!!</p>

<p>Find the jupyter notebook version of this post on my GitHub profile <a href="Find the jupyter notebook version of this post on my GitHub profile [here.]()">here.</a></p>

<p>Thank you for doing these exercises with me. I hope you have learned one or two things. If you like this post, please subscribe to stay updated with new posts, and if you have a thought or a question, I would love to hear it by commenting below. Remember keep learning!</p>]]></content><author><name>Stern Semasuka</name></author><category term="python" /><category term="exercises" /><category term="numpy" /><summary type="html"><![CDATA[In this post, we will be solving 20 exercises in NumPy to sharpen what you have learnt from the NumPy introduction post. If you have not read the NumPy post, I highly encourage to go first through that post on this link and then come back to try out the exercises.]]></summary><media:thumbnail xmlns:media="http://search.yahoo.com/mrss/" url="https://semasuka.github.io/blog/blog/assets/post_images/numpy.png" /><media:content medium="image" url="https://semasuka.github.io/blog/blog/assets/post_images/numpy.png" xmlns:media="http://search.yahoo.com/mrss/" /></entry><entry><title type="html">NumPy Crash Course</title><link href="https://semasuka.github.io/blog/blog/2019/07/21/numpy-crash-course-copy.html" rel="alternate" type="text/html" title="NumPy Crash Course" /><published>2019-07-21T00:00:00+00:00</published><updated>2019-07-21T00:00:00+00:00</updated><id>https://semasuka.github.io/blog/blog/2019/07/21/numpy-crash-course%20copy</id><content type="html" xml:base="https://semasuka.github.io/blog/blog/2019/07/21/numpy-crash-course-copy.html"><![CDATA[<p>One of the most used scientific computing library for python is without a doubt NumPy, Numpy, which is an abbreviation of Numerical Python, is very fast at computing arrays since it is mostly written in C programming. NumPy adds support for large, multi-dimensional arrays and matrices, along with an extensive collection of high-level mathematical functions (for linear algebra) to operate on these arrays.<!-- more --> Pandas, which is a library for data manipulation, is written based on NumPy. In this post, we will discuss NumPy and how to use it, and by the end of the post, you will see why it is one of the most famous Python libraries for data science and machine learning.</p>

<p>Let’s jump into Anaconda and import the NumPy library.</p>

<div class="language-python highlighter-rouge"><div class="highlight"><pre class="highlight"><code><span class="kn">import</span> <span class="nn">numpy</span> <span class="k">as</span> <span class="n">np</span>
</code></pre></div></div>

<p>Note: if you do not have NumPy installed on your anaconda environment, read <a href="https://semasuka.github.io/blog/2019/01/06/introduction-to-jupyter-notebook.html" target="_blank">this</a> post where I explain how to install NumPy.</p>

<p>Now that we all set let’s start.</p>

<p>The primary data structures of NumPy is Array. An array comes into two flavors, which are Vector (1D array) and Matrice (2D or more dimension array).</p>

<p>Now let’s create a new list and cast it into a NumPy array.</p>

<div class="language-python highlighter-rouge"><div class="highlight"><pre class="highlight"><code><span class="n">my_list</span> <span class="o">=</span> <span class="p">[</span><span class="mi">2</span><span class="p">,</span><span class="mi">2</span><span class="p">,</span><span class="mi">1</span><span class="p">,</span><span class="mi">36</span><span class="p">,</span><span class="mi">62</span><span class="p">,</span><span class="mi">1</span><span class="p">]</span>
<span class="n">my_vector</span> <span class="o">=</span> <span class="n">np</span><span class="p">.</span><span class="n">array</span><span class="p">(</span><span class="n">my_list</span><span class="p">)</span>
</code></pre></div></div>

<p>We use a method called array from the NumPy package to cast the list into a vector array. We can check that my_vector is a NumPy array by using the type function from the standard Python libraries.</p>

<div class="language-python highlighter-rouge"><div class="highlight"><pre class="highlight"><code><span class="k">print</span><span class="p">(</span><span class="nb">type</span><span class="p">(</span><span class="n">my_vector</span><span class="p">))</span>
</code></pre></div></div>

<div class="language-plaintext highlighter-rouge"><div class="highlight"><pre class="highlight"><code>&lt;class 'numpy.ndarray'&gt;
</code></pre></div></div>

<p>We see that my_vector belongs to the numpy class. To check precisely what data type the array is, we write it like this.</p>

<div class="language-python highlighter-rouge"><div class="highlight"><pre class="highlight"><code><span class="k">print</span><span class="p">(</span><span class="n">my_vector</span><span class="p">.</span><span class="n">dtype</span><span class="p">)</span>
</code></pre></div></div>

<div class="language-plaintext highlighter-rouge"><div class="highlight"><pre class="highlight"><code>int64
</code></pre></div></div>

<p>The NumPy array is of type int64.</p>

<p>What if we want a two-dimensional array, we cast a list of lists like this.</p>

<div class="language-python highlighter-rouge"><div class="highlight"><pre class="highlight"><code><span class="n">my_list_2d</span> <span class="o">=</span> <span class="p">[[</span><span class="mi">1</span><span class="p">,</span><span class="mi">2</span><span class="p">,</span><span class="mi">3</span><span class="p">],[</span><span class="mi">4</span><span class="p">,</span><span class="mi">5</span><span class="p">,</span><span class="mi">6</span><span class="p">]]</span>
<span class="n">my_vector_2d</span> <span class="o">=</span> <span class="n">np</span><span class="p">.</span><span class="n">array</span><span class="p">(</span><span class="n">my_list_2d</span><span class="p">)</span> 
</code></pre></div></div>

<div class="language-python highlighter-rouge"><div class="highlight"><pre class="highlight"><code><span class="k">print</span><span class="p">(</span><span class="n">my_vector_2d</span><span class="p">)</span>
</code></pre></div></div>

<div class="language-plaintext highlighter-rouge"><div class="highlight"><pre class="highlight"><code>[[1 2 3]
 [4 5 6]]
</code></pre></div></div>

<p>Now this time, we have a matrice (multidimensional array) composed of two arrays.</p>

<h3>Numpy Methods</h3>

<p>NumPy has several built-in methods to create or change arrays.</p>

<h4>Arange</h4>

<p>The arange method is used to create a new NumPy array if you want an array that has consecutive elements. We have to pass in as arguments the start number, the stop number, and optionally the step number. This method is very similar to the range Python built-in function.</p>

<div class="language-python highlighter-rouge"><div class="highlight"><pre class="highlight"><code><span class="n">seq_array</span> <span class="o">=</span> <span class="n">np</span><span class="p">.</span><span class="n">arange</span><span class="p">(</span><span class="mi">3</span><span class="p">,</span><span class="mi">8</span><span class="p">)</span>
</code></pre></div></div>

<div class="language-python highlighter-rouge"><div class="highlight"><pre class="highlight"><code><span class="k">print</span><span class="p">(</span><span class="n">seq_array</span><span class="p">)</span>
</code></pre></div></div>

<div class="language-plaintext highlighter-rouge"><div class="highlight"><pre class="highlight"><code>[3 4 5 6 7]
</code></pre></div></div>

<div class="language-python highlighter-rouge"><div class="highlight"><pre class="highlight"><code><span class="k">print</span><span class="p">(</span><span class="nb">type</span><span class="p">(</span><span class="n">seq_array</span><span class="p">))</span>
</code></pre></div></div>

<div class="language-plaintext highlighter-rouge"><div class="highlight"><pre class="highlight"><code>&lt;class 'numpy.ndarray'&gt;
</code></pre></div></div>

<p>We have passed as the first argument 3, which is the starting point of our array, then the stopping point. Remember, the stopping number is not included so for example if the stopping number is 8, the array counts up to 7.</p>

<p>We can also use the step to skip every number at a specific step.</p>

<div class="language-python highlighter-rouge"><div class="highlight"><pre class="highlight"><code><span class="n">seq_array_step</span> <span class="o">=</span> <span class="n">np</span><span class="p">.</span><span class="n">arange</span><span class="p">(</span><span class="mi">1</span><span class="p">,</span><span class="mi">21</span><span class="p">,</span><span class="mi">2</span><span class="p">)</span>
</code></pre></div></div>

<div class="language-python highlighter-rouge"><div class="highlight"><pre class="highlight"><code><span class="k">print</span><span class="p">(</span><span class="n">seq_array_step</span><span class="p">)</span>
</code></pre></div></div>

<div class="language-plaintext highlighter-rouge"><div class="highlight"><pre class="highlight"><code>[ 1  3  5  7  9 11 13 15 17 19]
</code></pre></div></div>

<p>In the example above, we have started at 1 then stopped at 21 with 2 as the step, which means that we have added to the array only the second number in the sequence which corresponds to odds numbers. Let’s see another example.</p>

<div class="language-python highlighter-rouge"><div class="highlight"><pre class="highlight"><code><span class="n">seq_array_step_2</span> <span class="o">=</span> <span class="n">np</span><span class="p">.</span><span class="n">arange</span><span class="p">(</span><span class="mi">0</span><span class="p">,</span><span class="mi">501</span><span class="p">,</span><span class="mi">10</span><span class="p">)</span>
</code></pre></div></div>

<div class="language-python highlighter-rouge"><div class="highlight"><pre class="highlight"><code><span class="k">print</span><span class="p">(</span><span class="n">seq_array_step_2</span><span class="p">)</span>
</code></pre></div></div>

<div class="language-plaintext highlighter-rouge"><div class="highlight"><pre class="highlight"><code>[  0  10  20  30  40  50  60  70  80  90 100 110 120 130 140 150 160 170
 180 190 200 210 220 230 240 250 260 270 280 290 300 310 320 330 340 350
 360 370 380 390 400 410 420 430 440 450 460 470 480 490 500]
</code></pre></div></div>

<p>In this example, you can see that it started at 0 and then stop at 501 and stepped 10. It means that we have started counting from zero up to 501 and only considered each 10th number.</p>

<h4>Zero</h4>

<p>We generate an array composed only of zeros using the zeros method.</p>

<div class="language-python highlighter-rouge"><div class="highlight"><pre class="highlight"><code><span class="n">zeros_arr</span> <span class="o">=</span> <span class="n">np</span><span class="p">.</span><span class="n">zeros</span><span class="p">(</span><span class="mi">9</span><span class="p">)</span>
</code></pre></div></div>

<div class="language-python highlighter-rouge"><div class="highlight"><pre class="highlight"><code><span class="k">print</span><span class="p">(</span><span class="n">zeros_arr</span><span class="p">)</span>
</code></pre></div></div>

<div class="language-plaintext highlighter-rouge"><div class="highlight"><pre class="highlight"><code>[0. 0. 0. 0. 0. 0. 0. 0. 0.]
</code></pre></div></div>

<h4>Ones</h4>

<p>We also generate an array of only 1’s.</p>

<div class="language-python highlighter-rouge"><div class="highlight"><pre class="highlight"><code><span class="n">ones_arr</span> <span class="o">=</span> <span class="n">np</span><span class="p">.</span><span class="n">ones</span><span class="p">(</span><span class="mi">15</span><span class="p">)</span>
</code></pre></div></div>

<div class="language-python highlighter-rouge"><div class="highlight"><pre class="highlight"><code><span class="k">print</span><span class="p">(</span><span class="n">ones_arr</span><span class="p">)</span>
</code></pre></div></div>

<div class="language-plaintext highlighter-rouge"><div class="highlight"><pre class="highlight"><code>[1. 1. 1. 1. 1. 1. 1. 1. 1. 1. 1. 1. 1. 1. 1.]
</code></pre></div></div>

<h4>Full</h4>

<p>The same way we did with zeros and ones, we can generate an array of any number using the full method. This time we use two arguments, the first argument is how many times we want to generate the number, and the second argument is the actual number.</p>

<div class="language-python highlighter-rouge"><div class="highlight"><pre class="highlight"><code><span class="n">fives_arr</span> <span class="o">=</span> <span class="n">np</span><span class="p">.</span><span class="n">full</span><span class="p">(</span><span class="mi">10</span><span class="p">,</span><span class="mi">5</span><span class="p">)</span>
</code></pre></div></div>

<div class="language-python highlighter-rouge"><div class="highlight"><pre class="highlight"><code><span class="k">print</span><span class="p">(</span><span class="n">fives_arr</span><span class="p">)</span>
</code></pre></div></div>

<div class="language-plaintext highlighter-rouge"><div class="highlight"><pre class="highlight"><code>[5 5 5 5 5 5 5 5 5 5]
</code></pre></div></div>

<h4>Linspace</h4>

<p>There is this useful method called linspace. Linspace is very similar to arrange in the sense that they both have a start and a stop number, the only difference is that linspace’s thrid argument corresponds to the number of elements evenly spaced in the array.</p>

<div class="language-python highlighter-rouge"><div class="highlight"><pre class="highlight"><code><span class="n">interv_arr</span> <span class="o">=</span> <span class="n">np</span><span class="p">.</span><span class="n">linspace</span><span class="p">(</span><span class="mi">0</span><span class="p">,</span><span class="mi">100</span><span class="p">,</span><span class="mi">34</span><span class="p">)</span>
</code></pre></div></div>

<div class="language-python highlighter-rouge"><div class="highlight"><pre class="highlight"><code><span class="k">print</span><span class="p">(</span><span class="n">interv_arr</span><span class="p">)</span>
</code></pre></div></div>

<div class="language-plaintext highlighter-rouge"><div class="highlight"><pre class="highlight"><code>[  0.           3.03030303   6.06060606   9.09090909  12.12121212
  15.15151515  18.18181818  21.21212121  24.24242424  27.27272727
  30.3030303   33.33333333  36.36363636  39.39393939  42.42424242
  45.45454545  48.48484848  51.51515152  54.54545455  57.57575758
  60.60606061  63.63636364  66.66666667  69.6969697   72.72727273
  75.75757576  78.78787879  81.81818182  84.84848485  87.87878788
  90.90909091  93.93939394  96.96969697 100.        ]
</code></pre></div></div>

<p>In the example above, the count started from 0 and stopped at 100 (this time 100 is included), and the 34 is the count of numbers between 0 and 100, which are evenly spaced. It means that the interval between 0 and 3.03030303 is the same as the interval between 3.03030303 and 6.06060606 until we reach 34 numbers. The last number will be 100.</p>

<h4>Eye</h4>

<p>An identity matrix is a handy matrix used mainly in linear algebra. It is a multidimensional matrix with a diagonal line of 1’s, while everything else is zeros in the arrays.</p>

<div class="language-python highlighter-rouge"><div class="highlight"><pre class="highlight"><code><span class="n">identity_arr</span> <span class="o">=</span> <span class="n">np</span><span class="p">.</span><span class="n">eye</span><span class="p">(</span><span class="mi">10</span><span class="p">)</span>
</code></pre></div></div>

<div class="language-python highlighter-rouge"><div class="highlight"><pre class="highlight"><code><span class="k">print</span><span class="p">(</span><span class="n">identity_arr</span><span class="p">)</span>
</code></pre></div></div>

<div class="language-plaintext highlighter-rouge"><div class="highlight"><pre class="highlight"><code>[[1. 0. 0. 0. 0. 0. 0. 0. 0. 0.]
 [0. 1. 0. 0. 0. 0. 0. 0. 0. 0.]
 [0. 0. 1. 0. 0. 0. 0. 0. 0. 0.]
 [0. 0. 0. 1. 0. 0. 0. 0. 0. 0.]
 [0. 0. 0. 0. 1. 0. 0. 0. 0. 0.]
 [0. 0. 0. 0. 0. 1. 0. 0. 0. 0.]
 [0. 0. 0. 0. 0. 0. 1. 0. 0. 0.]
 [0. 0. 0. 0. 0. 0. 0. 1. 0. 0.]
 [0. 0. 0. 0. 0. 0. 0. 0. 1. 0.]
 [0. 0. 0. 0. 0. 0. 0. 0. 0. 1.]]
</code></pre></div></div>

<p>We have 10 arrays, and 1’s on the diagonal.</p>

<h4>Random</h4>

<p>We generate random numbers using the random function</p>

<div class="language-python highlighter-rouge"><div class="highlight"><pre class="highlight"><code><span class="n">rand_num</span> <span class="o">=</span> <span class="n">np</span><span class="p">.</span><span class="n">random</span><span class="p">.</span><span class="n">rand</span><span class="p">(</span><span class="mi">5</span><span class="p">)</span>
</code></pre></div></div>

<div class="language-python highlighter-rouge"><div class="highlight"><pre class="highlight"><code><span class="k">print</span><span class="p">(</span><span class="n">rand_num</span><span class="p">)</span>
</code></pre></div></div>

<div class="language-plaintext highlighter-rouge"><div class="highlight"><pre class="highlight"><code>[0.3284542  0.12707841 0.43429692 0.62579159 0.94835326]
</code></pre></div></div>

<p>Here, we have an array of 5 randomly generated numbers. Remember the numbers generated range from 0 to 1. If you want to generate a number, for example between 0 and 100, you could multiply each element in the array with 100 like this.</p>

<div class="language-python highlighter-rouge"><div class="highlight"><pre class="highlight"><code><span class="k">print</span><span class="p">(</span><span class="n">rand_num</span> <span class="o">*</span> <span class="mi">100</span><span class="p">)</span>
</code></pre></div></div>

<div class="language-plaintext highlighter-rouge"><div class="highlight"><pre class="highlight"><code>[32.84541984 12.70784146 43.42969158 62.57915874 94.83532581]
</code></pre></div></div>

<p>We will discuss more this when we will be talking about the operations on the NumPy array.</p>

<p>If we want to generate a sample from a standard normal distribution commonly used in statistic, we use randn() method</p>

<div class="language-python highlighter-rouge"><div class="highlight"><pre class="highlight"><code><span class="n">snd_arr</span> <span class="o">=</span> <span class="n">np</span><span class="p">.</span><span class="n">random</span><span class="p">.</span><span class="n">randn</span><span class="p">(</span><span class="mi">4</span><span class="p">)</span>
</code></pre></div></div>

<div class="language-python highlighter-rouge"><div class="highlight"><pre class="highlight"><code><span class="k">print</span><span class="p">(</span><span class="n">snd_arr</span><span class="p">)</span>
</code></pre></div></div>

<div class="language-plaintext highlighter-rouge"><div class="highlight"><pre class="highlight"><code>[-1.00599586 -0.23881844  0.25583286  1.49561263]
</code></pre></div></div>

<p>We have generated randomly four values using the standard normal distribution. We can generate a multidimensional array the same way.</p>

<div class="language-python highlighter-rouge"><div class="highlight"><pre class="highlight"><code><span class="n">snd_arr_multi</span> <span class="o">=</span> <span class="n">np</span><span class="p">.</span><span class="n">random</span><span class="p">.</span><span class="n">randn</span><span class="p">(</span><span class="mi">5</span><span class="p">,</span><span class="mi">3</span><span class="p">)</span>
</code></pre></div></div>

<div class="language-python highlighter-rouge"><div class="highlight"><pre class="highlight"><code><span class="k">print</span><span class="p">(</span><span class="n">snd_arr_multi</span><span class="p">)</span>
</code></pre></div></div>

<div class="language-plaintext highlighter-rouge"><div class="highlight"><pre class="highlight"><code>[[ 0.25959845  2.21015609 -1.55850209]
 [ 0.81583828 -1.91246958  0.7453705 ]
 [ 0.55490309 -0.35774245 -0.24781665]
 [ 0.53919982 -0.03549705 -1.47300085]
 [-1.12503957 -1.38798392  0.78566072]]
</code></pre></div></div>

<p>We can generate integers and pass as arguments low, high, and the size of the array to generate.</p>

<div class="language-python highlighter-rouge"><div class="highlight"><pre class="highlight"><code><span class="n">np</span><span class="p">.</span><span class="n">random</span><span class="p">.</span><span class="n">randint</span><span class="p">(</span><span class="mi">2</span><span class="p">,</span><span class="mi">10010</span><span class="p">,</span><span class="mi">50</span><span class="p">)</span>
</code></pre></div></div>

<div class="language-plaintext highlighter-rouge"><div class="highlight"><pre class="highlight"><code>array([5176, 2232, 9839, 5948, 6497, 3196, 3114, 2990, 1831, 4286, 9205,
       9128, 8280, 2003, 3586, 3030, 4834, 1252, 8876, 9600, 5123, 9166,
       6768, 4541, 8728, 6684, 3928, 2300, 6073, 5876, 2802, 8426, 4545,
       2667, 9668, 8287, 1281, 5363, 4003, 1961, 3602, 8699, 7767, 7175,
       3378, 8568,  915,  396, 7047, 6718])
</code></pre></div></div>

<p>Here we have an array of 50 numbers randomly selected starting from 2 up to 10010.</p>

<h4>Reshape</h4>

<p>We use the reshape method to transform an array from 1 dimension to other dimensions or vice versa.</p>

<div class="language-python highlighter-rouge"><div class="highlight"><pre class="highlight"><code><span class="n">oneD_arr</span> <span class="o">=</span> <span class="n">np</span><span class="p">.</span><span class="n">arange</span><span class="p">(</span><span class="mi">0</span><span class="p">,</span><span class="mi">8</span><span class="p">,</span><span class="mi">2</span><span class="p">)</span>
</code></pre></div></div>

<div class="language-python highlighter-rouge"><div class="highlight"><pre class="highlight"><code><span class="k">print</span><span class="p">(</span><span class="n">oneD_arr</span><span class="p">)</span>
</code></pre></div></div>

<div class="language-plaintext highlighter-rouge"><div class="highlight"><pre class="highlight"><code>[0 2 4 6]
</code></pre></div></div>

<p>We have oneD_arr a one-dimensional array if we want to change it to a two-dimensional array, we use the reshape method to change it.</p>

<div class="language-python highlighter-rouge"><div class="highlight"><pre class="highlight"><code><span class="n">twoD_arr</span> <span class="o">=</span> <span class="n">oneD_arr</span><span class="p">.</span><span class="n">reshape</span><span class="p">(</span><span class="mi">2</span><span class="p">,</span><span class="mi">2</span><span class="p">)</span>
</code></pre></div></div>

<div class="language-python highlighter-rouge"><div class="highlight"><pre class="highlight"><code><span class="k">print</span><span class="p">(</span><span class="n">twoD_arr</span><span class="p">)</span>
</code></pre></div></div>

<div class="language-plaintext highlighter-rouge"><div class="highlight"><pre class="highlight"><code>[[0 2]
 [4 6]]
</code></pre></div></div>

<p>We have transformed the one-dimension array into a two-dimension array and stored it in a new variable.</p>

<p>Careful here, we can not transform an array into a multidimensional array that does not fit. for example</p>

<div class="language-python highlighter-rouge"><div class="highlight"><pre class="highlight"><code><span class="n">twoD_arr</span> <span class="o">=</span> <span class="n">oneD_arr</span><span class="p">.</span><span class="n">reshape</span><span class="p">(</span><span class="mi">2</span><span class="p">,</span><span class="mi">3</span><span class="p">)</span>
</code></pre></div></div>

<div class="language-plaintext highlighter-rouge"><div class="highlight"><pre class="highlight"><code>---------------------------------------------------------------------------

ValueError                                Traceback (most recent call last)

&lt;ipython-input-109-c90c7d9b6f76&gt; in &lt;module&gt;
----&gt; 1 twoD_arr = oneD_arr.reshape(2,3)


ValueError: cannot reshape array of size 4 into shape (2,3)
</code></pre></div></div>

<p>Here we are trying to fit oneD_arr into a two-dimension array with three elements each. The interpreter is throwing an error because we are trying to fit oneD_arr into two arrays with three elements each. We are missing two more elements to create two arrays with three elements.</p>

<p>Let’s see another example.</p>

<div class="language-python highlighter-rouge"><div class="highlight"><pre class="highlight"><code><span class="n">fiveD_array</span> <span class="o">=</span> <span class="n">np</span><span class="p">.</span><span class="n">arange</span><span class="p">(</span><span class="mi">0</span><span class="p">,</span><span class="mi">1040</span><span class="p">,</span><span class="mi">15</span><span class="p">)</span>
</code></pre></div></div>

<div class="language-python highlighter-rouge"><div class="highlight"><pre class="highlight"><code><span class="k">print</span><span class="p">(</span><span class="n">fiveD_array</span><span class="p">)</span>
</code></pre></div></div>

<div class="language-plaintext highlighter-rouge"><div class="highlight"><pre class="highlight"><code>[   0   15   30   45   60   75   90  105  120  135  150  165  180  195
  210  225  240  255  270  285  300  315  330  345  360  375  390  405
  420  435  450  465  480  495  510  525  540  555  570  585  600  615
  630  645  660  675  690  705  720  735  750  765  780  795  810  825
  840  855  870  885  900  915  930  945  960  975  990 1005 1020 1035]
</code></pre></div></div>

<p>Now we can reshape the array into 10 arrays with 7 elements.</p>

<div class="language-python highlighter-rouge"><div class="highlight"><pre class="highlight"><code><span class="k">print</span><span class="p">(</span><span class="n">fiveD_array</span><span class="p">.</span><span class="n">reshape</span><span class="p">(</span><span class="mi">10</span><span class="p">,</span><span class="mi">7</span><span class="p">))</span>
</code></pre></div></div>

<div class="language-plaintext highlighter-rouge"><div class="highlight"><pre class="highlight"><code>[[   0   15   30   45   60   75   90]
 [ 105  120  135  150  165  180  195]
 [ 210  225  240  255  270  285  300]
 [ 315  330  345  360  375  390  405]
 [ 420  435  450  465  480  495  510]
 [ 525  540  555  570  585  600  615]
 [ 630  645  660  675  690  705  720]
 [ 735  750  765  780  795  810  825]
 [ 840  855  870  885  900  915  930]
 [ 945  960  975  990 1005 1020 1035]]
</code></pre></div></div>

<h4>Shape</h4>

<p>Now if we want to know which dimension is an array, we use the shape method on any array.</p>

<div class="language-python highlighter-rouge"><div class="highlight"><pre class="highlight"><code><span class="n">multi_arr</span> <span class="o">=</span> <span class="n">np</span><span class="p">.</span><span class="n">random</span><span class="p">.</span><span class="n">rand</span><span class="p">(</span><span class="mi">4</span><span class="p">,</span><span class="mi">5</span><span class="p">)</span>
</code></pre></div></div>

<div class="language-python highlighter-rouge"><div class="highlight"><pre class="highlight"><code><span class="k">print</span><span class="p">(</span><span class="n">multi_arr</span><span class="p">)</span>
</code></pre></div></div>

<div class="language-plaintext highlighter-rouge"><div class="highlight"><pre class="highlight"><code>[[0.29672388 0.30382348 0.63858171 0.04452958 0.42704145]
 [0.36501907 0.96622299 0.84038868 0.61598943 0.77640899]
 [0.59761916 0.93173121 0.23362733 0.1241686  0.37988366]
 [0.6542785  0.28888605 0.91213121 0.78753272 0.52377276]]
</code></pre></div></div>

<p>We have created a multidimensional array randomly with the random method. Now let’s verify the shape of the array by calling the shape method on the array.</p>

<div class="language-python highlighter-rouge"><div class="highlight"><pre class="highlight"><code><span class="n">multi_arr</span><span class="p">.</span><span class="n">shape</span>
</code></pre></div></div>

<div class="language-plaintext highlighter-rouge"><div class="highlight"><pre class="highlight"><code>(4, 5)
</code></pre></div></div>

<h4>Max</h4>

<p>The max method returns the highest number in an array.</p>

<div class="language-python highlighter-rouge"><div class="highlight"><pre class="highlight"><code><span class="n">some_arr</span> <span class="o">=</span> <span class="n">np</span><span class="p">.</span><span class="n">random</span><span class="p">.</span><span class="n">randint</span><span class="p">(</span><span class="mi">0</span><span class="p">,</span><span class="mi">10000</span><span class="p">,</span><span class="n">size</span><span class="o">=</span><span class="mi">500</span><span class="p">)</span>
</code></pre></div></div>

<div class="language-python highlighter-rouge"><div class="highlight"><pre class="highlight"><code><span class="k">print</span><span class="p">(</span><span class="n">some_arr</span><span class="p">)</span>
</code></pre></div></div>

<div class="language-plaintext highlighter-rouge"><div class="highlight"><pre class="highlight"><code>[4174 3014 7538 5104 2044 6475 9522 6095 5399 4183  587 2049 3583  891
 4249 5871  222 9899 2115 2838 1454 8477 9462 8688 8820 8563 7787 6855
 4222 1583 7420 3261 2926 6972 6518 3374 8546 5285 2138 7135 9522 4794
  737  356 4037 3956 4313 8895 8411 7151 5577 3750 6538 9281 4723  218
 1396 8270 8603 9538 1458 6722 2007 6003 2545 6172  667 5687 7733  823
 6420  392 8123 4466 4725 1507 7450 3067 9035 4819 4123 2904 5058 8977
 6840 4094 9976 7208 4847  782 5157 5869 4338 2723 4299 9076 2350 6215
 2536 9875 2660 9415 3954 7371 9918 6908 6843  635 9867 5156 1747  389
  723 6645 7143 2258 7851 8436 9788 9851 1350 9688 5100 7621 8857 2605
 9706 1578 4838 9254  769 1503 5862 5590  970 9115 3794 4021 4555  414
 9722  389 8498 5542 1532 2975 7255 3622 2213 3407 3386 7277 5692 8348
 8328  257 5763 6974 6751 5141 2099 4528 4801 6631 9874 8595 8658 4862
 5049 1017 5050 2811 2730 9770 7428 6948 6993 4263  721 2036 1737 1403
 9454 2696 4577  876 3283 2694 5552 4392 9284 3520 6721 8348 7157 7443
 9116 5750 5613  901 2575  114 7047   18 1727 4713 2163 7447 4750 1519
 2361  336 6824 2563 6458 5233 6083  370 4454 5712 6403 2085 6377 4992
 9416 4225 1938 1758 8584  244 9112 2690 3281 5939 1098  597 6082 9659
 5359 7650 7784 4010 3858 8431 8440 6055 2678 7800 9156 9348 3446 8292
 4882 3321 8045  309 9927 8834 9324 3160 9903 8479 4314 4391 5184 4647
 1941 4310 1010 2877 9748 8743 1869 3710 4636 2887 9936 7555 9350 7095
  723 7353 3256 8871 8517 8018 7252 6276 3852 5653 1915 8004 7957 7605
 7308 3787 5259 9637 9199 3232 2386 1772 4443 2683 8617 1771 1437 8576
 4243 8950 4246  999 8168 4695 1420 1724 3329 1432 3286  508 3784 7066
 4361 9328 6695 6551 9749  476 7128 3410 2479 5586 5321 4842 7136 4302
 7881 5866 4193 8398 6298 5489 1526 9513  481 3216 3679 9534 5316 1390
 4763 5921 5360 6299 8271 6901  305 7171 9487 8145 9625 5280 4250 7478
 4532 2728 7669 7950 5678 2931 4515 8418  116 8335 9809 9084 9600 9225
 3945 2663 3169 8796 1167 8822 5570 2234 4792 5481 8909 4346 3107  770
 2568 1119 3762 3934 3489 2142 8797  154 8300 8618  343 5700 4279 3471
 7830 4936 6680 8843 6992 6924  133  748  482 6494 5879 7219 1462 4675
 2861 3406 5697 4873  792 2453 8257  317 8648 6538 3017 4965 9983 6006
 2617 9017 2461 3921 1118 4978 9979 4445  901 1101 6919 4891 2900 3636
 7353  834 5165 7775 1465 9477 8939 1061 7481 5913 1321 3723 1410 8456
 6969 2236 3401 4621 6194 4886 5343 2171 5075  131  526 4976 2721 7042
 3892 4661 6540 3706 1312 8319 9070 9792 4388 3797 7215 7964 5419 4331
 8503 4485   38 1829 3955 1953 1916 4390 7835 1512]
</code></pre></div></div>

<div class="language-python highlighter-rouge"><div class="highlight"><pre class="highlight"><code><span class="k">print</span><span class="p">(</span><span class="n">some_arr</span><span class="p">.</span><span class="nb">max</span><span class="p">())</span>
</code></pre></div></div>

<div class="language-plaintext highlighter-rouge"><div class="highlight"><pre class="highlight"><code>9983
</code></pre></div></div>

<p>The highest number in this array is 9983.</p>

<p>We can also rewrite it like this.</p>

<div class="language-python highlighter-rouge"><div class="highlight"><pre class="highlight"><code><span class="k">print</span><span class="p">(</span><span class="n">np</span><span class="p">.</span><span class="nb">max</span><span class="p">(</span><span class="n">some_arr</span><span class="p">))</span>
</code></pre></div></div>

<div class="language-plaintext highlighter-rouge"><div class="highlight"><pre class="highlight"><code>9983
</code></pre></div></div>

<h4>Min</h4>

<p>We can do the same to get the lowest number.</p>

<div class="language-python highlighter-rouge"><div class="highlight"><pre class="highlight"><code><span class="k">print</span><span class="p">(</span><span class="n">some_arr</span><span class="p">.</span><span class="nb">min</span><span class="p">())</span>
</code></pre></div></div>

<div class="language-plaintext highlighter-rouge"><div class="highlight"><pre class="highlight"><code>0
</code></pre></div></div>

<p>In this array, the lowest number is 0.</p>

<p>We can also rewrite it like this.</p>

<div class="language-python highlighter-rouge"><div class="highlight"><pre class="highlight"><code><span class="k">print</span><span class="p">(</span><span class="n">np</span><span class="p">.</span><span class="nb">min</span><span class="p">(</span><span class="n">some_arr</span><span class="p">))</span>
</code></pre></div></div>

<div class="language-plaintext highlighter-rouge"><div class="highlight"><pre class="highlight"><code>0
</code></pre></div></div>

<h4>Argmax</h4>

<p>We can also get the index at which the highest number is found using the argmax method.</p>

<div class="language-python highlighter-rouge"><div class="highlight"><pre class="highlight"><code><span class="k">print</span><span class="p">(</span><span class="n">some_arr</span><span class="p">.</span><span class="n">argmax</span><span class="p">())</span>
</code></pre></div></div>

<div class="language-plaintext highlighter-rouge"><div class="highlight"><pre class="highlight"><code>257
</code></pre></div></div>

<p>The highest number in this array (which is 9970) is located at index 257.</p>

<h4>Argmin</h4>

<p>The same applies to the minimum</p>

<div class="language-python highlighter-rouge"><div class="highlight"><pre class="highlight"><code><span class="k">print</span><span class="p">(</span><span class="n">some_arr</span><span class="p">.</span><span class="n">argmin</span><span class="p">())</span>
</code></pre></div></div>

<div class="language-plaintext highlighter-rouge"><div class="highlight"><pre class="highlight"><code>286
</code></pre></div></div>

<h3>Numpy Array Indexing</h3>

<p>Now that we took a look at some of the most useful NumPy methods, it is time to talk about array indexing.</p>

<p>So what is indexing in the first place? Well, indexing is the act of extracting a small portion of the array. It is very similar to the Python list’s indexing.</p>

<div class="language-python highlighter-rouge"><div class="highlight"><pre class="highlight"><code><span class="n">seq_array_1</span> <span class="o">=</span> <span class="n">np</span><span class="p">.</span><span class="n">arange</span><span class="p">(</span><span class="mi">0</span><span class="p">,</span><span class="mi">90</span><span class="p">,</span><span class="mi">2</span><span class="p">)</span>
</code></pre></div></div>

<div class="language-python highlighter-rouge"><div class="highlight"><pre class="highlight"><code><span class="k">print</span><span class="p">(</span><span class="n">seq_array_1</span><span class="p">)</span>
</code></pre></div></div>

<div class="language-plaintext highlighter-rouge"><div class="highlight"><pre class="highlight"><code>[ 0  2  4  6  8 10 12 14 16 18 20 22 24 26 28 30 32 34 36 38 40 42 44 46
 48 50 52 54 56 58 60 62 64 66 68 70 72 74 76 78 80 82 84 86 88]
</code></pre></div></div>

<p>If we want only to create a new array that contains numbers from 30 to 44 from the seq_array_1 array, we use the indexing at position 15 (which correspond to number 30) up to 23 (which correspond to number 46 so that 44 is included).</p>

<div class="language-python highlighter-rouge"><div class="highlight"><pre class="highlight"><code><span class="n">new_array</span> <span class="o">=</span> <span class="n">seq_array_1</span><span class="p">[</span><span class="mi">15</span><span class="p">:</span><span class="mi">23</span><span class="p">]</span>
</code></pre></div></div>

<div class="language-python highlighter-rouge"><div class="highlight"><pre class="highlight"><code><span class="k">print</span><span class="p">(</span><span class="n">new_array</span><span class="p">)</span>
</code></pre></div></div>

<div class="language-plaintext highlighter-rouge"><div class="highlight"><pre class="highlight"><code>[30 32 34 36 38 40 42 44]
</code></pre></div></div>

<p>We used the [ ] and passed as the first argument the starting point and the last argument the stopping point(remember that the stopping point is not included).</p>

<p>If we want to start from the first number, the start will be 0.</p>

<div class="language-python highlighter-rouge"><div class="highlight"><pre class="highlight"><code><span class="k">print</span><span class="p">(</span><span class="n">seq_array_1</span><span class="p">[</span><span class="mi">0</span><span class="p">:</span><span class="mi">16</span><span class="p">])</span>
</code></pre></div></div>

<div class="language-plaintext highlighter-rouge"><div class="highlight"><pre class="highlight"><code>[ 0  2  4  6  8 10 12 14 16 18 20 22 24 26 28 30]
</code></pre></div></div>

<p>We can achieve the same result by omitting the zero to save a lit bit of typing, like this.</p>

<div class="language-python highlighter-rouge"><div class="highlight"><pre class="highlight"><code><span class="k">print</span><span class="p">(</span><span class="n">seq_array_1</span><span class="p">[:</span><span class="mi">16</span><span class="p">])</span>
</code></pre></div></div>

<div class="language-plaintext highlighter-rouge"><div class="highlight"><pre class="highlight"><code>[ 0  2  4  6  8 10 12 14 16 18 20 22 24 26 28 30]
</code></pre></div></div>

<p>We can also do the same if we want to go until the end of the array.</p>

<div class="language-python highlighter-rouge"><div class="highlight"><pre class="highlight"><code><span class="k">print</span><span class="p">(</span><span class="n">seq_array_1</span><span class="p">[</span><span class="mi">16</span><span class="p">:])</span>
</code></pre></div></div>

<div class="language-plaintext highlighter-rouge"><div class="highlight"><pre class="highlight"><code>[32 34 36 38 40 42 44 46 48 50 52 54 56 58 60 62 64 66 68 70 72 74 76 78
 80 82 84 86 88]
</code></pre></div></div>

<p>We grabbed every element starting from index 16 up to the last one.</p>

<p>We can also use indexing to change the array like this</p>

<div class="language-python highlighter-rouge"><div class="highlight"><pre class="highlight"><code><span class="n">seq_array_1</span><span class="p">[</span><span class="mi">16</span><span class="p">:</span><span class="mi">20</span><span class="p">]</span> <span class="o">=</span> <span class="mi">100</span>
</code></pre></div></div>

<div class="language-python highlighter-rouge"><div class="highlight"><pre class="highlight"><code><span class="n">seq_array_1</span>
</code></pre></div></div>

<div class="language-plaintext highlighter-rouge"><div class="highlight"><pre class="highlight"><code>array([  0,   2,   4,   6,   8,  10,  12,  14,  16,  18,  20,  22,  24,
        26,  28,  30, 100, 100, 100, 100,  40,  42,  44,  46,  48,  50,
        52,  54,  56,  58,  60,  62,  64,  66,  68,  70,  72,  74,  76,
        78,  80,  82,  84,  86,  88])
</code></pre></div></div>

<p>We select the elements from index 16 up to 20 and set those to the value 100.</p>

<p>We can set a whole array to a specific value, like this.</p>

<div class="language-python highlighter-rouge"><div class="highlight"><pre class="highlight"><code><span class="n">sub_array</span> <span class="o">=</span> <span class="n">seq_array_1</span><span class="p">[:</span><span class="mi">5</span><span class="p">]</span>
</code></pre></div></div>

<div class="language-python highlighter-rouge"><div class="highlight"><pre class="highlight"><code><span class="n">sub_array</span><span class="p">[:]</span> <span class="o">=</span> <span class="mi">1</span>
</code></pre></div></div>

<div class="language-python highlighter-rouge"><div class="highlight"><pre class="highlight"><code><span class="k">print</span><span class="p">(</span><span class="n">sub_array</span><span class="p">)</span>
</code></pre></div></div>

<div class="language-plaintext highlighter-rouge"><div class="highlight"><pre class="highlight"><code>[1 1 1 1 1]
</code></pre></div></div>

<p>We have extracted a sub-array, then selected the whole sub-array and changed it to 1. However, here is the catch; what about the original array?</p>

<div class="language-python highlighter-rouge"><div class="highlight"><pre class="highlight"><code><span class="k">print</span><span class="p">(</span><span class="n">seq_array_1</span><span class="p">)</span>
</code></pre></div></div>

<div class="language-plaintext highlighter-rouge"><div class="highlight"><pre class="highlight"><code>[  1   1   1   1   1  10  12  14  16  18  20  22  24  26  28  30 100 100
 100 100  40  42  44  46  48  50  52  54  56  58  60  62  64  66  68  70
  72  74  76  78  80  82  84  86  88]
</code></pre></div></div>

<p>Surprise? Huh? Yeah, it is somewhat weird that the changes took place also in the seq_array_1. It means that seq_array_1 and sub_array refer to the same array in memory.</p>

<p>So logically, how can we fix this? Well, we create a copy of the original array then apply the changes only on the copied sub-array without affecting the original array.</p>

<div class="language-python highlighter-rouge"><div class="highlight"><pre class="highlight"><code><span class="n">sub_array_cop</span> <span class="o">=</span> <span class="n">seq_array_1</span><span class="p">.</span><span class="n">copy</span><span class="p">()</span>
</code></pre></div></div>

<div class="language-python highlighter-rouge"><div class="highlight"><pre class="highlight"><code><span class="n">sub_array_cop</span><span class="p">[:]</span> <span class="o">=</span> <span class="mi">55</span>
</code></pre></div></div>

<div class="language-python highlighter-rouge"><div class="highlight"><pre class="highlight"><code><span class="k">print</span><span class="p">(</span><span class="n">sub_array_cop</span><span class="p">)</span>
</code></pre></div></div>

<div class="language-plaintext highlighter-rouge"><div class="highlight"><pre class="highlight"><code>[55 55 55 55 55 55 55 55 55 55 55 55 55 55 55 55 55 55 55 55 55 55 55 55
 55 55 55 55 55 55 55 55 55 55 55 55 55 55 55 55 55 55 55 55 55]
</code></pre></div></div>

<div class="language-python highlighter-rouge"><div class="highlight"><pre class="highlight"><code><span class="k">print</span><span class="p">(</span><span class="n">seq_array_1</span><span class="p">)</span>
</code></pre></div></div>

<div class="language-plaintext highlighter-rouge"><div class="highlight"><pre class="highlight"><code>[  1   1   1   1   1  10  12  14  16  18  20  22  24  26  28  30 100 100
 100 100  40  42  44  46  48  50  52  54  56  58  60  62  64  66  68  70
  72  74  76  78  80  82  84  86  88]
</code></pre></div></div>

<p>This time you can see that the original array is unchanged because we created a new copy of it that does not affect the original array.</p>

<p>In a multidimensional array, we can select a specific array using indexing like this.</p>

<div class="language-python highlighter-rouge"><div class="highlight"><pre class="highlight"><code><span class="n">nD_array</span> <span class="o">=</span> <span class="n">np</span><span class="p">.</span><span class="n">random</span><span class="p">.</span><span class="n">randint</span><span class="p">(</span><span class="mi">0</span><span class="p">,</span><span class="n">high</span><span class="o">=</span><span class="mi">501</span><span class="p">,</span><span class="n">size</span><span class="o">=</span><span class="mi">300</span><span class="p">).</span><span class="n">reshape</span><span class="p">(</span><span class="mi">30</span><span class="p">,</span><span class="mi">10</span><span class="p">)</span>
</code></pre></div></div>

<div class="language-python highlighter-rouge"><div class="highlight"><pre class="highlight"><code><span class="k">print</span><span class="p">(</span><span class="n">nD_array</span><span class="p">)</span>
</code></pre></div></div>

<div class="language-plaintext highlighter-rouge"><div class="highlight"><pre class="highlight"><code>[[275 416 230 367 396 386  94  25 307 421]
 [312  34 243  55 284 461 113 384 285 174]
 [274 132 319 103 477 145 174 467  91 413]
 [ 54 469  73 143 488 310 420 424 202 300]
 [255  97 106 316 115  69 305 360 469 377]
 [338 450 479 193 249  64 452 306 468 338]
 [306 170 224 380 141 104 149 294 333 323]
 [382 252  49 335 283 256  71 227 282 319]
 [424 363 413 487   8 460 155 199 387 476]
 [ 36 470 335  68 409 473  16 361 330 206]
 [324  54 405 182 463 135 196 175  91 288]
 [446  71 358 482 480 151  27  92 105 398]
 [244  92  65  11 403 131 238 323 194 240]
 [332 319  78 363 317 344 172 400 274 293]
 [234 182  43 422 441 196 348 248 172 370]
 [283  74 413 336 183 421 170  34  15 442]
 [210 395 335 390  41 444 285 354 290  18]
 [214 305 292 469 484   8 359 434 464  62]
 [ 66 235 120 375  44 112 145 412 281 267]
 [498 446 212  11  74 190 299  65 487 365]
 [366 395 107 288 330 498 192 443 352 354]
 [401 150 390  34 220 186 319 483 344 241]
 [  2 325 476 293 485 417  85 432 240 235]
 [352 483  47  86 308 417 491 144 488 312]
 [325 359 499  41 203  70 485  33 273 295]
 [317 450 216  72 192 447  98 393 115 363]
 [255  75 178 269 150 233 458 202 434 166]
 [212 472 289 219  66 422  62  70 145 496]
 [102  71  30 228 220 351  92 100 259 237]
 [241 394 355 495 419  68 358  50 385  13]]
</code></pre></div></div>

<p>We created a random multidimensional array of 300 numbers with 0 as the lowest number, 501 as the highest number then reshaped it into 30 arrays with 10 numbers each.</p>

<p>If we want to only print, for example, the 10th array, we can pass 9 as the argument which is the index of the 10th array in the multidimensional array.</p>

<div class="language-python highlighter-rouge"><div class="highlight"><pre class="highlight"><code><span class="k">print</span><span class="p">(</span><span class="n">nD_array</span><span class="p">[</span><span class="mi">9</span><span class="p">])</span>
</code></pre></div></div>

<div class="language-plaintext highlighter-rouge"><div class="highlight"><pre class="highlight"><code>[ 36 470 335  68 409 473  16 361 330 206]
</code></pre></div></div>

<p>How about we get the 4th number in the 24th array? Well, there are two ways of doing this.</p>

<p>The first method is by using a double square bracket [ ], where the number in the first bracket represents the position of the array and the second is the position of the element we are looking for in the array.</p>

<div class="language-python highlighter-rouge"><div class="highlight"><pre class="highlight"><code><span class="k">print</span><span class="p">(</span><span class="n">nD_array</span><span class="p">[</span><span class="mi">23</span><span class="p">][</span><span class="mi">3</span><span class="p">])</span>
</code></pre></div></div>

<div class="language-plaintext highlighter-rouge"><div class="highlight"><pre class="highlight"><code>86
</code></pre></div></div>

<p>The second method uses only one square bracket [ ], where we pass two numbers separated by a comma. The first number is the array, and the second is the position of the number we are looking for in the array.</p>

<div class="language-python highlighter-rouge"><div class="highlight"><pre class="highlight"><code><span class="k">print</span><span class="p">(</span><span class="n">nD_array</span><span class="p">[</span><span class="mi">23</span><span class="p">,</span><span class="mi">3</span><span class="p">])</span>
</code></pre></div></div>

<div class="language-plaintext highlighter-rouge"><div class="highlight"><pre class="highlight"><code>86
</code></pre></div></div>

<p>We can use the method that makes more sense to you; I generally use the first method.</p>

<p>We can also choose a portion of arrays in a multidimensional array.</p>

<div class="language-python highlighter-rouge"><div class="highlight"><pre class="highlight"><code><span class="k">print</span><span class="p">(</span><span class="n">nD_array</span><span class="p">[</span><span class="mi">23</span><span class="p">:][</span><span class="mi">3</span><span class="p">:])</span>
</code></pre></div></div>

<div class="language-plaintext highlighter-rouge"><div class="highlight"><pre class="highlight"><code>[[255  75 178 269 150 233 458 202 434 166]
 [212 472 289 219  66 422  62  70 145 496]
 [102  71  30 228 220 351  92 100 259 237]
 [241 394 355 495 419  68 358  50 385  13]]
</code></pre></div></div>

<p>Here we have printed all the arrays from position 23 up to the end at the same time selected only elements from index 3 up to the end in each array.</p>

<p>Here is another example.</p>

<div class="language-python highlighter-rouge"><div class="highlight"><pre class="highlight"><code><span class="k">print</span><span class="p">(</span><span class="n">nD_array</span><span class="p">[</span><span class="mi">15</span><span class="p">:</span><span class="mi">23</span><span class="p">,</span><span class="mi">4</span><span class="p">:</span><span class="mi">9</span><span class="p">])</span>
</code></pre></div></div>

<div class="language-plaintext highlighter-rouge"><div class="highlight"><pre class="highlight"><code>[[183 421 170  34  15]
 [ 41 444 285 354 290]
 [484   8 359 434 464]
 [ 44 112 145 412 281]
 [ 74 190 299  65 487]
 [330 498 192 443 352]
 [220 186 319 483 344]
 [485 417  85 432 240]]
</code></pre></div></div>

<p>In the example above, we have only selected starting from array 15 up to array 22, then starting from elements 4 up to 9 within each array.</p>

<p>Last example</p>

<div class="language-python highlighter-rouge"><div class="highlight"><pre class="highlight"><code><span class="k">print</span><span class="p">(</span><span class="n">nD_array</span><span class="p">[:</span><span class="mi">5</span><span class="p">,</span><span class="mi">8</span><span class="p">:])</span>
</code></pre></div></div>

<div class="language-plaintext highlighter-rouge"><div class="highlight"><pre class="highlight"><code>[[307 421]
 [285 174]
 [ 91 413]
 [202 300]
 [469 377]]
</code></pre></div></div>

<p>Here, we selected all the array from the beginning up to array number 4 then all the elements from index 8 up to the end.</p>

<p>Now let’s see an interesting way to use NumPy array with boolean.</p>

<div class="language-python highlighter-rouge"><div class="highlight"><pre class="highlight"><code><span class="n">some_arr</span> <span class="o">=</span> <span class="n">np</span><span class="p">.</span><span class="n">arange</span><span class="p">(</span><span class="mi">0</span><span class="p">,</span><span class="mi">30</span><span class="p">,</span><span class="mi">2</span><span class="p">)</span>
</code></pre></div></div>

<div class="language-python highlighter-rouge"><div class="highlight"><pre class="highlight"><code><span class="k">print</span><span class="p">(</span><span class="n">some_arr</span><span class="p">)</span>
</code></pre></div></div>

<div class="language-plaintext highlighter-rouge"><div class="highlight"><pre class="highlight"><code>[ 0  2  4  6  8 10 12 14 16 18 20 22 24 26 28]
</code></pre></div></div>

<div class="language-python highlighter-rouge"><div class="highlight"><pre class="highlight"><code><span class="n">bool_arr</span> <span class="o">=</span> <span class="n">some_arr</span> <span class="o">&lt;</span> <span class="mi">15</span>
</code></pre></div></div>

<div class="language-python highlighter-rouge"><div class="highlight"><pre class="highlight"><code><span class="k">print</span><span class="p">(</span><span class="n">bool_arr</span><span class="p">)</span>
</code></pre></div></div>

<div class="language-plaintext highlighter-rouge"><div class="highlight"><pre class="highlight"><code>[ True  True  True  True  True  True  True  True False False False False
 False False False]
</code></pre></div></div>

<p>We use &gt;, &lt; or = directly on the array which will return another array composed of boolean values True or False. Internally, each number in the array is evaluated and compared to 15 if it is inferior to 15, then True is placed in the new array else False is used.</p>

<p>We can use the boolean array to get all elements in the original array that are inferior to 15.</p>

<div class="language-python highlighter-rouge"><div class="highlight"><pre class="highlight"><code><span class="k">print</span><span class="p">(</span><span class="n">some_arr</span><span class="p">[</span><span class="n">bool_arr</span><span class="p">])</span>
</code></pre></div></div>

<div class="language-plaintext highlighter-rouge"><div class="highlight"><pre class="highlight"><code>[ 0  2  4  6  8 10 12 14]
</code></pre></div></div>

<p>We could also have written it like this.</p>

<div class="language-python highlighter-rouge"><div class="highlight"><pre class="highlight"><code><span class="k">print</span><span class="p">(</span><span class="n">some_arr</span><span class="p">[</span><span class="n">some_arr</span> <span class="o">&lt;</span> <span class="mi">15</span><span class="p">])</span>
</code></pre></div></div>

<div class="language-plaintext highlighter-rouge"><div class="highlight"><pre class="highlight"><code>[ 0  2  4  6  8 10 12 14]
</code></pre></div></div>

<h3>Operations on Numpy’s Array</h3>

<p>We can apply different operations on a NumPy array as we have already seen with the multiplication operation. In this section, we will discuss how we can apply other operations on the array.</p>

<h4>Addition</h4>

<div class="language-python highlighter-rouge"><div class="highlight"><pre class="highlight"><code><span class="n">some_array</span> <span class="o">=</span> <span class="n">np</span><span class="p">.</span><span class="n">arange</span><span class="p">(</span><span class="mi">0</span><span class="p">,</span><span class="mi">20</span><span class="p">)</span>
</code></pre></div></div>

<div class="language-python highlighter-rouge"><div class="highlight"><pre class="highlight"><code><span class="k">print</span><span class="p">(</span><span class="n">some_array</span><span class="p">)</span>
</code></pre></div></div>

<div class="language-plaintext highlighter-rouge"><div class="highlight"><pre class="highlight"><code>[ 0  1  2  3  4  5  6  7  8  9 10 11 12 13 14 15 16 17 18 19]
</code></pre></div></div>

<div class="language-python highlighter-rouge"><div class="highlight"><pre class="highlight"><code><span class="k">print</span><span class="p">(</span><span class="n">some_array</span> <span class="o">+</span> <span class="mi">5</span><span class="p">)</span>
</code></pre></div></div>

<div class="language-plaintext highlighter-rouge"><div class="highlight"><pre class="highlight"><code>[ 5  6  7  8  9 10 11 12 13 14 15 16 17 18 19 20 21 22 23 24]
</code></pre></div></div>

<p>For each element in the array, we have added 5.</p>

<div class="language-python highlighter-rouge"><div class="highlight"><pre class="highlight"><code><span class="k">print</span><span class="p">(</span><span class="n">some_array</span> <span class="o">+</span> <span class="n">some_array</span><span class="p">)</span>
</code></pre></div></div>

<div class="language-plaintext highlighter-rouge"><div class="highlight"><pre class="highlight"><code>[ 0  2  4  6  8 10 12 14 16 18 20 22 24 26 28 30 32 34 36 38]
</code></pre></div></div>

<p>This time, we have added each element in the array with itself.</p>

<h4>Subtraction</h4>

<div class="language-python highlighter-rouge"><div class="highlight"><pre class="highlight"><code><span class="k">print</span><span class="p">(</span><span class="n">some_array</span> <span class="o">-</span> <span class="mi">2</span><span class="p">)</span>
</code></pre></div></div>

<div class="language-plaintext highlighter-rouge"><div class="highlight"><pre class="highlight"><code>[-2 -1  0  1  2  3  4  5  6  7  8  9 10 11 12 13 14 15 16 17]
</code></pre></div></div>

<p>We have subtracted each element by 2.</p>

<div class="language-python highlighter-rouge"><div class="highlight"><pre class="highlight"><code><span class="k">print</span><span class="p">(</span><span class="n">some_array</span> <span class="o">-</span> <span class="n">some_array</span><span class="p">)</span>
</code></pre></div></div>

<div class="language-plaintext highlighter-rouge"><div class="highlight"><pre class="highlight"><code>[0 0 0 0 0 0 0 0 0 0 0 0 0 0 0 0 0 0 0 0]
</code></pre></div></div>

<p>We have removed each element in the array by itself; we got 0 for each element.</p>

<h4>Multiplication</h4>

<div class="language-python highlighter-rouge"><div class="highlight"><pre class="highlight"><code><span class="k">print</span><span class="p">(</span><span class="n">some_array</span> <span class="o">*</span> <span class="mi">5</span><span class="p">)</span>
</code></pre></div></div>

<div class="language-plaintext highlighter-rouge"><div class="highlight"><pre class="highlight"><code>[ 0  5 10 15 20 25 30 35 40 45 50 55 60 65 70 75 80 85 90 95]
</code></pre></div></div>

<div class="language-python highlighter-rouge"><div class="highlight"><pre class="highlight"><code><span class="k">print</span><span class="p">(</span><span class="n">some_array</span> <span class="o">*</span> <span class="n">some_array</span><span class="p">)</span>
</code></pre></div></div>

<div class="language-plaintext highlighter-rouge"><div class="highlight"><pre class="highlight"><code>[  0   1   4   9  16  25  36  49  64  81 100 121 144 169 196 225 256 289
 324 361]
</code></pre></div></div>

<p>We have to multiply each element in the array by 5 and then by itself.</p>

<h4>Division</h4>

<div class="language-python highlighter-rouge"><div class="highlight"><pre class="highlight"><code><span class="k">print</span><span class="p">(</span><span class="n">some_array</span> <span class="o">/</span> <span class="mi">2</span><span class="p">)</span>
</code></pre></div></div>

<div class="language-plaintext highlighter-rouge"><div class="highlight"><pre class="highlight"><code>[0.  0.5 1.  1.5 2.  2.5 3.  3.5 4.  4.5 5.  5.5 6.  6.5 7.  7.5 8.  8.5
 9.  9.5]
</code></pre></div></div>

<div class="language-python highlighter-rouge"><div class="highlight"><pre class="highlight"><code><span class="k">print</span><span class="p">(</span><span class="n">some_array</span> <span class="o">/</span> <span class="n">some_array</span><span class="p">)</span>
</code></pre></div></div>

<div class="language-plaintext highlighter-rouge"><div class="highlight"><pre class="highlight"><code>[nan  1.  1.  1.  1.  1.  1.  1.  1.  1.  1.  1.  1.  1.  1.  1.  1.  1.
  1.  1.]


/anaconda3/lib/python3.7/site-packages/ipykernel_launcher.py:1: RuntimeWarning: invalid value encountered in true_divide
  """Entry point for launching an IPython kernel.
</code></pre></div></div>

<p>We have divided each element with 2 at first and then with itself. The first element is 0; we tried to divide 0 by 0 in the second example, which is impossible, that is why we have a warning label and got back nan as the first element in the array.</p>

<div class="language-python highlighter-rouge"><div class="highlight"><pre class="highlight"><code><span class="k">print</span><span class="p">(</span><span class="mi">1</span> <span class="o">/</span> <span class="n">some_array</span><span class="p">)</span>
</code></pre></div></div>

<div class="language-plaintext highlighter-rouge"><div class="highlight"><pre class="highlight"><code>[       inf 1.         0.5        0.33333333 0.25       0.2
 0.16666667 0.14285714 0.125      0.11111111 0.1        0.09090909
 0.08333333 0.07692308 0.07142857 0.06666667 0.0625     0.05882353
 0.05555556 0.05263158]


/anaconda3/lib/python3.7/site-packages/ipykernel_launcher.py:1: RuntimeWarning: divide by zero encountered in true_divide
  """Entry point for launching an IPython kernel.
</code></pre></div></div>

<p>When we try to divide 1 by 0, we get back infinity.</p>

<h4>Power</h4>

<div class="language-python highlighter-rouge"><div class="highlight"><pre class="highlight"><code><span class="k">print</span><span class="p">(</span><span class="n">some_array</span> <span class="o">**</span> <span class="mi">2</span><span class="p">)</span>
</code></pre></div></div>

<div class="language-plaintext highlighter-rouge"><div class="highlight"><pre class="highlight"><code>[  0   1   4   9  16  25  36  49  64  81 100 121 144 169 196 225 256 289
 324 361]
</code></pre></div></div>

<p>We applied the power of 2 on each element in the array.</p>

<h4>Square Root</h4>

<div class="language-python highlighter-rouge"><div class="highlight"><pre class="highlight"><code><span class="k">print</span><span class="p">(</span><span class="n">np</span><span class="p">.</span><span class="n">sqrt</span><span class="p">(</span><span class="n">some_array</span><span class="p">))</span>
</code></pre></div></div>

<div class="language-plaintext highlighter-rouge"><div class="highlight"><pre class="highlight"><code>[0.         1.         1.41421356 1.73205081 2.         2.23606798
 2.44948974 2.64575131 2.82842712 3.         3.16227766 3.31662479
 3.46410162 3.60555128 3.74165739 3.87298335 4.         4.12310563
 4.24264069 4.35889894]
</code></pre></div></div>

<p>NumPy has a built-in square root function. We got back the square root of each element in the array.</p>

<h4>Exponential</h4>

<div class="language-python highlighter-rouge"><div class="highlight"><pre class="highlight"><code><span class="k">print</span><span class="p">(</span><span class="n">np</span><span class="p">.</span><span class="n">exp</span><span class="p">(</span><span class="n">some_array</span><span class="p">))</span>
</code></pre></div></div>

<div class="language-plaintext highlighter-rouge"><div class="highlight"><pre class="highlight"><code>[1.00000000e+00 2.71828183e+00 7.38905610e+00 2.00855369e+01
 5.45981500e+01 1.48413159e+02 4.03428793e+02 1.09663316e+03
 2.98095799e+03 8.10308393e+03 2.20264658e+04 5.98741417e+04
 1.62754791e+05 4.42413392e+05 1.20260428e+06 3.26901737e+06
 8.88611052e+06 2.41549528e+07 6.56599691e+07 1.78482301e+08]
</code></pre></div></div>

<p>We got back the exponential of each element in the array.</p>

<h4>Cosine &amp; Sine</h4>

<div class="language-python highlighter-rouge"><div class="highlight"><pre class="highlight"><code><span class="k">print</span><span class="p">(</span><span class="n">np</span><span class="p">.</span><span class="n">cos</span><span class="p">(</span><span class="n">some_array</span><span class="p">))</span>
</code></pre></div></div>

<div class="language-plaintext highlighter-rouge"><div class="highlight"><pre class="highlight"><code>[ 1.          0.54030231 -0.41614684 -0.9899925  -0.65364362  0.28366219
  0.96017029  0.75390225 -0.14550003 -0.91113026 -0.83907153  0.0044257
  0.84385396  0.90744678  0.13673722 -0.75968791 -0.95765948 -0.27516334
  0.66031671  0.98870462]
</code></pre></div></div>

<div class="language-python highlighter-rouge"><div class="highlight"><pre class="highlight"><code><span class="k">print</span><span class="p">(</span><span class="n">np</span><span class="p">.</span><span class="n">sin</span><span class="p">(</span><span class="n">some_array</span><span class="p">))</span>
</code></pre></div></div>

<div class="language-plaintext highlighter-rouge"><div class="highlight"><pre class="highlight"><code>[ 0.          0.84147098  0.90929743  0.14112001 -0.7568025  -0.95892427
 -0.2794155   0.6569866   0.98935825  0.41211849 -0.54402111 -0.99999021
 -0.53657292  0.42016704  0.99060736  0.65028784 -0.28790332 -0.96139749
 -0.75098725  0.14987721]
</code></pre></div></div>

<p>We calculated the cosine and the sine of each element in the array.</p>

<h4>Logarithm</h4>

<div class="language-python highlighter-rouge"><div class="highlight"><pre class="highlight"><code><span class="k">print</span><span class="p">(</span><span class="n">np</span><span class="p">.</span><span class="n">log</span><span class="p">(</span><span class="n">some_array</span><span class="p">))</span>
</code></pre></div></div>

<div class="language-plaintext highlighter-rouge"><div class="highlight"><pre class="highlight"><code>[      -inf 0.         0.69314718 1.09861229 1.38629436 1.60943791
 1.79175947 1.94591015 2.07944154 2.19722458 2.30258509 2.39789527
 2.48490665 2.56494936 2.63905733 2.7080502  2.77258872 2.83321334
 2.89037176 2.94443898]


/anaconda3/lib/python3.7/site-packages/ipykernel_launcher.py:1: RuntimeWarning: divide by zero encountered in log
  """Entry point for launching an IPython kernel.
</code></pre></div></div>

<p>We can also get the logarithm of each element, except the first element, which is 0. We can not compute Log 0, that is why infinity was returned.</p>

<h3>Conclusion</h3>

<p>NumPy is one of those libraries in Machine Learning you can not ignore. It is pretty easy to get started with especially if you understand lists in Python, and we have seen some of its most used methods. However, this is just the tips of the iceberg because there is so much to learn NumPy that I can not cover it all. That is why I invite you to visit its documentation, which is pretty well written <a href="https://numpy.org/devdocs/" target="_blank">here</a>. You will find all the references, methods, and tricks of NumPy.</p>

<p>This post was a quick introduction to NumPy. In an upcoming post, we will work on some exciting exercises using NumPy to sharpen your skills, so stay tuned by subscribing to our mailing list.</p>

<p>Find the jupyter notebook version of this post on my GitHub profile <a href="https://github.com/semasuka/blog/blob/gh-pages/ipynb/NumPy%20Crash%20Course.ipynb" target="_blank">here.</a></p>

<p>Thank you for reading this tutorial. I hope you have learned one or two things. If you like this post, please subscribe to stay updated with new posts, and if you have a thought or a question, I would love to hear it by commenting below. Remember keep learning!</p>]]></content><author><name>Stern Semasuka</name></author><category term="python" /><category term="tutorial" /><category term="numpy" /><summary type="html"><![CDATA[One of the most used scientific computing library for python is without a doubt NumPy, Numpy, which is an abbreviation of Numerical Python, is very fast at computing arrays since it is mostly written in C programming. NumPy adds support for large, multi-dimensional arrays and matrices, along with an extensive collection of high-level mathematical functions (for linear algebra) to operate on these arrays.]]></summary><media:thumbnail xmlns:media="http://search.yahoo.com/mrss/" url="https://semasuka.github.io/blog/blog/assets/post_images/numpy.png" /><media:content medium="image" url="https://semasuka.github.io/blog/blog/assets/post_images/numpy.png" xmlns:media="http://search.yahoo.com/mrss/" /></entry></feed>