
Welcome back, guys! We will continue with part 2 in this series of Pandas exercise. I am very excited about this post because we will introducing DataFrame, the most used Pandas data structure. I hope you guys will enjoy this post.
With no further due, let’s get started.
We will start by importing Pandas and NumPy
import pandas as pd
import numpy as np
Ex 26: How to get the mean of a series grouped by another series?
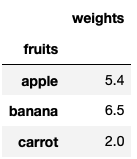
Q: Compute the mean of weights of each fruit.
fruits = pd.Series(np.random.choice(['apple', 'banana', 'carrot'], 10))
weights = pd.Series(np.linspace(1, 10, 10))
Desired output
# Keep in mind that your values will be different from mine and you might only randomly select only 2 fruits instead of 3.
Solution
fruits_weights = pd.concat({"fruits":fruits,"weights":weights},axis=1)
fruits_weights.groupby(by="fruits").mean()
| weights | |
|---|---|
| fruits | |
| apple | 5.4 |
| banana | 6.5 |
| carrot | 2.0 |
We concatenate horizontally (by setting the axis = 1) the two series into a dataframe by using the concat function and use that dataframe to group the fruits by the name of the fruit. After the grouping the dataframe, we get the mean of each fruit using the mean function.
Ex 27: How to compute the euclidean distance between two series?
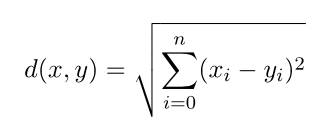
Q: Compute the Euclidean distance between series (points) p and q, using a packaged formula and another solution without.
Euclidean distance formular:
p = pd.Series([1, 2, 3, 4, 5, 6, 7, 8, 9, 10])
q = pd.Series([10, 9, 8, 7, 6, 5, 4, 3, 2, 1])
Desired output
# 18.165
Solution
1st Method using a built-in function
np.linalg.norm(p-q)
18.16590212458495
We can get the Euclidean distance by calling the NumPy function linalg.norm function and pass in the difference in the two series.
2nd Method without using a built-in function
sum((p - q)**2)**.5
18.16590212458495
Using the Euclidean formula provided, we can use operators to find the Euclidean distance. We first subtract the corresponding elements in the two series and apply 2 as an exponent then sum it up and finally get the square root.
Ex 28: How to find all the local maxima (or peaks) in a numeric series?
Q: Get the positions of peaks (values surrounded by smaller values on both sides) in ser.
ser = pd.Series([2, 10, 3, 4, 9, 10, 2, 7, 3])
Desired output
# array([1, 5, 7])
Solution
from scipy.signal import argrelextrema

argrelextrema(ser.values, np.greater)
(array([1, 5, 7]),)
To calculate the relative extrema of the series, we use argrelextrema function from the scipy (Scientific Python) which is a Python library close to NumPy used for mathematics, science, and engineering.
In that function, we pass in the series and the comparator. Since we are looking for the maxima, in this case, the comparator will be np.greater.
Ex 29: How to replace missing spaces in a string with the least frequent character?
Q: Replace the spaces in my_str with the least frequent character.
ser = pd.Series(list('dbc deb abed gagde'))
Desired output
# least frequent element is c

# ['d',
#  'b',
#  'c',
#  'c',
#  'd',
#  'e',
#  'b',
#  'c',
#  'a',
#  'b',
#  'e',
#  'd',
#  'c',
#  'g',
#  'a',
#  'g',
#  'd',
#  'e']
Solution
from collections import Counter

least_common_char = Counter(ser.replace(" ","")).most_common()[-1][0]
Counter(ser.replace(" ","")).most_common()
[('d', 4), ('b', 3), ('', 3), ('e', 3), ('a', 2), ('g', 2), ('c', 1)]
least_common_char
'c'
ser.replace(" ",least_common_char)
['d',
 'b',
 'c',
 'c',
 'd',
 'e',
 'b',
 'c',
 'a',
 'b',
 'e',
 'd',
 'c',
 'g',
 'a',
 'g',
 'd',
 'e']
To replace the white space with the most common element in the series, we need first to find the most common character in the series.
To find it, we use the counter function from the collection library. We pass in the series without the white space (by replacing “ “ by “”) and apply to the counter function, the most_common function. We will get back a list of tuples will all characters and their counts in decreasing order. We use -1 to target the last tuple and 0 to get the character in that tuple.
Now that we have the least common character, we can replace all the instances of white space by the least common character.
Ex 30: How to create a TimeSeries starting ‘2000-01-01’ and 10 weekends (Saturdays) and have random numbers as values?
Q: Create a TimeSeries starting ‘2000-01-01’ and 10 weekends (Saturdays) and have random numbers as values?
Desired output
# values will be different due to randomness

# 2000-01-01    4
# 2000-01-08    1
# 2000-01-15    8
# 2000-01-22    4
# 2000-01-29    4
# 2000-02-05    2
# 2000-02-12    4
# 2000-02-19    9
# 2000-02-26    6
# 2000-03-04    6
Solution
pd.Series(np.random.randint(1,high=10,size=10),pd.date_range(start="2000-01-01",periods=10,freq="W-SAT"))
2000-01-01    1
2000-01-08    9
2000-01-15    1
2000-01-22    3
2000-01-29    8
2000-02-05    7
2000-02-12    3
2000-02-19    8
2000-02-26    4
2000-03-04    7
Freq: W-SAT, dtype: int64
We create as the values of the series, the ten random numbers from 1 to 10 and as indexes, we create a date_range function which returns a date rage starting from 2000-01-01 and set the number of periods to generate to 10 with the frequency set to Saturday weekly. To get the list of all the frequencies, visit this link.
31: How to fill an intermittent time series so all missing dates show up with values of previous non-missing date?
Q:
ser has missing dates and values. Make all missing dates appear and fill up with value from previous date.
import pandas as pd
import numpy as np
ser = pd.Series([1,10,3,np.nan], index=pd.to_datetime(['2000-01-01', '2000-01-03', '2000-01-06', '2000-01-08']))
Desired output
# 2000-01-01     1.0
# 2000-01-02     1.0
# 2000-01-03    10.0
# 2000-01-04    10.0
# 2000-01-05    10.0
# 2000-01-06     3.0
# 2000-01-07     3.0
# 2000-01-08     NaN
Solution
ser.resample("D").ffill()
2000-01-01     1.0
2000-01-02     1.0
2000-01-03    10.0
2000-01-04    10.0
2000-01-05    10.0
2000-01-06     3.0
2000-01-07     3.0
2000-01-08     NaN
Freq: D, dtype: float64
We use the resample function to fill up all the days that are missing starting from 2000-01-01 to 2000-01-08 and uses the character D to specify that we want days as the interval. We then use ffill function to fill up the missing values from the previous row et voila!
32: How to compute the autocorrelations of a numeric series?
Q: Compute autocorrelations for the first 10 lags of ser. Find out which lag has the largest correlation.
ser = pd.Series(np.arange(20) + np.random.normal(1, 10, 20))
Desired output
# values will change due to randomness

# [-0.462232351922819,
#  0.24702149262453904,
#  -0.3667824631718427,
#  0.09378057953432406,
#  0.3382941938771548,
#  -0.04450324725676436,
#  0.16361925861505003,
#  -0.5351035019540977,
#  0.26359968436232056,
#  0.03944833988252732]
# the lag with the highest correlation is 8
Solution
autocorr = [ser.autocorr(lag=i) for i in range(11)][1:]
autocorr
[-0.462232351922819,
 0.24702149262453904,
 -0.3667824631718427,
 0.09378057953432406,
 0.3382941938771548,
 -0.04450324725676436,
 0.16361925861505003,
 -0.5351035019540977,
 0.26359968436232056,
 0.03944833988252732]
print("the lag with the highest correlation is {}".format(np.argmax(np.abs(autocorr))+1))
the lag with the highest correlation is 8
We first have to calculate the correlation between each consecutive number and to do that we loop through all the elements in the series using range and list comprehension. We use indexing to ignore the first correlation since the correction with the same element is 1.
After finding all the correlation, it is time to find the position of the largest correlation. To do this, we use the NumPy function argmax to get back the position of the largest absolute (by changing negative correlation to positive) correlation number and add 1 since the count starts from 0.
Ex 33: How to import only every nth row from a csv file to create a dataframe?
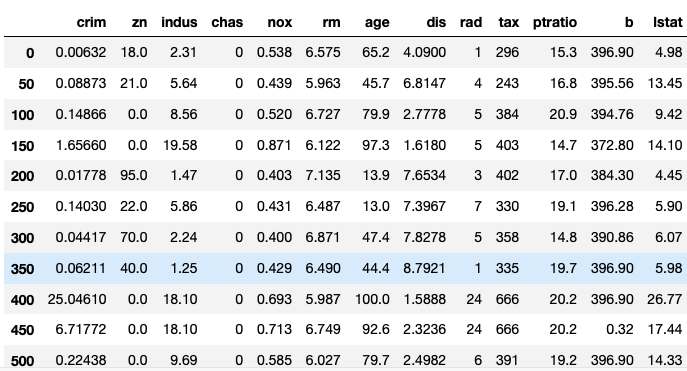
Q: Import every 50th row of BostonHousing dataset as a dataframe.
Desired output
Solution
boston_housing_dataset = pd.read_csv("https://raw.githubusercontent.com/selva86/datasets/master/BostonHousing.csv")
boston_housing_dataset.head()
| crim | zn | indus | chas | nox | rm | age | dis | rad | tax | ptratio | b | lstat | medv | |
|---|---|---|---|---|---|---|---|---|---|---|---|---|---|---|
| 0 | 0.00632 | 18.0 | 2.31 | 0 | 0.538 | 6.575 | 65.2 | 4.0900 | 1 | 296 | 15.3 | 396.90 | 4.98 | 24.0 |
| 1 | 0.02731 | 0.0 | 7.07 | 0 | 0.469 | 6.421 | 78.9 | 4.9671 | 2 | 242 | 17.8 | 396.90 | 9.14 | 21.6 |
| 2 | 0.02729 | 0.0 | 7.07 | 0 | 0.469 | 7.185 | 61.1 | 4.9671 | 2 | 242 | 17.8 | 392.83 | 4.03 | 34.7 |
| 3 | 0.03237 | 0.0 | 2.18 | 0 | 0.458 | 6.998 | 45.8 | 6.0622 | 3 | 222 | 18.7 | 394.63 | 2.94 | 33.4 |
| 4 | 0.06905 | 0.0 | 2.18 | 0 | 0.458 | 7.147 | 54.2 | 6.0622 | 3 | 222 | 18.7 | 396.90 | 5.33 | 36.2 |
boston_housing_dataset[::50]
| crim | zn | indus | chas | nox | rm | age | dis | rad | tax | ptratio | b | lstat | medv | |
|---|---|---|---|---|---|---|---|---|---|---|---|---|---|---|
| 0 | 0.00632 | 18.0 | 2.31 | 0 | 0.538 | 6.575 | 65.2 | 4.0900 | 1 | 296 | 15.3 | 396.90 | 4.98 | 24.0 |
| 50 | 0.08873 | 21.0 | 5.64 | 0 | 0.439 | 5.963 | 45.7 | 6.8147 | 4 | 243 | 16.8 | 395.56 | 13.45 | 19.7 |
| 100 | 0.14866 | 0.0 | 8.56 | 0 | 0.520 | 6.727 | 79.9 | 2.7778 | 5 | 384 | 20.9 | 394.76 | 9.42 | 27.5 |
| 150 | 1.65660 | 0.0 | 19.58 | 0 | 0.871 | 6.122 | 97.3 | 1.6180 | 5 | 403 | 14.7 | 372.80 | 14.10 | 21.5 |
| 200 | 0.01778 | 95.0 | 1.47 | 0 | 0.403 | 7.135 | 13.9 | 7.6534 | 3 | 402 | 17.0 | 384.30 | 4.45 | 32.9 |
| 250 | 0.14030 | 22.0 | 5.86 | 0 | 0.431 | 6.487 | 13.0 | 7.3967 | 7 | 330 | 19.1 | 396.28 | 5.90 | 24.4 |
| 300 | 0.04417 | 70.0 | 2.24 | 0 | 0.400 | 6.871 | 47.4 | 7.8278 | 5 | 358 | 14.8 | 390.86 | 6.07 | 24.8 |
| 350 | 0.06211 | 40.0 | 1.25 | 0 | 0.429 | 6.490 | 44.4 | 8.7921 | 1 | 335 | 19.7 | 396.90 | 5.98 | 22.9 |
| 400 | 25.04610 | 0.0 | 18.10 | 0 | 0.693 | 5.987 | 100.0 | 1.5888 | 24 | 666 | 20.2 | 396.90 | 26.77 | 5.6 |
| 450 | 6.71772 | 0.0 | 18.10 | 0 | 0.713 | 6.749 | 92.6 | 2.3236 | 24 | 666 | 20.2 | 0.32 | 17.44 | 13.4 |
| 500 | 0.22438 | 0.0 | 9.69 | 0 | 0.585 | 6.027 | 79.7 | 2.4982 | 6 | 391 | 19.2 | 396.90 | 14.33 | 16.8 |
To import a csv(comma-separated value) dataset, we use the read_csv function and pass in the link to the csv file. Now we have the dataset imported and stored in the boston_housing_dataset.
To get every 50th row in the dataset, we use indexing with a step of 50.
Ex 34: How to change column values when importing csv to a dataframe?
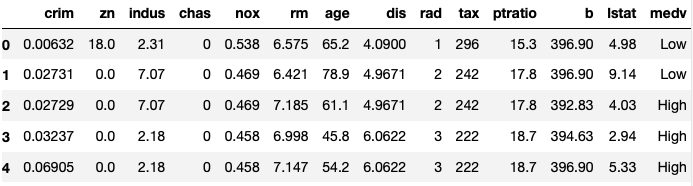
Q: Import the BostonHousing dataset dataset, but while importing change the ‘medv’ (median house value) column so that values < 25 becomes ‘Low’ and > 25 becomes ‘High’.
Desired output
Solution
boston_housing_dataset = pd.read_csv("https://raw.githubusercontent.com/selva86/datasets/master/BostonHousing.csv",converters={"medv": lambda x: "High" if float(x) > 25 else "Low"})
boston_housing_dataset.head()
| crim | zn | indus | chas | nox | rm | age | dis | rad | tax | ptratio | b | lstat | medv | |
|---|---|---|---|---|---|---|---|---|---|---|---|---|---|---|
| 0 | 0.00632 | 18.0 | 2.31 | 0 | 0.538 | 6.575 | 65.2 | 4.0900 | 1 | 296 | 15.3 | 396.90 | 4.98 | Low |
| 1 | 0.02731 | 0.0 | 7.07 | 0 | 0.469 | 6.421 | 78.9 | 4.9671 | 2 | 242 | 17.8 | 396.90 | 9.14 | Low |
| 2 | 0.02729 | 0.0 | 7.07 | 0 | 0.469 | 7.185 | 61.1 | 4.9671 | 2 | 242 | 17.8 | 392.83 | 4.03 | High |
| 3 | 0.03237 | 0.0 | 2.18 | 0 | 0.458 | 6.998 | 45.8 | 6.0622 | 3 | 222 | 18.7 | 394.63 | 2.94 | High |
| 4 | 0.06905 | 0.0 | 2.18 | 0 | 0.458 | 7.147 | 54.2 | 6.0622 | 3 | 222 | 18.7 | 396.90 | 5.33 | High |
To change the value of a column while importing the dataset, we use the parameter converters from the read_csv function. We pass in a dictionary with a key corresponding to the name of the column we want to change and value to be a lambda expression where “High” is for the value greater than 25 and “Low” is for the value less than 25.
Ex 35: How to create a dataframe with rows as strides from a given series?
Q: Create a dataframe with rows as strides from a given series with 2 as the stride length and 4 as length of each row.
the_series = pd.Series(range(15))
Desired output
# array([[ 0,  1,  2,  3],
#        [ 2,  3,  4,  5],
#        [ 4,  5,  6,  7],
#        [ 6,  7,  8,  9],
#        [ 8,  9, 10, 11],
#        [10, 11, 12, 13]])
Solution
def gen_strides(the_series, stride_len=2, window_len=4):
    n_strides = ((the_series.size - window_len)//stride_len) + 1
    return np.array([the_series[i:(i+window_len)] for i in np.arange(0,the_series.size,stride_len)[:n_strides]])

gen_strides(the_series)
[0 2 4]
Strides are used in CNN (convolutional neural network), which will be covered in a future post. To get the stride, we first create a function that takes in the stride length 2 (which mean that the two last elements in the row will be the same as the first two elements in the following row) and a window length of 4 (corresponding to the number of elements in the row or the number of columns).
We need first to get the numbers of rows by subtracting the size of the series by the number of element desired in a row and floor divide with the stride length and finally add 1.
We proceed by using the list comprehension by looping through an array that starts from 0, step by stride_len and stops at the_series.size. We use indexing with n_stride to get the first six elements because we only have six rows.
Now it is time to populate the rows, for each row we use the original series and start from index i to index i + window_len to get the strides.
Ex 36: How to import only specified columns from a csv file?
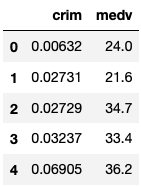
Q: Import crim and medv columns of the BostonHousing dataset as a dataframe.
Desired output
Solution
pd.read_csv("https://raw.githubusercontent.com/selva86/datasets/master/BostonHousing.csv",usecols=["crim","medv"]).head()
| crim | medv | |
|---|---|---|
| 0 | 0.00632 | 24.0 |
| 1 | 0.02731 | 21.6 |
| 2 | 0.02729 | 34.7 |
| 3 | 0.03237 | 33.4 |
| 4 | 0.06905 | 36.2 |
To import only the crim and the medv column, we pass a list of the names of those two columns the usecols parameter.
Ex 37: How to get the nrows, ncolumns, datatype, summary stats of each column of a dataframe? Also, get the array and list equivalent.
Q: Get the number of rows, columns, datatype, columns for each datatype and statistical summary of each column of the Cars93 dataset. Also, get the numpy array and list equivalent of the dataframe.
Desired output
# Rows and columns

#(93, 27)

# Datatype

# Manufacturer           object
# Model                  object
# Type                   object
# Min.Price             float64
# Price                 float64
# Max.Price             float64
# MPG.city              float64
# MPG.highway           float64
# AirBags                object
# DriveTrain             object
# Cylinders              object
# EngineSize            float64
# Horsepower            float64
# RPM                   float64
# Rev.per.mile          float64
# Man.trans.avail        object
# Fuel.tank.capacity    float64
# Passengers            float64
# Length                float64
# Wheelbase             float64
# Width                 float64
# Turn.circle           float64
# Rear.seat.room        float64
# Luggage.room          float64
# Weight                float64
# Origin                 object
# Make                   object
# dtype: object

# Columns for each datatype

# float64    18
# object      9
# dtype: int64

# Statistical summary

# Min.Price	Price	Max.Price	MPG.city	MPG.highway	EngineSize	Horsepower	RPM	Rev.per.mile	Fuel.tank.capacity	Passengers	Length	Wheelbase	Width	Turn.circle	Rear.seat.room	Luggage.room	Weight
# count	86.000000	91.000000	88.000000	84.000000	91.000000	91.000000	86.000000	90.000000	87.000000	85.000000	91.000000	89.000000	92.000000	87.000000	88.000000	89.000000	74.000000	86.000000
# mean	17.118605	19.616484	21.459091	22.404762	29.065934	2.658242	144.000000	5276.666667	2355.000000	16.683529	5.076923	182.865169	103.956522	69.448276	38.954545	27.853933	13.986486	3104.593023
# std	8.828290	9.724280	10.696563	5.841520	5.370293	1.045845	53.455204	605.554811	486.916616	3.375748	1.045953	14.792651	6.856317	3.778023	3.304157	3.018129	3.120824	600.129993
# min	6.700000	7.400000	7.900000	15.000000	20.000000	1.000000	55.000000	3800.000000	1320.000000	9.200000	2.000000	141.000000	90.000000	60.000000	32.000000	19.000000	6.000000	1695.000000
# 25%	10.825000	12.350000	14.575000	18.000000	26.000000	1.800000	100.750000	4800.000000	2017.500000	14.500000	4.000000	174.000000	98.000000	67.000000	36.000000	26.000000	12.000000	2647.500000
# 50%	14.600000	17.700000	19.150000	21.000000	28.000000	2.300000	140.000000	5200.000000	2360.000000	16.500000	5.000000	181.000000	103.000000	69.000000	39.000000	27.500000	14.000000	3085.000000
# 75%	20.250000	23.500000	24.825000	25.000000	31.000000	3.250000	170.000000	5787.500000	2565.000000	19.000000	6.000000	192.000000	110.000000	72.000000	42.000000	30.000000	16.000000	3567.500000
# max	45.400000	61.900000	80.000000	46.000000	50.000000	5.700000	300.000000	6500.000000	3755.000000	27.000000	8.000000	219.000000	119.000000	78.000000	45.000000	36.000000	22.000000	4105.000000

# NumPy array

# array(['Acura', 'Integra', 'Small', 12.9, 15.9, 18.8, 25.0, 31.0, 'None',
#        'Front', '4', 1.8, 140.0, 6300.0, 2890.0, 'Yes', 13.2, 5.0, 177.0,
#        102.0, 68.0, 37.0, 26.5, nan, 2705.0, 'non-USA', 'Acura Integra'],
#       dtype=object)

# List

# ['Acura',
#   'Integra',
#   'Small',
#   12.9,
#   15.9,
#   18.8,
#   25.0,
#   31.0,
#   'None',
#   'Front',
#   '4',
#   1.8,
#   140.0,
#   6300.0,
#   2890.0,
#   'Yes',
#   13.2,
#   5.0,
#   177.0,
#   102.0,
#   68.0,
#   37.0,
#   26.5,
#   nan,
#   2705.0,
#   'non-USA',
#   'Acura Integra']
Solution
cars_dataset = pd.read_csv("https://raw.githubusercontent.com/selva86/datasets/master/Cars93_miss.csv")
Shape
cars_dataset.shape
(93, 27)
We call the shape function on the dataset, we back a tuple with the first element as the number of rows and the second element is the number of columns in the dataframe.
Datatype
cars_dataset.dtypes
Manufacturer           object
Model                  object
Type                   object
Min.Price             float64
Price                 float64
Max.Price             float64
MPG.city              float64
MPG.highway           float64
AirBags                object
DriveTrain             object
Cylinders              object
EngineSize            float64
Horsepower            float64
RPM                   float64
Rev.per.mile          float64
Man.trans.avail        object
Fuel.tank.capacity    float64
Passengers            float64
Length                float64
Wheelbase             float64
Width                 float64
Turn.circle           float64
Rear.seat.room        float64
Luggage.room          float64
Weight                float64
Origin                 object
Make                   object
dtype: object
To get the datatype for each column, we call the dtypes function on the dataset.
Columns for each datatype
cars_dataset.dtypes.value_counts()
float64    18
object      9
dtype: int64
To get the columns count for each datatype, we call the value_counts on the dtype function.
Statistical summary
cars_dataset.describe()
| Min.Price | Price | Max.Price | MPG.city | MPG.highway | EngineSize | Horsepower | RPM | Rev.per.mile | Fuel.tank.capacity | Passengers | Length | Wheelbase | Width | Turn.circle | Rear.seat.room | Luggage.room | Weight | |
|---|---|---|---|---|---|---|---|---|---|---|---|---|---|---|---|---|---|---|
| count | 86.000000 | 91.000000 | 88.000000 | 84.000000 | 91.000000 | 91.000000 | 86.000000 | 90.000000 | 87.000000 | 85.000000 | 91.000000 | 89.000000 | 92.000000 | 87.000000 | 88.000000 | 89.000000 | 74.000000 | 86.000000 |
| mean | 17.118605 | 19.616484 | 21.459091 | 22.404762 | 29.065934 | 2.658242 | 144.000000 | 5276.666667 | 2355.000000 | 16.683529 | 5.076923 | 182.865169 | 103.956522 | 69.448276 | 38.954545 | 27.853933 | 13.986486 | 3104.593023 |
| std | 8.828290 | 9.724280 | 10.696563 | 5.841520 | 5.370293 | 1.045845 | 53.455204 | 605.554811 | 486.916616 | 3.375748 | 1.045953 | 14.792651 | 6.856317 | 3.778023 | 3.304157 | 3.018129 | 3.120824 | 600.129993 |
| min | 6.700000 | 7.400000 | 7.900000 | 15.000000 | 20.000000 | 1.000000 | 55.000000 | 3800.000000 | 1320.000000 | 9.200000 | 2.000000 | 141.000000 | 90.000000 | 60.000000 | 32.000000 | 19.000000 | 6.000000 | 1695.000000 |
| 25% | 10.825000 | 12.350000 | 14.575000 | 18.000000 | 26.000000 | 1.800000 | 100.750000 | 4800.000000 | 2017.500000 | 14.500000 | 4.000000 | 174.000000 | 98.000000 | 67.000000 | 36.000000 | 26.000000 | 12.000000 | 2647.500000 |
| 50% | 14.600000 | 17.700000 | 19.150000 | 21.000000 | 28.000000 | 2.300000 | 140.000000 | 5200.000000 | 2360.000000 | 16.500000 | 5.000000 | 181.000000 | 103.000000 | 69.000000 | 39.000000 | 27.500000 | 14.000000 | 3085.000000 |
| 75% | 20.250000 | 23.500000 | 24.825000 | 25.000000 | 31.000000 | 3.250000 | 170.000000 | 5787.500000 | 2565.000000 | 19.000000 | 6.000000 | 192.000000 | 110.000000 | 72.000000 | 42.000000 | 30.000000 | 16.000000 | 3567.500000 |
| max | 45.400000 | 61.900000 | 80.000000 | 46.000000 | 50.000000 | 5.700000 | 300.000000 | 6500.000000 | 3755.000000 | 27.000000 | 8.000000 | 219.000000 | 119.000000 | 78.000000 | 45.000000 | 36.000000 | 22.000000 | 4105.000000 |
To get the statistical summary (mean, std, percentile, min, max and count), we call the describe function on the dataset.
Dataframe to NumPy
cars_dataset.iloc[0].to_numpy()
array(['Acura', 'Integra', 'Small', 12.9, 15.9, 18.8, 25.0, 31.0, 'None',
       'Front', '4', 1.8, 140.0, 6300.0, 2890.0, 'Yes', 13.2, 5.0, 177.0,
       102.0, 68.0, 37.0, 26.5, nan, 2705.0, 'non-USA', 'Acura Integra'],
      dtype=object)
We extract the first row and call the to_numpy function to cast the row to a NumPy array. It is also possible to cast the whole dataframe to an array.
Dataframe to list
cars_dataset.iloc[0].values.tolist()
['Acura',
 'Integra',
 'Small',
 12.9,
 15.9,
 18.8,
 25.0,
 31.0,
 'None',
 'Front',
 '4',
 1.8,
 140.0,
 6300.0,
 2890.0,
 'Yes',
 13.2,
 5.0,
 177.0,
 102.0,
 68.0,
 37.0,
 26.5,
 nan,
 2705.0,
 'non-USA',
 'Acura Integra']
We extract the first row and call the tolist function on the values function to cast the row to a list. It is also possible to cast the whole dataframe to a list.
Ex 38: How to extract the row and column number of a particular cell with a given criterion?
Q: Which manufacturer, model and type have the highest Price? What are the row and column number of the cell with the highest Price value?
cars_dataset = pd.read_csv('https://raw.githubusercontent.com/selva86/datasets/master/Cars93_miss.csv')
Desired output
# Manufacturer with the highest price

# 'Mercedes-Benz'

# Model with the highest price

# '300E'

# Type with the highest price

# 'Midsize'

# row and column number of the cell with the highest Price value

# (array([58]), array([4]))
Solution
Manufacturer, model and midsize with the highest price
cars_dataset.iloc[np.argmax(cars_dataset["Price"])]["Manufacturer"]
'Mercedes-Benz'
cars_dataset.iloc[np.argmax(cars_dataset["Price"])]["Model"]
'300E'
cars_dataset.iloc[np.argmax(cars_dataset["Price"])]["Type"]
'Midsize'
We first find the row with the highest price using the NumPy argmax function by passing in the price column as an argument. With the index number of the row with the highest price, we use iloc to get all the columns of that row as Series and then use indexing on that Series to get the manufacturer, model and type.
Row and column with the highest price
np.where(cars_dataset.values == np.max(cars_dataset["Price"]))
(array([58]), array([4]))
We use the NumPy where function to compares all the values in the dataset with the highest price and returns a tuple with the row and column.
Ex 39: How to rename a specific column in a dataframe?
Q: Rename the column Type as CarType in df and replace the ‘.’ in column names with ‘_’.
cars_dataset = pd.read_csv('https://raw.githubusercontent.com/selva86/datasets/master/Cars93_miss.csv')
cars_dataset.columns
Index(['Manufacturer', 'Model', 'Type', 'Min.Price', 'Price', 'Max.Price',
       'MPG.city', 'MPG.highway', 'AirBags', 'DriveTrain', 'Cylinders',
       'EngineSize', 'Horsepower', 'RPM', 'Rev.per.mile', 'Man.trans.avail',
       'Fuel.tank.capacity', 'Passengers', 'Length', 'Wheelbase', 'Width',
       'Turn.circle', 'Rear.seat.room', 'Luggage.room', 'Weight', 'Origin',
       'Make'],
      dtype='object')
Desired output
# Index(['Manufacturer', 'Model', 'Type', 'Min_Price', 'Price', 'Max_Price',
#        'MPG_city', 'MPG_highway', 'AirBags', 'DriveTrain', 'Cylinders',
#        'EngineSize', 'Horsepower', 'RPM', 'Rev_per_mile', 'Man_trans_avail',
#        'Fuel_tank_capacity', 'Passengers', 'Length', 'Wheelbase', 'Width',
#        'Turn_circle', 'Rear_seat_room', 'Luggage_room', 'Weight', 'Origin',
#        'Make'],
#       dtype='object')
Solution
cars_dataset.columns.str.replace(".","_")
Index(['Manufacturer', 'Model', 'Type', 'Min_Price', 'Price', 'Max_Price',
       'MPG_city', 'MPG_highway', 'AirBags', 'DriveTrain', 'Cylinders',
       'EngineSize', 'Horsepower', 'RPM', 'Rev_per_mile', 'Man_trans_avail',
       'Fuel_tank_capacity', 'Passengers', 'Length', 'Wheelbase', 'Width',
       'Turn_circle', 'Rear_seat_room', 'Luggage_room', 'Weight', 'Origin',
       'Make'],
      dtype='object')
To replace all the occurrences of . by _ we use the str function which captures the columns as string data type and uses the replace function to achieve the column’s name change.
Ex 40: How to check if a dataframe has any missing values?
Q: Check if cars_dataset has any missing values.
cars_dataset = pd.read_csv('https://raw.githubusercontent.com/selva86/datasets/master/Cars93_miss.csv')
Desired output
# There are nan values in the dataset, so true has to be returned

# True
Solution
cars_dataset.isnull().values.any()
True
To check if there is any nan value in the whole dataset, we first use the isnull function to return booleans in each cell of the dataframe. true will be returned in a cell with a nan value and false will be a cell without a nan value. So to check if there any nan in the dataset, we use any on the values in the dataset. If there is at least one nan value true will be returned otherwise it will befalse.
Ex 41: How to count the number of missing values in each column?
Q: Count the number of missing values in each column of df. Which column has the maximum number of missing values?
cars_dataset = pd.read_csv('https://raw.githubusercontent.com/selva86/datasets/master/Cars93_miss.csv')
Desired output
# Count of missing values in each column

# Manufacturer           4
# Model                  1
# Type                   3
# Min.Price              7
# Price                  2
# Max.Price              5
# MPG.city               9
# MPG.highway            2
# AirBags                6
# DriveTrain             7
# Cylinders              5
# EngineSize             2
# Horsepower             7
# RPM                    3
# Rev.per.mile           6
# Man.trans.avail        5
# Fuel.tank.capacity     8
# Passengers             2
# Length                 4
# Wheelbase              1
# Width                  6
# Turn.circle            5
# Rear.seat.room         4
# Luggage.room          19
# Weight                 7
# Origin                 5
# Make                   3
# dtype: int64

# column with the maximum number of missing values

# 'Luggage.room'
Solution
nan_per_column = cars_dataset.isnull().sum()
nan_per_column
Manufacturer           4
Model                  1
Type                   3
Min.Price              7
Price                  2
Max.Price              5
MPG.city               9
MPG.highway            2
AirBags                6
DriveTrain             7
Cylinders              5
EngineSize             2
Horsepower             7
RPM                    3
Rev.per.mile           6
Man.trans.avail        5
Fuel.tank.capacity     8
Passengers             2
Length                 4
Wheelbase              1
Width                  6
Turn.circle            5
Rear.seat.room         4
Luggage.room          19
Weight                 7
Origin                 5
Make                   3
dtype: int64
cars_data.columns[nan_per_column.argmax()]
'Luggage.room'
To get the count of nan values in each column, we use the isnull function. This function will return True in each cell where there is a nan value or False where there is any other value other than nan. Finally, we apply the sum function, to get back a series where the indexes are the column names and the values are the count of nan value in each column.
To know which column has the highest number of nan, we use the argmax function which will return the index (column name in this case) with the highest count.
Ex 42: How to replace missing values of multiple numeric columns with the mean?
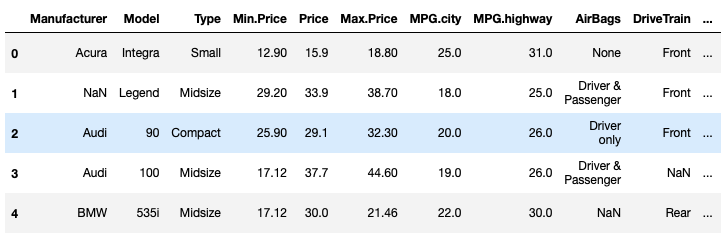
Q: Replace missing values in Min.Price and Max.Price columns with their respective mean.
cars_dataset = pd.read_csv('https://raw.githubusercontent.com/selva86/datasets/master/Cars93_miss.csv')
Desired output
Solution
1st Method
min_price_mean = round(cars_dataset["Min.Price"].mean(),2)
max_price_mean = round(cars_dataset["Max.Price"].mean(),2)
cars_dataset["Min.Price"].replace(np.nan,min_price_mean,inplace=True)
cars_dataset["Max.Price"].replace(np.nan,max_price_mean,inplace=True)
cars_dataset.head()
| Manufacturer | Model | Type | Min.Price | Price | Max.Price | MPG.city | MPG.highway | AirBags | DriveTrain | ... | Passengers | Length | Wheelbase | Width | Turn.circle | Rear.seat.room | Luggage.room | Weight | Origin | Make | |
|---|---|---|---|---|---|---|---|---|---|---|---|---|---|---|---|---|---|---|---|---|---|
| 0 | Acura | Integra | Small | 12.90 | 15.9 | 18.80 | 25.0 | 31.0 | None | Front | ... | 5.0 | 177.0 | 102.0 | 68.0 | 37.0 | 26.5 | NaN | 2705.0 | non-USA | Acura Integra |
| 1 | NaN | Legend | Midsize | 29.20 | 33.9 | 38.70 | 18.0 | 25.0 | Driver & Passenger | Front | ... | 5.0 | 195.0 | 115.0 | 71.0 | 38.0 | 30.0 | 15.0 | 3560.0 | non-USA | Acura Legend |
| 2 | Audi | 90 | Compact | 25.90 | 29.1 | 32.30 | 20.0 | 26.0 | Driver only | Front | ... | 5.0 | 180.0 | 102.0 | 67.0 | 37.0 | 28.0 | 14.0 | 3375.0 | non-USA | Audi 90 |
| 3 | Audi | 100 | Midsize | 17.12 | 37.7 | 44.60 | 19.0 | 26.0 | Driver & Passenger | NaN | ... | 6.0 | 193.0 | 106.0 | NaN | 37.0 | 31.0 | 17.0 | 3405.0 | non-USA | Audi 100 |
| 4 | BMW | 535i | Midsize | 17.12 | 30.0 | 21.46 | 22.0 | 30.0 | NaN | Rear | ... | 4.0 | 186.0 | 109.0 | 69.0 | 39.0 | 27.0 | 13.0 | 3640.0 | non-USA | BMW 535i |
5 rows × 27 columns
The first way to solve this problem is to use the replace function. First, we need to find the mean of the Min.Price and Max.Price columns and round it by two decimal places using round.
After that, we select the columns and use the replace function to replace all the occurrences of the nan value with the means previously found and finally set the inplace argument to True, to apply the changes on the original dataset.
2nd Method
cars_dataset[["Min.Price","Max.Price"]] = cars_dataset[["Min.Price","Max.Price"]].apply(lambda x: x.fillna(round(x.mean(),2)))
cars_dataset.head()
| Manufacturer | Model | Type | Min.Price | Price | Max.Price | MPG.city | MPG.highway | AirBags | DriveTrain | ... | Passengers | Length | Wheelbase | Width | Turn.circle | Rear.seat.room | Luggage.room | Weight | Origin | Make | |
|---|---|---|---|---|---|---|---|---|---|---|---|---|---|---|---|---|---|---|---|---|---|
| 0 | Acura | Integra | Small | 12.90 | 15.9 | 18.80 | 25.0 | 31.0 | None | Front | ... | 5.0 | 177.0 | 102.0 | 68.0 | 37.0 | 26.5 | NaN | 2705.0 | non-USA | Acura Integra |
| 1 | NaN | Legend | Midsize | 29.20 | 33.9 | 38.70 | 18.0 | 25.0 | Driver & Passenger | Front | ... | 5.0 | 195.0 | 115.0 | 71.0 | 38.0 | 30.0 | 15.0 | 3560.0 | non-USA | Acura Legend |
| 2 | Audi | 90 | Compact | 25.90 | 29.1 | 32.30 | 20.0 | 26.0 | Driver only | Front | ... | 5.0 | 180.0 | 102.0 | 67.0 | 37.0 | 28.0 | 14.0 | 3375.0 | non-USA | Audi 90 |
| 3 | Audi | 100 | Midsize | 17.12 | 37.7 | 44.60 | 19.0 | 26.0 | Driver & Passenger | NaN | ... | 6.0 | 193.0 | 106.0 | NaN | 37.0 | 31.0 | 17.0 | 3405.0 | non-USA | Audi 100 |
| 4 | BMW | 535i | Midsize | 17.12 | 30.0 | 21.46 | 22.0 | 30.0 | NaN | Rear | ... | 4.0 | 186.0 | 109.0 | 69.0 | 39.0 | 27.0 | 13.0 | 3640.0 | non-USA | BMW 535i |
5 rows × 27 columns
The alternative way to solve this is to use the fillna function. We start by selecting the two columns and then use the apply function with the lambda expression and pass in the mean function of x (x is the column selected). Then we assign the expression to the columns to make it in place.
43 : How to use the apply function on existing columns with global variables as additional arguments?
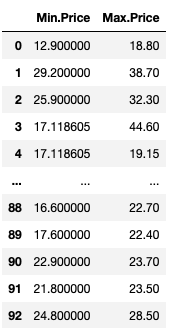
Q: In dataframe, use the apply method to replace the missing values in Min.Price with the column’s mean and those in Max.Price with the column’s median.
cars_dataset = pd.read_csv('https://raw.githubusercontent.com/selva86/datasets/master/Cars93_miss.csv')
Desired output
Solution
dict_fun = {"Min.Price":np.nanmean,"Max.Price":np.nanmedian}

cars_dataset[["Min.Price","Max.Price"]].apply(lambda x, dict_fun: x.fillna(dict_fun[x.name](x)),args=(dict_fun,))
| Min.Price | Max.Price | |
|---|---|---|
| 0 | 12.900000 | 18.80 |
| 1 | 29.200000 | 38.70 |
| 2 | 25.900000 | 32.30 |
| 3 | 17.118605 | 44.60 |
| 4 | 17.118605 | 19.15 |
| ... | ... | ... |
| 88 | 16.600000 | 22.70 |
| 89 | 17.600000 | 22.40 |
| 90 | 22.900000 | 23.70 |
| 91 | 21.800000 | 23.50 |
| 92 | 24.800000 | 28.50 |
93 rows × 2 columns
We first create a dictionary with Min.Price column as the key and value as the NumPy function to calculate the mean, then the second value has Max.Price column as the key and NumPy median function as the value.
We select the Min.Price and Max.Price columns, apply the lambda expression, and replace in each instance of nan in x(representing the columns) by the mean or median of that column using the fillna function and pass in the dictionary’s value.
Note: Refer to this StackOverflow question to learn more.
44: How to select a specific column from a dataframe as a dataframe instead of a series?
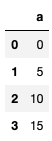
Q: Get the first column a in dataframe as a dataframe (rather than as a Series).
tab = pd.DataFrame(np.arange(20).reshape(-1, 5), columns=list('abcde'))
Desired output
# Data type

# pandas.core.frame.DataFrame
Solution
1st Method
type(the_dataframe["a"].to_frame())
pandas.core.frame.DataFrame
The first method is straight forward, we get column a as a series and then we cast it to a dataframe.
2nd Method
type(the_dataframe.loc[:,["a"]])
pandas.core.frame.DataFrame
We can get directly deduce a column as a dataframe by using the loc function and pass in the name of the column with brackets around it.
3rd Method
type(the_dataframe[['a']])
pandas.core.frame.DataFrame
Something similar can be achieve using indexing.
4th Method
type(the_dataframe.iloc[:, [0]])
pandas.core.frame.DataFrame
Same as iloc.
Note: If you want to understand the difference between loc and iloc, read this page from StackOverflow
Ex 45: How to change the order of columns of a Dataframe?
Q:
-
In
the_dataframe, interchange columnsaandc. -
Create a generic function to interchange two columns, without hardcoding column names.
-
Sort the columns in reverse alphabetical order, starting from column
efirst through columnalast.
import pandas as pd
import numpy as np
the_dataframe = pd.DataFrame(np.arange(20).reshape(-1, 5), columns=list('abcde'))
Desired output
Solution
Q1
the_dataframe
| a | b | c | d | e | |
|---|---|---|---|---|---|
| 0 | 0 | 1 | 2 | 3 | 4 |
| 1 | 5 | 6 | 7 | 8 | 9 |
| 2 | 10 | 11 | 12 | 13 | 14 |
| 3 | 15 | 16 | 17 | 18 | 19 |
the_columns = list(the_dataframe.columns)
the_columns
['a', 'b', 'c', 'd', 'e']
a, c = the_columns.index("a"), the_columns.index("c")
the_columns[a], the_columns[c] = the_columns[c], the_columns[a]
the_dataframe = the_dataframe[the_columns]
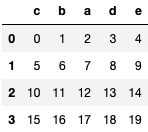
the_dataframe
| c | b | a | d | e | |
|---|---|---|---|---|---|
| 0 | 2 | 1 | 0 | 3 | 4 |
| 1 | 7 | 6 | 5 | 8 | 9 |
| 2 | 12 | 11 | 10 | 13 | 14 |
| 3 | 17 | 16 | 15 | 18 | 19 |
To interchange column a by c, we first get all the column name as a list and store it in the_columns variable. We then extract the indexes of a and c which are 0 and 2 respectively, then swap them in the_columns list using the indexes previously extracted.
We finally use indexing in the original dataframe to now swap the columns name and values from column a and c.
Q2
def swap_col(col_1,col_2,df):
    all_col = list(df.columns)
    col_1_idx, col_2_idx = all_col.index(col_1), all_col.index(col_2)
    all_col[col_1_idx],all_col[col_2_idx] = all_col[col_2_idx], all_col[col_1_idx]
    return df[all_col]


print(swap_col("d","b",the_dataframe))
    c   d   a   b   e
0   2   3   0   1   4
1   7   8   5   6   9
2  12  13  10  11  14
3  17  18  15  16  19
This function is based on the same steps as Q1. Instead of using the names of the columns a and b, we use generic names parameters col_1 and col_2 and pass in the original dataframe as df. The rest is the same as Q1.
Q3
the_columns_reversed = sorted(the_dataframe.columns,reverse=True)
the_dataframe[the_columns_reversed]
| e | d | c | b | a | |
|---|---|---|---|---|---|
| 0 | 4 | 3 | 2 | 1 | 0 |
| 1 | 9 | 8 | 7 | 6 | 5 |
| 2 | 14 | 13 | 12 | 11 | 10 |
| 3 | 19 | 18 | 17 | 16 | 15 |
For this subquestion, we get first the reversed list of columns starting from e to a and store it in the the_columns_reversed variable. We use indexing on the original dataframe to get the columns aligned in reverse alphabetical order.
Ex 46: How to set the number of rows and columns displayed in the output?
Q: Change the pandas display settings on printing the dataframe df it shows a maximum of 10 rows and 10 columns.
the_dataframe = pd.read_csv('https://raw.githubusercontent.com/selva86/datasets/master/Cars93_miss.csv')
Desired output
Solution
1st Method
pd.options.display.max_columns = 10
pd.options.display.max_rows = 10
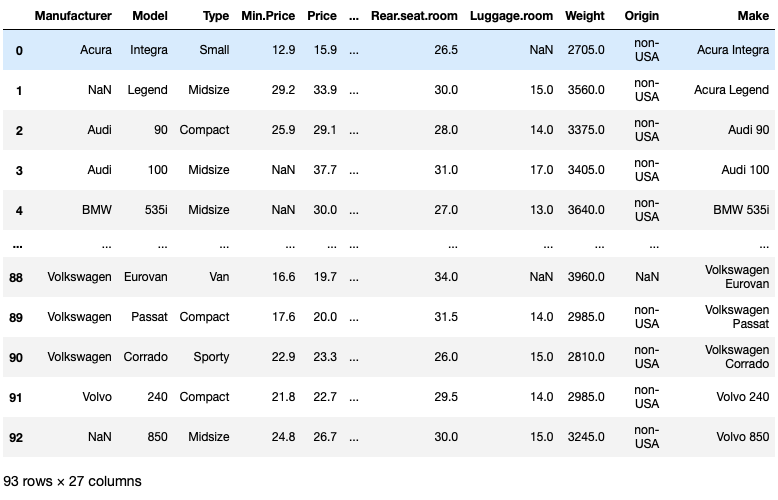
the_dataframe
| Manufacturer | Model | Type | Min.Price | Price | ... | Rear.seat.room | Luggage.room | Weight | Origin | Make | |
|---|---|---|---|---|---|---|---|---|---|---|---|
| 0 | Acura | Integra | Small | 12.9 | 15.9 | ... | 26.5 | NaN | 2705.0 | non-USA | Acura Integra |
| 1 | NaN | Legend | Midsize | 29.2 | 33.9 | ... | 30.0 | 15.0 | 3560.0 | non-USA | Acura Legend |
| 2 | Audi | 90 | Compact | 25.9 | 29.1 | ... | 28.0 | 14.0 | 3375.0 | non-USA | Audi 90 |
| 3 | Audi | 100 | Midsize | NaN | 37.7 | ... | 31.0 | 17.0 | 3405.0 | non-USA | Audi 100 |
| 4 | BMW | 535i | Midsize | NaN | 30.0 | ... | 27.0 | 13.0 | 3640.0 | non-USA | BMW 535i |
| ... | ... | ... | ... | ... | ... | ... | ... | ... | ... | ... | ... |
| 88 | Volkswagen | Eurovan | Van | 16.6 | 19.7 | ... | 34.0 | NaN | 3960.0 | NaN | Volkswagen Eurovan |
| 89 | Volkswagen | Passat | Compact | 17.6 | 20.0 | ... | 31.5 | 14.0 | 2985.0 | non-USA | Volkswagen Passat |
| 90 | Volkswagen | Corrado | Sporty | 22.9 | 23.3 | ... | 26.0 | 15.0 | 2810.0 | non-USA | Volkswagen Corrado |
| 91 | Volvo | 240 | Compact | 21.8 | 22.7 | ... | 29.5 | 14.0 | 2985.0 | non-USA | Volvo 240 |
| 92 | NaN | 850 | Midsize | 24.8 | 26.7 | ... | 30.0 | 15.0 | 3245.0 | non-USA | Volvo 850 |
93 rows × 27 columns
2nd Method
pd.set_option('display.max_columns', 10)
pd.set_option('display.max_rows', 10)
the_dataframe
| Manufacturer | Model | Type | Min.Price | Price | ... | Rear.seat.room | Luggage.room | Weight | Origin | Make | |
|---|---|---|---|---|---|---|---|---|---|---|---|
| 0 | Acura | Integra | Small | 12.9 | 15.9 | ... | 26.5 | NaN | 2705.0 | non-USA | Acura Integra |
| 1 | NaN | Legend | Midsize | 29.2 | 33.9 | ... | 30.0 | 15.0 | 3560.0 | non-USA | Acura Legend |
| 2 | Audi | 90 | Compact | 25.9 | 29.1 | ... | 28.0 | 14.0 | 3375.0 | non-USA | Audi 90 |
| 3 | Audi | 100 | Midsize | NaN | 37.7 | ... | 31.0 | 17.0 | 3405.0 | non-USA | Audi 100 |
| 4 | BMW | 535i | Midsize | NaN | 30.0 | ... | 27.0 | 13.0 | 3640.0 | non-USA | BMW 535i |
| ... | ... | ... | ... | ... | ... | ... | ... | ... | ... | ... | ... |
| 88 | Volkswagen | Eurovan | Van | 16.6 | 19.7 | ... | 34.0 | NaN | 3960.0 | NaN | Volkswagen Eurovan |
| 89 | Volkswagen | Passat | Compact | 17.6 | 20.0 | ... | 31.5 | 14.0 | 2985.0 | non-USA | Volkswagen Passat |
| 90 | Volkswagen | Corrado | Sporty | 22.9 | 23.3 | ... | 26.0 | 15.0 | 2810.0 | non-USA | Volkswagen Corrado |
| 91 | Volvo | 240 | Compact | 21.8 | 22.7 | ... | 29.5 | 14.0 | 2985.0 | non-USA | Volvo 240 |
| 92 | NaN | 850 | Midsize | 24.8 | 26.7 | ... | 30.0 | 15.0 | 3245.0 | non-USA | Volvo 850 |
93 rows × 27 columns
By change the max_columns or max_rows from the pandas’ display option either by using the dot operator or by calling the set_option, we can print only the five first and last rows/columns. All the rows/columns in between are abstracted by three dotes...
Ex 47: How to format or suppress scientific notations in a pandas dataframe?
Q: Suppress scientific notations like e-03 in the_dataframe and print up to 4 numbers after the decimal.
the_dataframe = pd.DataFrame(np.random.random(4)**10, columns=['random'])
the_dataframe
| random | |
|---|---|
| 0 | 7.694142e-18 |
| 1 | 2.132125e-02 |
| 2 | 1.673025e-02 |
| 3 | 3.668673e-01 |
Desired output
# Your result will be different from mine as the numbers are randomly generated
Solution
1st Method
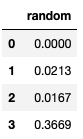
pd.options.display.float_format = '{:.4f}'.format
the_dataframe
| random | |
|---|---|
| 0 | 0.0000 |
| 1 | 0.0213 |
| 2 | 0.0167 |
| 3 | 0.3669 |
2nd Method
pd.set_option("display.float_format", '{:.4f}'.format)
the_dataframe
| random | |
|---|---|
| 0 | 0.0000 |
| 1 | 0.0213 |
| 2 | 0.0167 |
| 3 | 0.3669 |
To suppress the scientific notation, we use display.float_format or the set_option function just like we did in the previous exercise and we use this time '{:.4f}'.format to tell Pandas that we want to display numbers with a four decimal points.
Ex 48: How to format all the values in a Dataframe as percentages?
Q: Format the values in column random of the_dataframe as percentages.
the_dataframe = pd.DataFrame(np.random.random(4), columns=['random'])
the_dataframe
| random | |
|---|---|
| 0 | 0.5170 |
| 1 | 0.0474 |
| 2 | 0.4878 |
| 3 | 0.9220 |
Desired output
# Your result will be different from mine as the numbers are randomly generated
Solution
1st Method
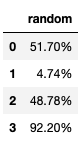
pd.set_option("display.float_format", '{:.2%}'.format)
the_dataframe
| random | |
|---|---|
| 0 | 51.70% |
| 1 | 4.74% |
| 2 | 48.78% |
| 3 | 92.20% |
2nd Method
pd.options.display.float_format = '{:.2%}'.format
the_dataframe
| random | |
|---|---|
| 0 | 51.70% |
| 1 | 4.74% |
| 2 | 48.78% |
| 3 | 92.20% |
Just as we did in the previous exercise, we use display.float_format or the set_option function but this time to display the values as percentages, we use '{:.2%}'.format.
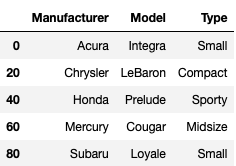
Ex 49: How to filter every nth row in a Dataframe?
Q: From cars_dataset, filter the Manufacturer, Model and Type for every 20th row starting from 1st (row 0).
cars_dataset = pd.read_csv('https://raw.githubusercontent.com/selva86/datasets/master/Cars93_miss.csv')
Desired output
Solution
cars_dataset[["Manufacturer", "Model", "Type"]][::20]
| Manufacturer | Model | Type | |
|---|---|---|---|
| 0 | Acura | Integra | Small |
| 20 | Chrysler | LeBaron | Compact |
| 40 | Honda | Prelude | Sporty |
| 60 | Mercury | Cougar | Midsize |
| 80 | Subaru | Loyale | Small |
We start by selecting the 3 columns and step by 20 on each row using indexing.
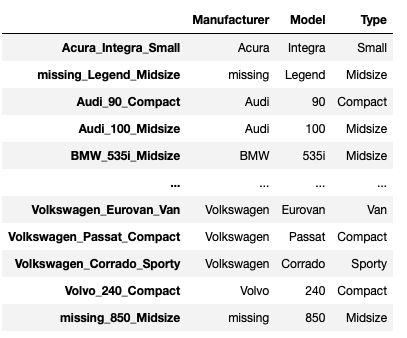
Ex 50: How to create a primary key index by combining relevant columns?
Q: In cars_dataset, Replace NaNs with missing in columns Manufacturer, Model and Type and create an index as a combination of these three columns and check if the index is a primary key.
cars_dataset = pd.read_csv('https://raw.githubusercontent.com/selva86/datasets/master/Cars93_miss.csv', usecols=[0,1,2,3,5])
Desired output
Solution
replaced_nan = cars_dataset[["Manufacturer", "Model", "Type"]].fillna(value="missing")
replaced_nan
| Manufacturer | Model | Type | |
|---|---|---|---|
| 0 | Acura | Integra | Small |
| 1 | missing | Legend | Midsize |
| 2 | Audi | 90 | Compact |
| 3 | Audi | 100 | Midsize |
| 4 | BMW | 535i | Midsize |
| ... | ... | ... | ... |
| 88 | Volkswagen | Eurovan | Van |
| 89 | Volkswagen | Passat | Compact |
| 90 | Volkswagen | Corrado | Sporty |
| 91 | Volvo | 240 | Compact |
| 92 | missing | 850 | Midsize |
93 rows × 3 columns
replaced_nan.set_index(replaced_nan["Manufacturer"]+"_"+replaced_nan["Model"]+"_"+replaced_nan["Type"])
| Manufacturer | Model | Type | |
|---|---|---|---|
| Acura_Integra_Small | Acura | Integra | Small |
| missing_Legend_Midsize | missing | Legend | Midsize |
| Audi_90_Compact | Audi | 90 | Compact |
| Audi_100_Midsize | Audi | 100 | Midsize |
| BMW_535i_Midsize | BMW | 535i | Midsize |
| ... | ... | ... | ... |
| Volkswagen_Eurovan_Van | Volkswagen | Eurovan | Van |
| Volkswagen_Passat_Compact | Volkswagen | Passat | Compact |
| Volkswagen_Corrado_Sporty | Volkswagen | Corrado | Sporty |
| Volvo_240_Compact | Volvo | 240 | Compact |
| missing_850_Midsize | missing | 850 | Midsize |
93 rows × 3 columns
We first select the 3 columns and use the fillna function to replace all the occurrences of nan by the string missing then store it the replace_nan variable.
We call the set_index function on that dataframe to give it a new index column whereby each index value is a concatenation of the values from Manufacturer with the values in Model and lastly the values in Type.
Conclusion
In this part 2 of the pandas series, we have introduced the dataframe data structure which is the main data structure of Pandas. We have discovered how to import data from a CSV file, different ways to manipulate the data and many more techniques that you will be using on a daily basis if you will be working as a machine learning engineer or data scientist.
Remember that 60% of the time spent on end-to-end machine learning project is dedicated to data cleaning and visualization. So Pandas, NumPy and Matplotlib (and Seaborn) are fantastic tools to learn and master. Practice makes perfect.
In the next post, we will explore more advanced Pandas exercises that I am sure you will enjoy. Find the jupyter notebook version of this post on my GitHub profile here.
Thank you again for doing these exercises with me. I hope you have learned one or two things. If you like this post, please subscribe to stay updated with new posts, and if you have a thought or a question, I would love to hear it by commenting below. Cheers, and keep learning!